Natural Science
Vol.5 No.8A2(2013), Article ID:35925,9 pages DOI:10.4236/ns.2013.58A2004
An ultrasound elastography method for examining the anterior cruciate ligament
![]()
1Center for Applied Mathematics, Cornell University, Ithaca, USA
2Sibley School of Mechanical and Aerospace Engineering, Cornell University, Ithaca, USA; *Corresponding Author: yg75@cornell.edu
Copyright © 2013 Amy L. Cochran, Yingxin Gao. This is an open access article distributed under the Creative Commons Attribution License, which permits unrestricted use, distribution, and reproduction in any medium, provided the original work is properly cited.
Received 17 May 2013; revised 17 June 2013; accepted 24 June 2013
Keywords: Anterior Cruciate Ligament; Ultrasound Elastography; Strain Imaging; Strain Patterns
ABSTRACT
We introduce an ultrasound elastography method for examining the ACL. It consisted of imaging the distal ACL while applying a drawer test and analyzing the resulting displacement and strain maps, where a map refers to how a variable is distributed spatially throughout an image. Our method was applied to healthy knees of cadaveric sheep to determine whether 1) our method can consistently generate displacements and strain maps in healthy ACLs; 2) displacement and strain maps are repeatable; and 3) healthy ACLs experience similar maps. We found that our method could consistently provide displacements and strain maps of the distal ACL region. Moreover, these ACLs experienced displacement and strain maps that were positivelycorrelated between trials, knees, and specimens. This correlation was statistically significant between pairs of trials and between left and right knees (p < 0.05). These results suggest that the maps are indeed repeatable and similar for healthy ACLs.
1. INTRODUCTION
Ultrasound is increasingly recognized for its diagnostic value when applied to musculoskeletal soft tissues [1]. For one reason, ultrasound is particularly well-suited for frequent and impromptu evaluations when compared to other modalities, such as magnetic resonance imaging and x-ray. For another, ultrasound promises accurate diagnoses of many medical disorders of musculoskeletal soft tissues. One such disorder is the rupture of the anterior cruciate ligament [2,3]. Even if MRI remains the more popular modality for diagnosing ACL ruptures, ultrasound may help improve the outcome of patients with ACL injuries, that is, if it can be used to diagnose partial ruptures or monitor the ACL during treatment. However, ultrasound may not provide useful information in these settings. Namely, it is unclear whether ultrasound can detect structural changes to the ACL other than complete ruptures.
Here, we explore the possibility of using ultrasound elastography to assess structural changes to the ACL. Current ultrasound methods fall into two categories: indirect and direct. Indirect methods aim to identify indirect signs of injury. Examples of indirect signs include poor echoicity due to a hematoma at the ACLs femoral insertion or excessive anterior translation of the tibia. Direct methods aim to detect ACL ruptures through direct visualization of the rupture. Both methods have been able to accurately diagnose ACL ruptures. Indirect methods have achieved 85% - 91% sensitivity and 80% - 100% specificity [2-6]. Direct methods have achieved perfect accuracy in one study on nine knees [7] and 76% sensitivity and 100% specificity in another study on 60 knees [8]. For comparison, magnetic resonance imaging has achieved an average of 86.5% sensitivity and 95.2% specificity over multiple studies when diagnosing ACL ruptures [9].
Although current ultrasound methods can diagnose complete ruptures of the ACL, they do not accurately diagnose partial ruptures. For example, a hematoma is associated with both partial and complete ruptures, making it difficult to distinguish between the two cases [2]. The direct method in [8] also misdiagnoses partial tears. With a direct method, the main issue is the ACL is difficult to image [2]. A posterior window sometimes captures the proximal third of an ACL [10], and so, an anterior window is preferred. However, an anterior window only captures the distal and middle third of the ACL [7,8,10,11]. Therefore, a new method is needed to assess ACL injuries other than complete ruptures.
One possibility is to incorporate quasi-static ultrasound elastography (UE) into a direct method. Quasistatic UE consists of applying quasi-static loading to the soft tissue, imaging the tissue with ultrasound, and estimating tissue displacements from the images [12,13]. Tissue strain or modulus can be estimated from tissue displacements and then used to diagnose musculoskeletal injuries [14-21]. Because structural changes contribute to tissue mechanics, quasi-static ultrasound elastography may help detect structural changes in the ACL. It may also help to overcome a small imaging window, because strain and displacements depend on the structure of the entire ACL. In other words, strain and displacements in the imaging window may be affected by structural changes that are located both inside and outside the imaging window.
In this paper, we present a freehand, ultrasound elastography method for the ACL. We use the anterior imaging window mentioned above, along with a drawer test and a new analysis of tissue displacements. A drawer test, which is clinically relevant to the ACL, consists of manually applying an anterior force to the tibia while the knee is in flexion. Our new analysis is based on the work in [17], which suggests that Achilles tendons can be evaluated qualitatively using strain patterns. A pattern is intuitively understood to be the way in which variable is distributed spatially throughout the tissue. Strain patterns may potentially be more robust than strain itself to the variation in imaging windows and loading conditions that accompany a freehand method. We precisely define a term called a map that is consistent with this understanding of patterns and that allows us to quantitatively compare maps between examinations.
We tested our method on eight knees excised from four sheep. We started with an animal study, because there are no related human or animal studies. Sheep are considered an appropriate animal model for studying biomechanics of human cruciate ligaments [22]. The long-term objective is to test whether our method can evaluate structural changes of the ACL other than complete ruptures. As a first step towards that objective, the objectives of the present study were to determine whether 1) our method can consistently generate displacements and strain maps in healthy ACLs; 2) displacement and strain maps are repeatable; and 3) healthy ACLs experience similar maps. The last two objectives were tested by determining whether maps of healthy ACLs are positively-correlated between pairs of trials, between left and right knees, and between specimens.
2. MATERIALS AND METHODS
2.1. Experiment
Eight knees were obtained from four sheep freshly slaughtered at Cornell University’s sheep farm. The knees were skinned, and all soft tissue distal to the knee capsule was removed. The knee capsule was left intact except for a small incision on the anterolateral side of knee, which helped ensure that the correct structure was imaged and the ACL was intact. The ends of the tibia and femur were potted in metal cylinders using epoxy and mounted to an in-house designed rig (Figure 1). The potted ends were connected to the rig via pin connections. These pins helped replicate the mechanics of the ankle and hip joint by allowing the femur and tibia to rotate in the sagittal plane before reaching an equilibrium position. The knee was flexed to 115 degrees in our study. Clinical examinations, either a drawer test or Lachman’s test, typically evaluate the ACL when the knee is flexed at 30 and 90 degrees, respectively. However, a flexion angle larger than 90 degrees opens the knee joint and improves visualization of the ACL. Although the larger flexion angle does not agree with current examination procedures, previous research have used the larger flexion angle to diagnose ACL ruptures with ultrasound [7,8, 10,11].
Distal ACLs were imaged from outside the knee capsule using a window similar to the one described in [11]. This approach tries to align the transducer parallel to the ACLs long-axis in order to maximize ACL echoicity. To this end, a 7.5 MHz linear transducer with a 38 mm physical footprint (Model 12L5, Terason, Burlington, MA, USA) was placed on the anteromedial side of the knee capsule and aligned parallel to the sagittal plane. The transducers proximal tip was tilted laterally about 15 degrees and pressed into the knee. The transducer was finely adjusted to maximize ACL hypoechoicity. In the resulting images, the ACL was identified as a structure lying flush to the tibia (Figure 2). The ACL was then loaded by manually applying an anterior force behind the
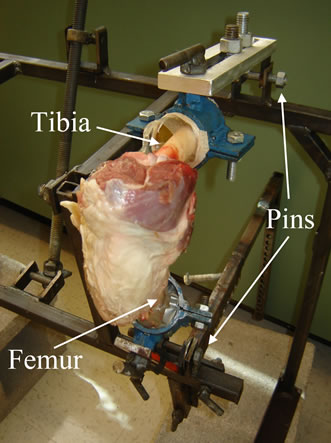
Figure 1. Sheep knees were mounted to a rig that was designed to allow the simulation of a drawer test on cadaveric knees.
knee. Sequences of image frames were captured at a 32 Hz frame rate and stored for off-line analysis. Each image frame had 204 A-lines spaced 188 µm apart with points sampled at 30 MHz along each line.
2.2. Displacement and Strain Estimation
Displacements and strains were estimated from sequences of ultrasound images. Each image was up-sampled by a factor of three and four in the axial and lateral directions respectively, where the lateral direction is the direction perpendicular to the axial direction and parallel to the length of the transducer. ACLs were manually defined in the first frame of each sequence as the region between the tibia plateau and the ACLs hyperechoic anterior surface.
Axial displacements were estimated between consecutive frames and added together over the entire sequence to generate cumulative displacement images (Figure 3). Displacements between each frame were estimated using the hybrid method [23], which combines ideas from four algorithms: multigrid [24], quality-guided [25], phasezero [26], and cross-correlation [12], into three levels of computation. At each level, ultrasonic speckle in rectangular windows is compared between frames, and displacement estimates are given as lags between windows in one frame that are most similar to windows in the other frame. The quality-guided aspect of the method seeds points with the most accurate displacement of neighboring points. Speckle similarity is calculated using 2D normalized cross-correlation in the first two levels and phase-zero in the final level. Equally spaced points are tracked at each level, but point spacing and window size are decreased at successive levels. Coarser levels are suggested to require window sizes greater than 10 wavelengths with no need for window overlap, whereas finer levels are suggested to have smaller window sizes and

Figure 2. Ultrasound images of sheep ACLs. The distal ACL was consistently identified as the structure that ran along the tibia plateau and extended towards the femur. Scale bars represent 2 mm.

Figure 3. Maps of (a) axial displacement in millimeters and (b) cumulative axial strain within the ACL’s distal third. Negative displacement corresponds with movement towards the transducer, i.e. towards the top of the page. Scale bar represents 2 mm (Online version in color).
larger window overlap [23,24]. In our method, 12 wavelength-by-12 wavelength windows were used at the first level; adjacent windows had 17% overlap in both the axial and lateral direction. The second level used 10 wavelength-by-10 wavelength windows with 50% window overlap in both directions, and the last level used 6 wavelength-by-6 wavelength windows with 90% and 96% overlap in the axial and lateral directions respectively. Our method also included an 11 sample-by-11 sample regularization of the displacements at the third level [27].
Cumulative axial displacements were smoothed using a median filter [28] with a 3 wavelength-by-3 wavelength kernel followed by a denoising algorithm [29,30] with its parameter, λ, set to 10. Displacement maps were analyzed when the average ACL displacement towards the transducer was maximal. Cumulative axial strain (Figure 3), the partial derivative of axial displacement with respect to the axial coordinate, was estimated from cumulative displacement via linear least squares [31] using a 4 wavelength-by-4 wavelength kernel.
Displacement error was evaluated based on the signal to noise ratio:
 (1)
(1)
where μd is mean of the displacements and σn is standard deviation of displacement noise. Displacement noise was obtained by estimating displacements within an unloaded ACL between six image frames. Standard deviation of displacements was estimated from each pair of image frames, the average of which was taken to be σn. Average displacements were then calculated for image pairs in each truncated image sequence, and averaged over the sequence giving μd for each knee.
2.3. Displacement and Strain Maps
A map of displacement (or strain) was defined as a function from a certain region of the ACL to displacement (or strain) estimated in this region of the ACL. Displacement and strain can be estimated using the techniques described above. However, this definition required designating the region of the ACL and the coordinate system for this region. Both the chosen region of the ACL and the coordinate system were subject to change along with any change to the image of an ACL, unless we accounted for differences in patient anatomy and imaging windows. Image registration was used to help account for these differences by recovering a transformation that brings one image of an ACL onto another. A vast amount of literature is devoted to developing techniques to register geometric objects, including geometric objects that represent images of anatomical structures [32]. For a given image registration technique, each image of an ACL can be registered to a fixed, two-dimensional region with a fixed coordinate system. That way, points in the fixed region had corresponding points in each image. For each image, a map of a certain variable was then defined as the function from a point in the fixed region to the estimated value of the variable at the corresponding point in the image.
Piece-wise affine registration was used to register each ACL to a rectangle . To delineate an ACL, twelve points were manually marked along the hyperechoic portion of the anterior and tibia side of the ACL. The delineated anterior and tibia side of the ACL were used to determine the ACL midline, the line that lay midway between the two sides. The most proximal points on the anterior and tibia side were projected onto the midline. A line was drawn perpendicular to the midline, connecting the anterior and tibia side and containing the more distal of the two projected points. The ACL midline was cropped at this perpendicular. A piece-wise affine registration was then performed to register the ACL to the rectangle
  such that the perpendicular was registered to the straight line connecting (0,−0.5) and (0,0.5) and the midline was registered to the straight line between (0,0) and (1,0).
Using the image registration, displacement and strain maps were tested for correlation. In the rectangle described above, a 10 × 10 grid was defined at points  for
for  with
with
 (2)
(2)
and
 (3)
(3)
Displacements and strains were resampled at the hundred points in the images that corresponded to these hundred points in the grid (Figure 4). A point was removed from subsequent analysis if the point or one of its corresponding points lay outside the ACL.
2.4. Statistics
Sampled displacements and strains were reshaped into vectors, and Pearson correlation coefficients,  , were calculated from the vectors, where
 (4)
(4)
for vectors of equal size and where zT, μz, and σz denote respectively transpose, mean, and standard deviation of any vector z.
Pearson correlation coefficients were measured for each pair of trials. Students t-tests were performed to evaluate whether these inter-trial correlation coefficients for the right knee were significantly different from zero and inter-trial correlation coefficients for the left knee were significantly different from zero. Right and left knees were considered separately to control for differences between examinations that could have resulted from the examiners handedness when simultaneously performing the drawer test and imaging the ACL. Next, sample means of displacement and strain vectors were taken over repeated trials. Instead of sample means, two vectors could have been weighted differently to reflect differences in loading magnitudes. However, loading magnitudes were not recovered, and so, sample means ensure that one trial is not biased over another. Correlation coefficients were calculated comparing sample means of vectors from each knee within specimens, and a Students t-test was performed on these inter-knee correlation coefficients. Lastly, sample means of displacements and strains were taken over the four trials performed for each specimen. Correlation coefficients were

Figure 4. A rectangle was registered to the delineated distal portion of the ACL. Displacements and strains were sampled within the ACL at 100 points, which corresponded to a 10 × 10 grid in the rectangle. Length L and width W of the distal portion were measured for each ACL.
then calculated comparing each of possible pairs of the sample means. Four specimens lead to six possible pairs of sample means. Student’s t-test was not performed on these inter-specimen correlation coefficients, because they were not statistically independent. Statistical significance was considered p < 0.05.
3. RESULTS
Ultrasound consistently captured the portion of the ACL lying on the tibia plateau, which approximately constitutes the distal third of the ACL (Figure 2). The anterior surface of the ACL could be delineated for this portion, but the surfaces hyperechoicity decreased moving proximally off the tibia. The ACL-tibia surface was easy to identify, since bone strongly reflects ultrasound waves. Between these two surfaces, the ACL was hypoechoic relative to the surrounding soft tissues with greatest echoicity in the more distal regions of the ACL. Lack of definition beyond the tibial insertion limited the portion of the ACL that could be reliably identified. Even though the distal ACL was consistently captured, the size of the delineated portion of the ACL varied among trials and specimens. Width and length of the distal ACL had mean and standard deviation values of 2.3 ± 0.23 mm and 8.0 ± 1.4 mm respectively, whereas absolute differences in width and length between trials had mean and standard deviation values of 0.28 ± 0.23 mm and 0.76 ± 0.53 mm respectively. For reference, sheep ACLs flexed to 90 degrees had an average cross-sectional area of 22 ± 3 mm and length 23 ± 1 mm [33].
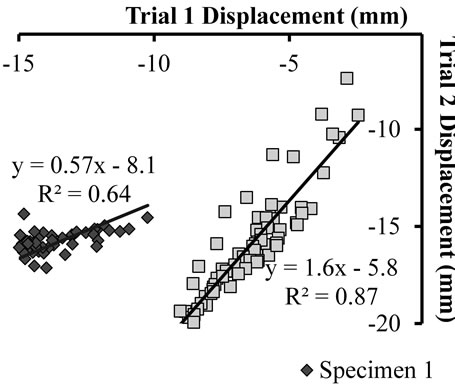
Maps of cumulative axial displacement had positive correlation between pairs of repeated trials, knees, and specimens (Figures 5 and 6). Positive correlation was statistically different from zero between trials within the left (p < 0.0001) and right knee (p < 0.04) and between the left and right knee (p < 0.01). Positive correlation was also observed between displacement maps in each possible pair of specimens (R = 0.64 ± 0.24). Correlated displacement maps were illustrated in both images of cumulative axial displacement (Figure 7) and graphs in which displacement of each grid point in one trial was plotted against the displacement of its corresponding grid point in the second trial (Figure 8). The images show the ACL moved towards the transducer (anteriorly) during the drawer test, while the anterior surface moved closer to the ACLs tibia surface. The proximal-anterior corner of the ACL moved away from the transducer (posteriorly) relative to the rest of the ACL. Positive correlation of displacement maps is manifest as a linear relationship between trials in the graph. However, displacements were not exactly replicated otherwise the regression line would be near the y = x line and displacements would have similar mean values and ranges. Average displacements ranged from −0.18 up to −0.02 mm among the

Figure 5. Correlation of displacement and strain maps between pairs of trials and between left and right knees. The asterisk denotes statistical difference from zero (p < 0.05).
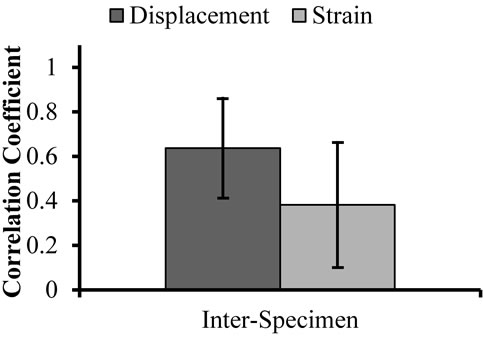
Figure 6. Correlation of displacement and strain maps between specimens.

Figure 7. Maps of displacement and strain within the distal portion of a sheep’s ACLs. Left panel shows displacement in millimeters of repeated trials in the (a) left and (b) right knees. Negative displacement corresponds with movement towards the transducer, i.e. towards the top of the page. Right panel shows strain of repeated trials in the (c) left and (d) right knees of the same sheep. Scale bar is 2 mm (online version in color).
eight trials. Displacement signal to noise ratio was 12.7 ± 2.3 decibels over image sequences.
 (a)
(a) (b)
(b)
Figure 8. (a) Displacement and (b) strain at each grid point in one trial graphed against displacement and strain at the corresponding grid point in the second trial.
Similar to displacement maps, cumulative axial strain maps had positive correlation between pairs of trials, knees, and specimens (Figures 5 and 6), but were generally more weakly correlated than displacement maps. This correlation was statistically different from zero between trials in the right (p < 0.01) and left knee (p < 0.03), and between the left and right knee (p < 0.04). Positive correlation was observed between strain maps in pairs of specimens, but these correlation values were the smallest compared to other correlation values. Correlated strain maps were illustrated in both images of cumulative axial strain (Figures 7(c) and (d)) and graphs in which strain at each grid point in one trial was plotted against strain at its corresponding grid point in the repeated trial (Figure 8). The ACL experienced mostly negative strains with more negative strains occurring in the more proximal region of the distal ACL. Positive correlation of strain maps manifested as a linear relationship between trials in the graph, but strain was not exactly replicated as indicated by variable means, variable ranges, and regression slopes that were not equal to one. Average strains ranged from −2.9% up to −0.024% among the eight trials.
4. DISCUSSION
In this paper, we described a freehand, ultrasound elastography method to examine the ACL. It consisted of imaging the distal ACL while applying a drawer test and analyzing the resulting displacement and strain maps. We consider a map to be the spatial distribution of a variable, either strain or displacement, throughout the ACL. The objectives of the present study were to determine whether 1) our method can consistently generate displacements and strain maps in healthy ACLs; 2) displacement and strain maps are repeatable; and 3) healthy ACLs experience similar maps. The last two objectives were tested by verifying that maps of healthy ACLs are positively-correlated between pairs of trials, knees, and specimens. Our method was tested on eight knees obtained from four cadaveric sheep. Although the ACL had previously been evaluated with elastography [34], our study provides the first elastographic, in situ examination of the ACL and the first effort to quantitatively analyze displacement and strain maps.
Results from our experiment supported our objectives. We were able to consistently image the distal third of the ACL and generate displacement and strain maps in this region. Additionally, displacement and strain maps had positive correlation between pairs of trials, knees, and specimens. This correlation was statistically significant between pairs of trials and between left and right knees (p < 0.05). Moreover, we believe that the maps agreed with the prescribed loading conditions. A drawer test stretches the ACL along the fiber direction [35]. The ACL would contract orthogonal to the fiber direction if the ACL is to maintain nearly constant volume; ligaments are commonly used to be nearly incompressible [36]. The axial direction was more closely aligned orthogonal rather than parallel to fiber direction to improve hyperechoicity. Therefore, negative strains are expected in the axial direction and agree with our results.
An analysis based on maps of displacements and strains was presented to help account for variable loading, imaging windows, material properties, and anatomy. Indeed, average displacements ranged from −0.18 to −0.02 mm and average strains ranged from −2.9% up to −0.024% among the eight trials. Additionally, standard deviations of ACL dimensions across specimens and trials had values that were 10% of their mean value. Previous studies have also analyzed musculoskeletal soft tissues based on spatial distributions of strain; however, these distributions were analyzed qualitatively through visual inspection of strain patterns [14-16,37]. In contrast, our analysis has the benefit of being quantitative.
Although our analysis was presented to account for variation, it accounts for some, but not all of the variation between examinations. For example, a scaling or shift in the values of displacement or strain does not affect correlation coefficients. This invariance helps partly to account for a change in loading conditions, since a change in loading magnitude would likely cause a change in the range and mean of displacements and strains. Additionally, our analysis could register two regions that may differ by a piece-wise affine transformations, helping to build a correspondence between images that resulted from different imaging windows and from ACLs with different geometries. However, invariance to scaling and shifts in displacements and strains does not precisely account for a change in loading magnitude, since neither displacements nor strains are linearly related to loading magnitude; nonlinearity arises in ACL material behavior and geometry. This invariance also does not account for changes in loading direction. Moreover, image registration cannot account for changes to the axial direction and to the imaging plane, as well as for changes in anatomy that are not piece-wise affine.
Another issue arising from the present study was the relative hypoechoicity of the ACL. Previous studies imaged the middle and distal thirds of the ACL [7,11]. Yet, we were only able to analyze the distal third of the ACL, because the middle portion of the ACL was hypoechoic and difficult to delineate. Even the distal third was relatively hypoechoic when compared to surrounding tissue, which can lead to poor sonographic and elastographic signal-to-noise ratios [38]. A possible explanation for the hypoechoicity was that the axial direction was not orthogonal to the ACL’s long-axis, whereas ligament echoicity is typically optimized when the axial direction is orthogonal to the long-axis [10]. In contrast, the images presented in [11] and [7] appear as if the axial direction was orthogonal to the ACL long-axis. A larger flexion angle may help align the ACL more orthogonal to the axial direction, resulting in ACL hyperechoicity. However, we could not compare flexion angles, since flexion angles were not reported precisely in [11] or [7].
In addition to poor hypoechocity, there were three other limitations of our study. First, we only measured axial displacements, since lateral displacements are difficult to estimate accurately [13]. Consequently, measured displacements depend on the angle between the ACL and axial direction. Negative axial strain becomes difficult to interpret, since it can signify compression and rotation. Second, the proximal and distal thirds were not examined. Therefore, proximal and distal thirds can only be evaluated if maps in the distal ACL are sensitive to changes outside the distal ACL. Sensitivity might decrease with increasing distance from the distal ACL. Therefore, we would need to test whether our method is sensitive to changes outside the imaging window.
Third, future work must address the gap between our study and clinical applications. Our method was tested in situ on sheep knees, a setting which has anticipated differences from clinical study. Sheep and human knees may differ in their biomechanics and how they are imaged. However, our imaging protocol followed the technique described for human knees [11] and sheep have been verified as a valid animal model for biomechanics of human cruciate ligaments [22]. Differences between in vivo and in situ examination may be more significant. Imaging may differ as a result of an absence of muscle tone and lack of synovial fluid. On one hand, muscle tone keeps the in vivo patella tendon taut, affecting the placement of the transducer. Muscle tone may also alter loading conditions on the ACL during a drawer test, even though patients are asked to relax their muscles. On the other hand, more synovial fluid may improve propagation of ultrasound waves and increase ACL hyperechoicity. Additionally, mechanical properties of soft tissue differ between in situ and in vivo examinations [39], but it is unclear how this difference would affect displacement and strain maps.
5. CONCLUSION
In the present study, we presented a freehand, ultrasound-based method for evaluating the ACL. The importance of developing a method is two-fold: to offer diagnoses that are timely, inexpensive and accessible, compared to MRI and arthroscopy and to provide structural information that can help determine appropriate treatment. Ultrasound-based methods are noninvasive, inexpensive, and accessible, but have currently only been able to diagnose ACL ruptures. The benefits of the method described in our study include that it is ultrasound-based and images are collected outside of the knee with a clinically-relevant drawer test. These benefits lay the foundation for future clinical application. In addition, our study supported the specific hypothesis that displacement and strain maps with the ACL have positive correlation between trials, knees, and specimens. This first success provides the rationale for testing whether healthy and injured ACLs may be differentiated based on their maps of displacements and strains.
![]()
![]()
REFERENCES
- Jacobson, J.A. (2005) Musculoskeletal ultrasound and MRI: Which do I choose? Seminars in Musculoskeletal Radiology, 9, 135-149. doi:10.1055/s-2005-872339
- Larsen, L.P.S. and Rasmussen, O.S. (2000) Diagnosis of acute rupture of the anterior cruciate ligament of the knee by sonography. European Journal of Ultrasound, 12, 163-167. doi:10.1016/S0929-8266(00)00109-9
- Palm, H.-G., Bergenthal, G., Ehry, P., Schwarz, W., Schmidt, R. and Friemert, B. (2009) Functional ultrasonography in the diagnosis of acute anterior cruciate ligament injuries: A field study. The Knee, 16, 441-446. doi:10.1016/j.knee.2009.04.012
- Fuchs, S. and Chylarecki, C. (2002) Sonographic evaluation of ACL rupture signs compared to arthroscopic findings in acutely injured knees. Ultrasound in Medicine & Biology, 28, 149-154. doi:10.1016/S0301-5629(01)00507-5
- Ptasznik, R., Feller, J., Bartlett, J., Fitt, G., Mitchell, A. and Hennessy, O. (1995) The value of sonography in the diagnosis of traumatic rupture of the anterior cruciate ligament of the knee. American Journal of Roentgenology, 164, 1461-1463. doi:10.2214/ajr.164.6.7754893
- Chylarecki, C., Hierholzer, G. and Klose, R. (1996) Sonographische diagnostik der frischen rupturen des vorderen kreuzbands. Eine experimentelle und klinische studie. Unfallchirurg, 99, 24-30.
- Suzuki, S., Kasahara, K., Futami, T., Iwasaki, R., Ueo, T. and Yamamuro, T. (1991) Ultrasound diagnosis of pathology of the anterior and posterior cruciate ligaments of the knee joint. Archives of Orthopaedic and Trauma Surgery, 110, 200-203. doi:10.1007/BF00571059
- Khan, Z., Faurqui, Z., Ogyunbiyi, O., Rosset, G. and Iqbal, J. (2006) Ultrasound assessment of internal derangement of the knee. Acta Orthopaedica Belgica, 72, 72-76.
- Crawford, R., Walley, G., Bridgman, S. and Maffulli, N. (2007) Magnetic resonance imaging versus arthroscopy in the diagnosis of knee pathology, concentrating on meniscal lesions and ACL tears: A systematic review. British Medical Bulletin, 84, 5-23. doi:10.1093/bmb/ldm022
- Grobbelaar, N. and Bouffard, J. (2000) Sonography of the knee, a pictorial review. Seminars in Ultrasound, CT, and MRI, 21, 231-274. doi:10.1016/S0887-2171(00)90045-3
- Ceulemans, R. and Holsbeeck, M. (2001) Sonography of the knee. In: van Holsbeeck, M. and Introcaso, J., Eds., Musculoskeletal Ultrasound, Mosby, 587-604.
- Ophir, J., Céspedes, I., Ponnekanti, H., Yazdi, Y. and Li, X. (1991) Elastography: A quantitative method for imaging the elasticity of biological tissues. Ultrasonic Imaging, 13, 111-134.
- Ophir, J., Alam, S., Garra, B., Kallel, F., Konofagou, E., Krouskop, T. and Varghese, T. (2002) Elastography: Imaging the elastic properties of soft tissues with ultrasound. Journal of Medical Ultrasonics, 29, 155-171. doi:10.1007/BF02480847
- De Zordo, T., Lill, S., Fink, C., Feuchtner, G., Jaschke, W., Bellmann-Weiler, R. and Klauser, A. (2009) Real-time sonoelastography of lateral epicondylitis: Comparison of findings between patients and healthy volunteers. American Journal of Roentgenology, 193, 180-185. doi:10.2214/AJR.08.2020
- De Zordo, T., Fink, C., Feuchtner, G., Smekal, V., Reindl, M. and Klauser, A. (2009) Real-time sonoelastography findings in healthy achilles tendons. American Journal of Roentgenology, 193, W134-W138. doi:10.2214/AJR.08.1843
- De Zordo, T., Chhem, R., Smekal, V., Feuchtner, G., Reindl, M., Fink, C. and Klauser, S.A. (2010) Real-time sonoelastography: Findings in patients with symptomatic achilles tendons and comparison to healthy volunteers. Ultraschall in der Medizin, 31, 394-400. doi:10.1055/s-0028-1109809
- Drakonaki, E.E, Allen, G. and Wilson, D. (2009) Realtime ultrasound elastography of the normal achilles tendon: Reproducibility and pattern description. Clinical Radiology, 64, 1196-1202. doi:10.1016/j.crad.2009.08.006
- Drakonaki, E.E., Allen, G.M. and Wilson, D.J. (2012) Ultrasound elastography for musculoskeletal applications. British Journal of Radiology, 85, 1435-1445. doi:10.1259/bjr/93042867
- Kapoor, A., Sandhu, H.S., Sandhu, P.S., Kapoor, A., Mahajan, G. and Kumar, A. (2010) Realtime elastography in plantar fasciitis: Comparison with ultrasonography and MRI. Current Orthopedic Practice, 21, 600-608. doi:10.1097/BCO.0b013e3181f4a8d9
- Kuo, P.-L., Li, P.-C., Shun, C.-T. and Lai, J.-S. (1999) Strain measurements of rabbit achilles tendons by ultrasound. Ultrasound in Medicine & Biology, 25, 1241-1250. doi:10.1016/S0301-5629(99)00078-2
- Wu, C.-H., Chang, K.-V., Mio, S., Chen, W.-S. and Wang, T.-G. (2011) Sonoelastography of the plantar fascia. Radiology, 259, 502-507. doi:10.1148/radiol.11101665
- Radford, W., Amis, A., Kempson, S., Stead, A. and Camburn, M. (1994) A comparative study of single-and double-bundle acl reconstructions in sheep. Knee Surgery, Sports Traumatology, Arthroscopy, 2, 94-99. doi:10.1007/BF01476480
- Chen, L., Housden, R., Treece, G., Gee, A. and Prager, R. (2010) A hybrid displacement estimation method for ultrasonic elasticity imaging. IEEE Transactions on Ultrasonics Ferroelectrics and Frequency Control, 57, 866- 882. doi:10.1109/TUFFC.2010.1491
- Chen, H., Shi, H. and Varghese, T. (2007) Improvement of eleastographic displacement estimation using a twostep cross-correlation method. Ultrasound in Medicine & Biology, 33, 48-56. doi:10.1016/j.ultrasmedbio.2006.07.022
- Chen, L., Treece, G.M., Lindop, J.E., Gee, A.H. and Prager, R.W. (2009) A quality-guided displacement tracking algorithm for ultrasonic elasticity imaging. Medical Image Analysis, 13, 286-296. doi:10.1016/j.media.2008.10.007
- Pesavento, A., Perrey, C., Krueger, M. and Ermert, H. (1999) A time-efficient and accurate strain estimation concept for ultrasonic elastography using iterative phase zero estimation. IEEE Transactions on Ultrasonics Ferroelectrics and Frequency Control, 46, 1057-1067. doi:10.1109/58.796111
- Pellot-Barakat, C., Frouin, F., Insana, M. and Herment, A. (2004) Ultrasound elastography based on multiscale estimations of regularized displacement fields. IEEE Transactions on Medical Imaging, 23, 153-163. doi:10.1109/TMI.2003.822825
- Doyley, M.M., Bamber, J.C., Fuechsel, F. and Bush, N.L. (2001) A freehand elastographic imaging approach for clinical breast imaging: System development and performance evaluation. Ultrasound in Medicine & Biology, 27, 1347-1357. doi:10.1016/S0301-5629(01)00429-X
- Bresson, X. and Chan, T. (2007) Fast minimization of the vectorial total variation norm and applications to color image processing. UCLA CAM Report.
- Chambolle, A. (2004) An algorithm for total variation minimization and applications. Journal of Mathematical Imaging and Vision, 20, 89-97. doi:10.1023/B:JMIV.0000011321.19549.88
- Kallel, F. and Ophir, J. (1997) A least-squares strain estimator for elastography. Ultrasonic Imaging, 19, 195-208. doi:10.1177/016173469701900303
- Brown, L.G. (1992) A survey of image registration techniques. ACM Computing Surveys, 24, 325-376. doi:10.1145/146370.146374
- Rogers, G., Milthorpe, B., Muratore, A. and Schindhelm, K. (1990) Measurement of the mechanical properties of the ovine anterior cruciate ligament bone-ligament-bone complex: A basis for prosthetic evaluation. Biomaterials, 11, 89-96. doi:10.1016/0142-9612(90)90122-7
- Spalazzi, J.P., Gallina, J., Fung-Kee-Fung, S.D., Konofagou, E.E. and Lu, H.H. (2006) Elastographic imaging of strain distribution in the anterior cruciate ligament and at the ligament bone insertions. Journal of Orthopaedic Research, 24, 2001-2010. doi:10.1002/jor.20260
- Arms, S., Pope, M., Johnson, R., Fischer, R., Arvidsson, I. and Eriksson, E. (1984) The biomechanics of anterior cruciate ligament rehabilitation and reconstruction. American Journal of Sports Medicine, 12, 8-18. doi:10.1177/036354658401200102
- Weiss, J.A. and Gardiner, J.C. (2001) Computational modeling of ligament mechanics. Critical Reviews in Biomedical Engineering, 29, 303-371. doi:10.1615/CritRevBiomedEng.v29.i3.20
- Tan, S., Kuda, S., Zcan, A., Pek, A., Karaolanolu, M., Arslan, H. and Bozkurt, M. (2012) Real-time sonoelastography of the achilles tendon: Pattern description in healthy subjects and patients with surgically repaired complete ruptures. Skeletal Radiology, 41, 1067-1072. doi:10.1007/s00256-011-1339-4
- Srinivasan, S., Kallel, F. and Ophir, J. (2002) Estimating the elastographic signal-to-noise ratio using correlation coefficients. Ultrasound in Medicine & Biology, 28, 359- 368. doi:10.1016/S0301-5629(01)00510-5
- Ottensmeyer, M.P., Kerdok, A.E., Howe, R.D. and Dawson, S.L. (2004) The effects of testing environment on the viscoelastic properties of soft tissues. In: Cotin, S. and Metaxas, D., Eds., Medical Simulation, Vol. 3078, Springer, Berlin Heidelberg, 9-18. doi:10.1007/978-3-540-25968-8_2