Natural Science
Vol.5 No.5A(2013), Article ID:32010,9 pages DOI:10.4236/ns.2013.55A004
Stressor analysis approaches for endangered species assessments
![]()
Exponent, Bellevue, USA; *Corresponding Author: gardn@exponent.com
Copyright © 2013 Johanna H. Salatas et al. This is an open access article distributed under the Creative Commons Attribution License, which permits unrestricted use, distribution, and reproduction in any medium, provided the original work is properly cited.
Received 4 April 2013; revised 4 May 2013; accepted 18 May 2013
Keywords: Endangered species act; risk management; conservation priorities; multiple stressor analysis; causal analysis
ABSTRACT
The US Endangered Species Act is legislation with the power to limit human activities that may have deleterious effects on the viability of threatened and endangered species of fauna and flora. However, because most endangered species face multiple threats, it is often unclear whether limiting specific activities will improve the likelihood of long-term survival, particularly when the relative importance of different stressors is uncertain. Wildlife managers responsible for protecting these species face the challenge of determining the optimal allocation of limited funds and personnel among risk management and conservation priorities, in the absence of a good understanding of the relative importance of these stressors. We present an analytical framework that can serve as a technical basis for evaluating multiple risks to endangered species. Predictive and retrospective causal analysis applications are considered. The former address proposed projects where the potential exists for adverse interaction between the project and an endangered species. The latter involve existing projects or products for which a determination is being or has been made concerning the threats posed to an endangered species. The causal analysis method described herein is a well-established procedure that is widely used in other scientific fields and offers a practical and logical process through which threats to endangered species can be assessed and recovery actions prioritized.
1. INTRODUCTION
The Endangered Species Act (ESA; 16 U.S.C. §1531 et seq.) was enacted in 1973 to safeguard flora and fauna at risk of extinction in the United States. Currently about 575 animal and 750 plant species in the USA are on the endangered species list [1], and approximately 250 other candidate species have been proposed for listing. The ESA is a powerful act and can restrict or prevent existing or proposed projects and products if these are found to pose a threat to an endangered species. Recent examples include the siting of wind farms [2], and the risks of pesticides to red-legged frogs [3] and salmon [4]. Often, determinations of threats are based on a presumption of cooccurrence of the potential stressor and the species. While this is a precautionary view and appropriate in some cases, there can be situations where more rigorous analysis is appropriate. This is especially true where the project or product has an overall beneficial impact on the environment (e.g., wind energy turbines).
Section 4 of the ESA requires development and implementation of recovery plans to improve survival prospects for listed species. Management plans identify specific actions needed to minimize effects of threats. However, the amount of funding available is frequently insufficient for agencies to implement all desired management activities. For example, in Fiscal Year 2004, the 100 topfunded species received almost 90% of recovery funding under the ESA, while 38% of species each received less than $5000 [5]. Clearly, for many endangered species the level of funding is not commensurate with the scope of required management actions. Because most endangered species are challenged by multiple threats, and because federal funding is often likely to be insufficient to address all those threats, a key to successful recovery of a species will be to identify the primary cause(s) leading to its decline so management actions can be focused on those threats. Foremost, this entails conducting a root cause analysis that is effective at distinguishing among multiple stressors to identify the key drivers for reduced population size, such that their removal or mitigation might enable species recovery.
Formal causal analysis offers a well-established foundation that can identify causal relationships otherwise not apparent, differentiate among hypothesized causes, prevent lapses of logic, build a clear weight of evidence, and result in prioritized management actions [6]. Causal analysis approaches have been used for a range of applications in both human health risk assessment and environmental analyses [6,7]. A causal analysis approach is used by US Environmental Protection Agency (EPA) as a formal method for identifying causes of impairment in aquatic systems [8-10]. The general principles in this application are relevant to issues with endangered species, with the goal being to identify the factor or factors having the largest detrimental effect on attaining biological or management goals.
The methodology for conducting causal analysis involves three alternative methods: elimination of causes, diagnostic analysis (linking specific cause and effect) and a strength of evidence analysis [11,12]. In many situations involving endangered species, multiple stressors co-occur spatially and/or temporally, so identification of a single cause will often be unlikely. Further, because different stressors may produce the same effects on an endangered species (e.g., decreased survival, productivity, etc.), linking one cause to any specific effect can be difficult. Therefore a weight of evidence analysis may represent the best diagnostic approach. The relevant weight of evidence criteria are identified in Table 1. A scoring system can be employed as a quantitative way to rank and prioritize threats [11].
A general framework for applying the causal analysis approach is shown in Figure 1. A suitable approach for conducting causal analysis for endangered species is to treat this as a multiple-stressor matter, where the focus is on evaluating whether or not any one stressor is negligible in its own right, or whether its effects are additive with or dependent upon the predominant stressors on the population. Using a phased analysis allows the evaluation to begin as simply as possible while maintaining the level of complexity required. Detailed analysis phases are added as necessary to characterize risks at a level appropriate for management decisions [6]. A phased approach is commonly used in risk assessment as a method of balancing available resources against the desire to reduce uncertainty [6,13]. The phased stressor-based approach entails four steps (Table 2).
In this paper, we outline common multiple stressors that typically threaten or endanger sensitive species. We also consider analytical frameworks that have been or could be used to provide a sound technical basis for evaluating risks to endangered species. We examine two common situations. The first considers proposed projects where there is a potential for interaction between the project and an endangered species. Such predictive analyses involve making predictions about the future. The siting of wind farms in or near habitats used by endangered bats is an example of this type of assessment. The second situation involves existing projects or products for which a determination is being or has been made concerning the threats they pose to an endangered species. These assessments involve retrospective analyses as the project or product is already in place.
2. MULTIPLE STRESSORS
One major difficulty in evaluating the role of multiple stressors on an endangered species is that they do not act independently, but rather in concert, to produce observed effects. Multiple stressors can elicit the same adverse effect, such as decreased survival or fecundity, via similar pathways, so attribution to any individual effect becomes problematic. At other times stressors may act via indirect pathways, through effects on food supply, competitors, predators, or habitat characteristics. In such cases, identification of the ultimate cause can be challenging, especially if there is latency between the occurrence of the stressor and onset of effects, or if the effects are relatively subtle.
Most listed species are threatened or endangered as a result of the combined impact of multiple stressors. Habitat degradation is, by far, the greatest single threat to listed species, being a contributing factor for population declines in 85% of listed species [14,15]. The second greatest threat comes from non-native introduced species, which affects almost half of all listed species [14,15]. Other long-recognized factors include pollution and overexploitation [14,15].
Often, a species is listed primarily because of the suspected effects of one stressor, when subsequent research reveals that other stressors may also contribute to the decline. As a case in point, the California red-legged frog (Rana aurora draytonii, CRLF) is a federally endangered species that has been extirpated from 70% of its range in California. A number of factors imperil CRLF populations, but habitat loss, water diversion, and introduced species are recognized as important contributing causes [16]. Subsequent research reported a relationship between the amount of upwind agricultural activity in the California Central Valley and the percentage of extirpated historical CRLF breeding sites downwind in the Sierra Nevada Mountains [17-19], leading to concerns that wind-borne pesticide drift could be having deleterious effects on the species in parts of its range. Partially in response to these concerns, a lawsuit was filed in 2002 forcing the EPA to consult with FWS to ensure that pesticides under intended uses would not harm CRLFs. This resulted in a federal court stipulated injunction in 2006 [3] that imposed no-use buffer zones around CRLF upland and aquatic habitats for 66 pesticides until EPA com-
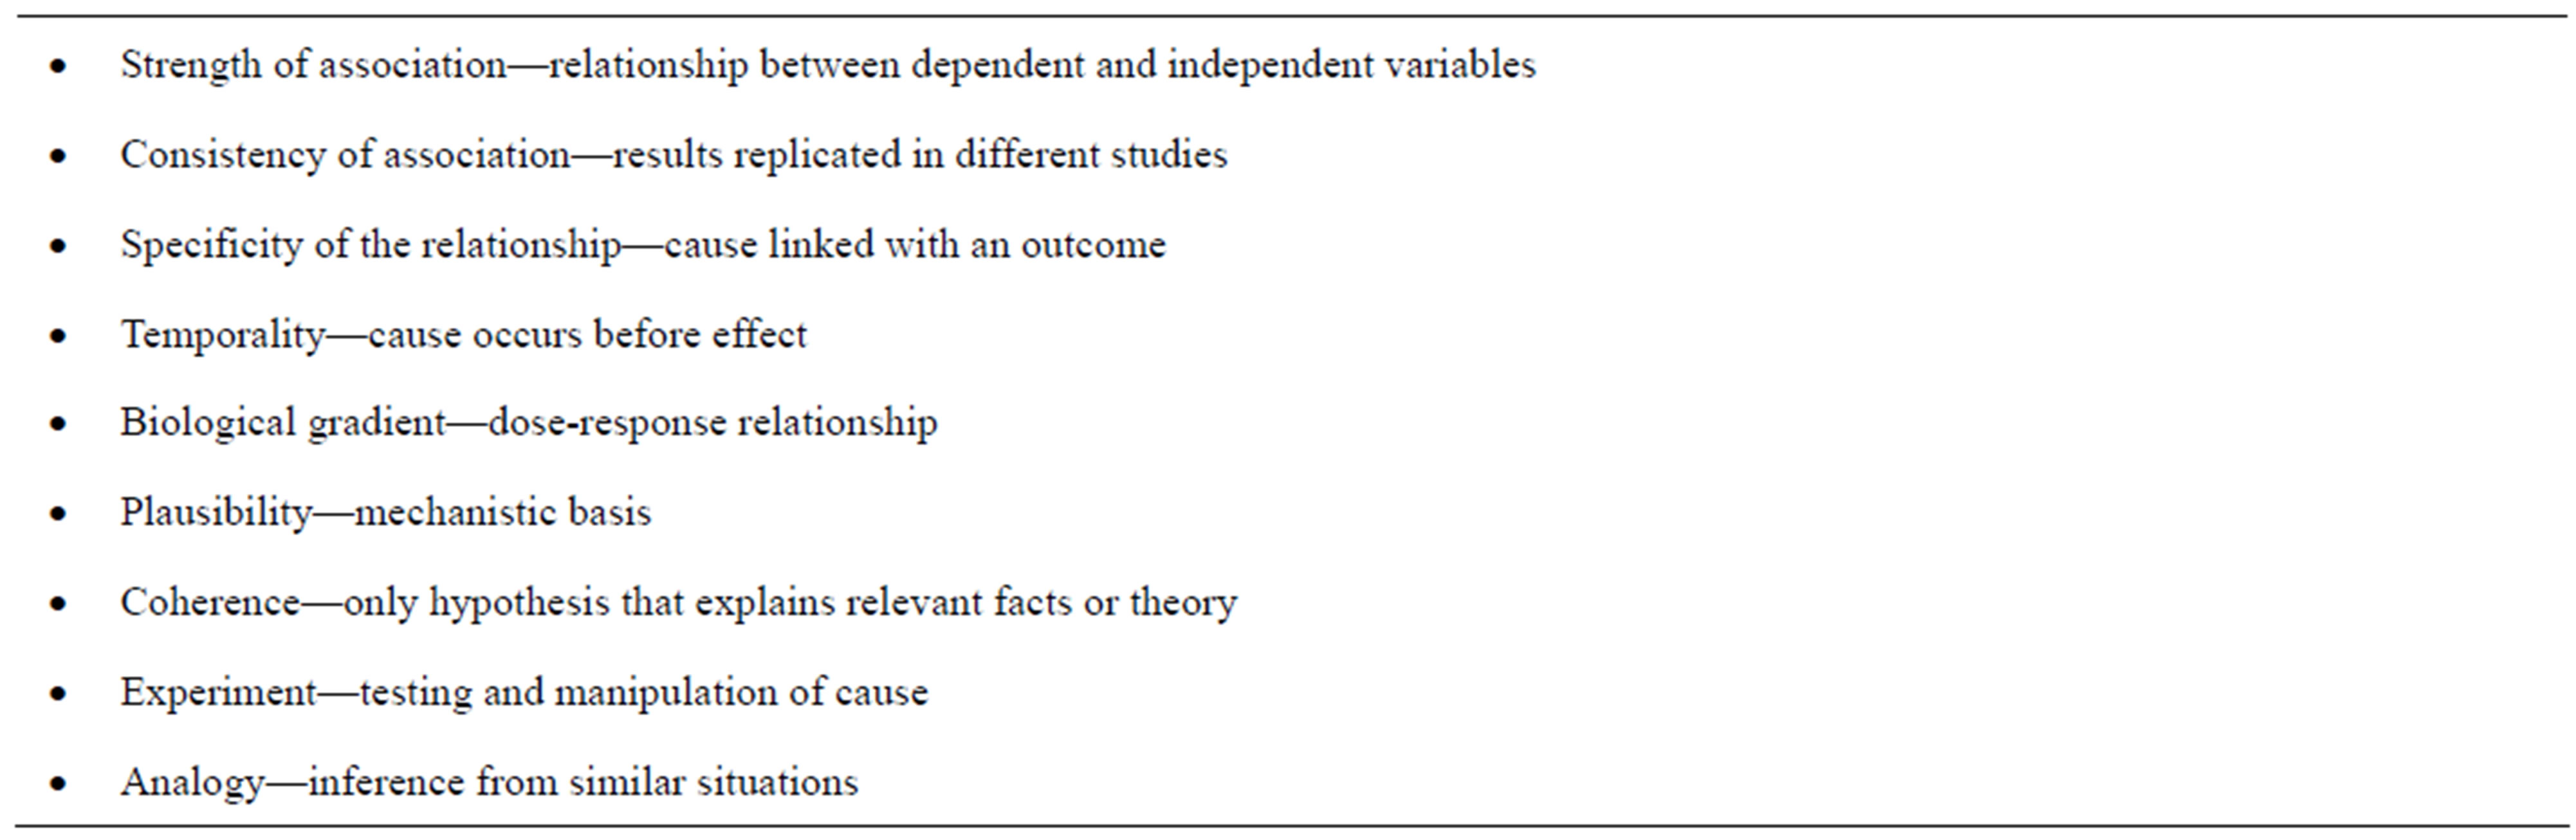
Table 1. Established causality based on strength of evidence.
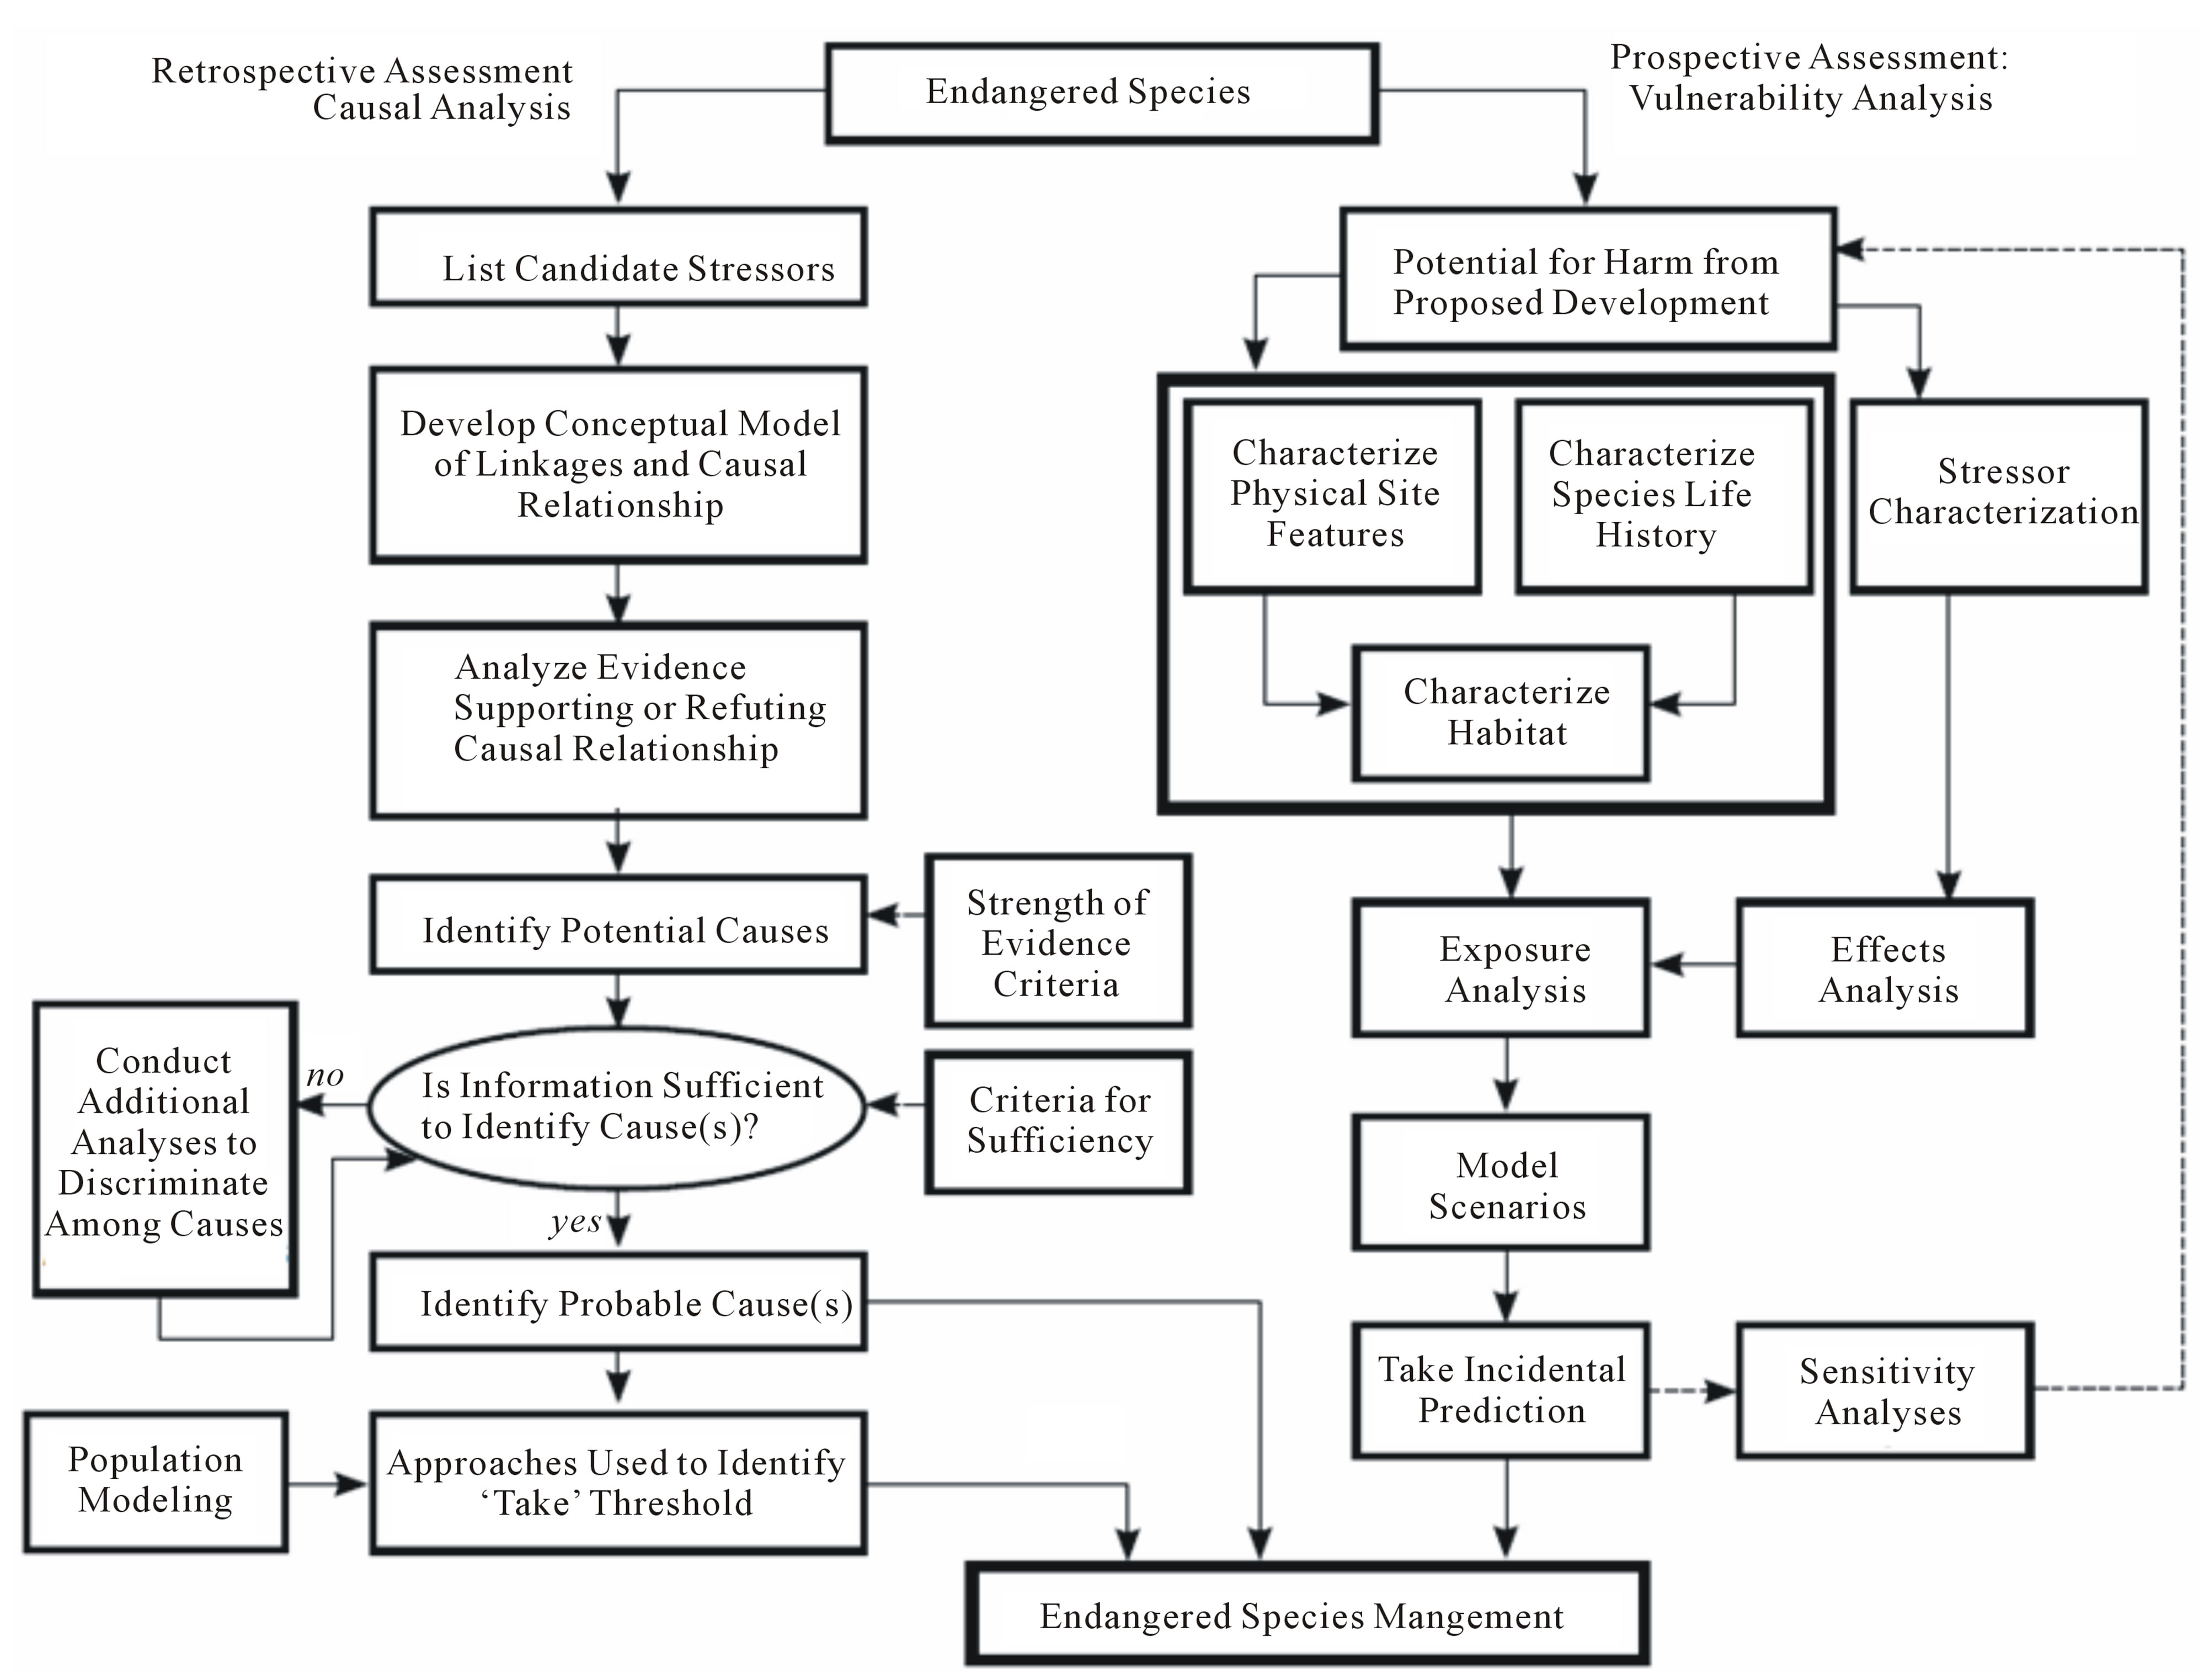
Figure 1. General framework for applying causal analysis and vulnerability analysis approaches to endangered species cases.
pletes formal Section 7 consultations with the US Fish and Wildlife Service (FWS), and the FWS issues a Biological Opinion for each pesticide based on the likelyhood of adverse effects to frogs. A similar legal challenge has been issued to the use of pesticides in salmons pawning habitats in the Pacific Northwest, necessitating the imposition of restricted buffer zones around spawning habitats until EPA completes consultations for 36 pesticide applications [4].
Within the last decade, climate change has also become widely recognized as a potential long-term threat to the survival of many species. Climate change differs
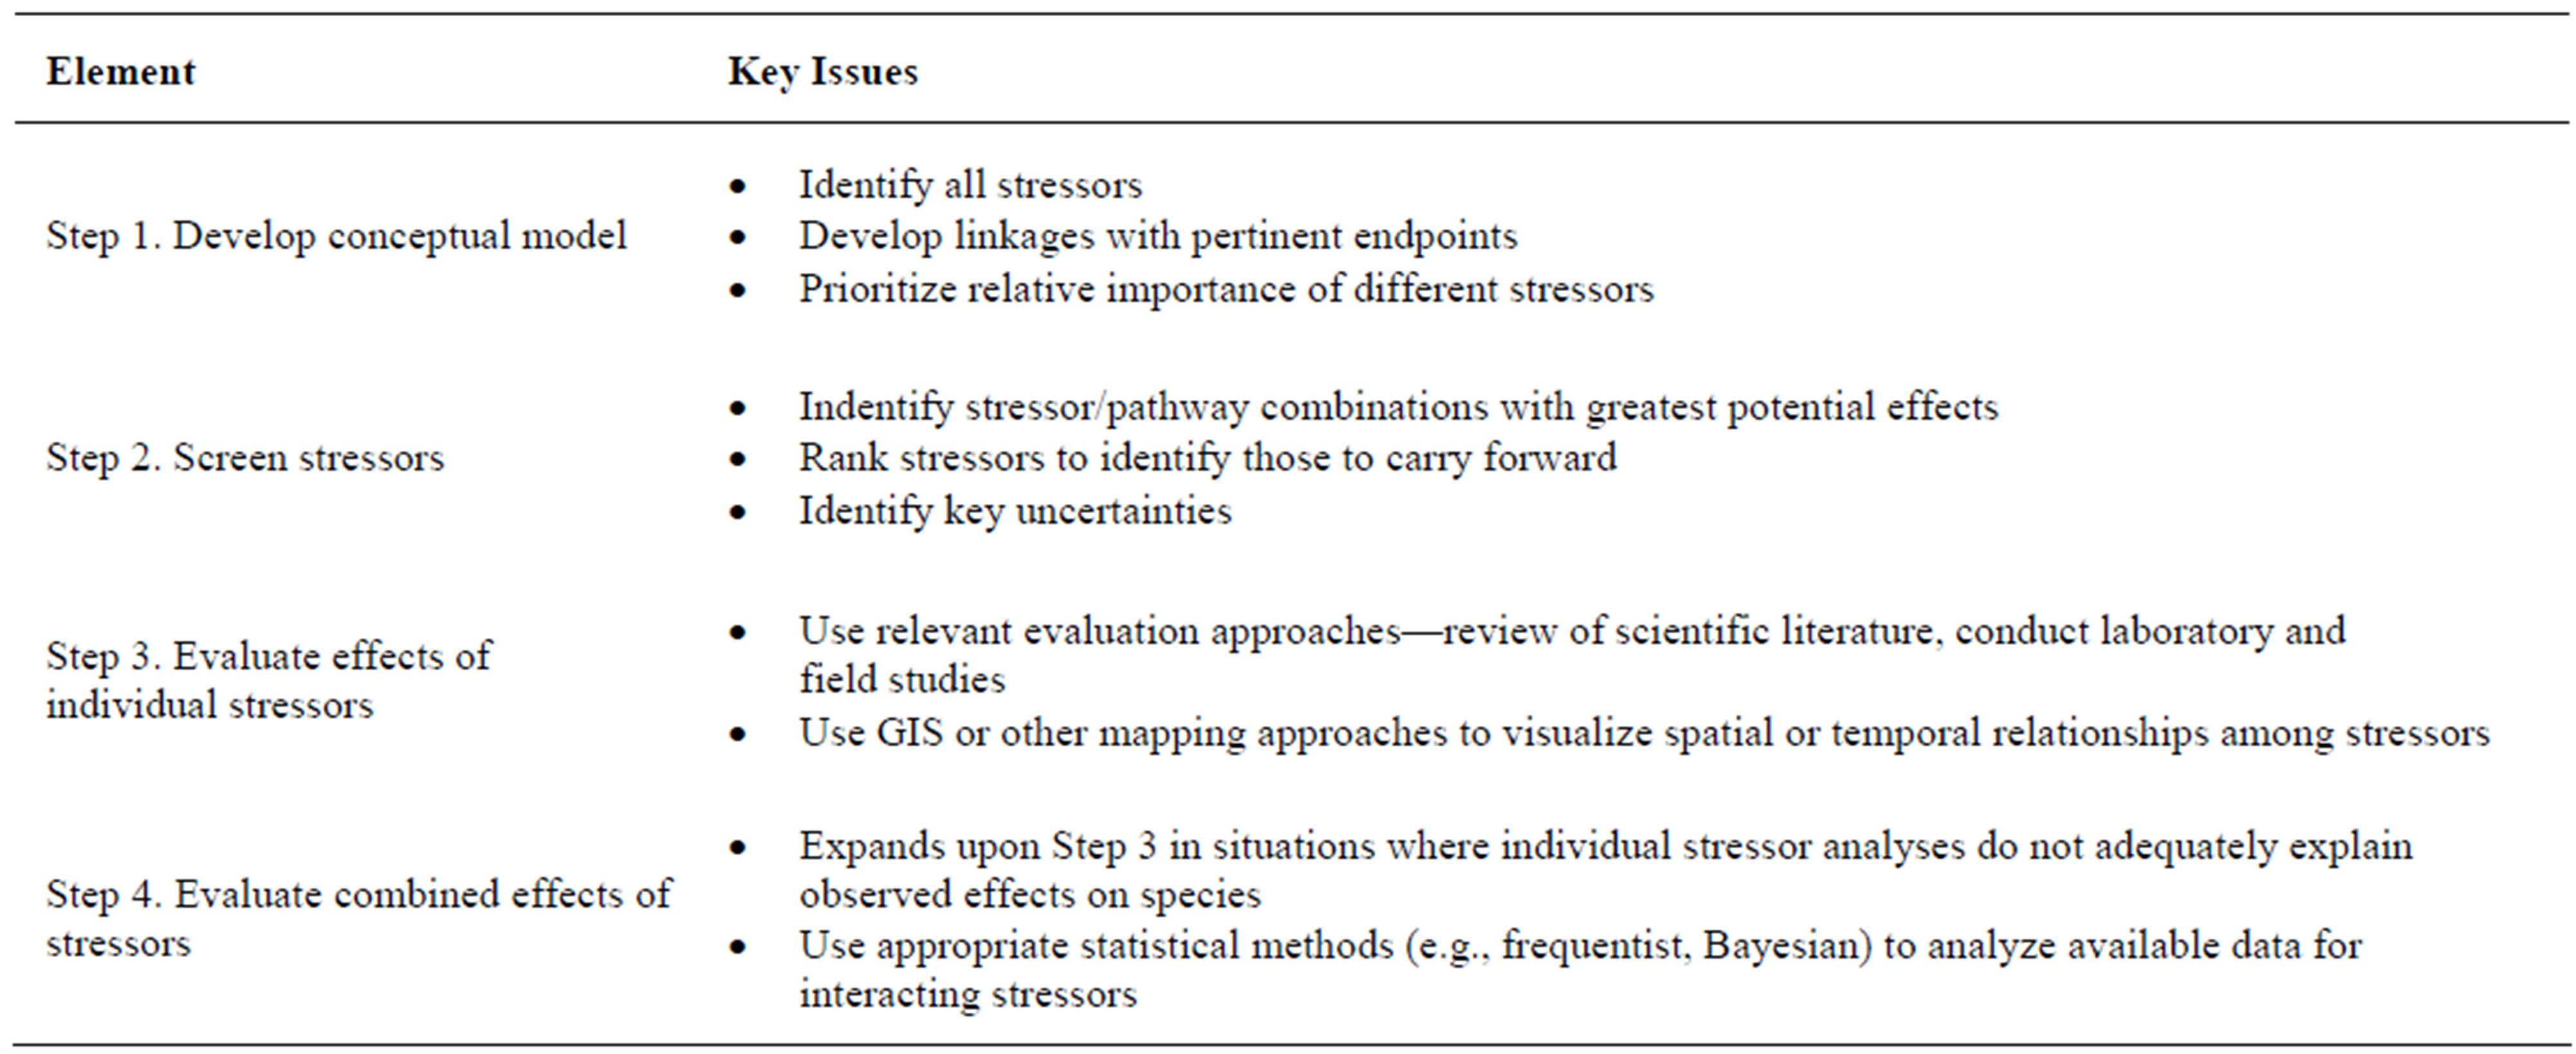
Table 2. Phased stressor analysis approach (modified from [6]).
in some respects from other stressors in that it is an emerging threat. In 2008 the polar bear (Ursus maritimus) was listed as threatened throughout its range because of threats to survival from loss of important sea ice habitat, resulting from rising temperatures. More recently, in 2010, the FWS declined to list the American pika (Ochotona princeps), a small mountain-dwelling mammal, as an endangered species, recognizing that although climate change would affect some populations, the species was unlikely to become endangered throughout its entire range, or a significant portion thereof, in the foreseeable future. These cases represent the forerunners of what are likely to be numerous petitions for listing species based on climatic effects, as information on future climate patterns and their impacts on species’ distributions and life histories continues to increase.
3. RETROSPECTIVE ANALYSES
To illustrate the value of causal analysis, we consider stressors affecting the CRLF. The impacts of some of the threats are well understood. Loss or modification of habitat is the primary factor affecting the species throughout its range in California [16]. Urbanization and agriculture have eliminated much of the historic habitat of the species and many of the remnant patches are limited in extent and fragmented, resulting in small populations and limited ability for dispersal among populations. Introduced species such as the bullfrog (Rana catesbeiana) have also had severe effects, either through direct predation or through eliciting delayed metamorphosis and behavioral changes that force the red-legged frog from preferred breeding and foraging habitats [20-22]. Many sites in the Sierra Nevada mountain range are currently unsuitable for frogs because of the presence of non-native species [16]. Other threats are more difficult to assess, as their impacts are less well understood, such as fungal disease, or yet to be fully manifested, as in the case of potential long-term changes in abundance and distribution brought on by climate change.
When pesticides are considered as additional stressors on the CRLF, it is important to determine if these chemicals might be “the straw that breaks the camel’s back,” that is, whether they contribute to pushing the frog toward extinction because of the cumulative effect of chemicals plus all the other stressors. While co-occurrence (e.g., pesticides and frogs) is an aspect of judging causality, it is by itself an insufficient basis for reaching a technically sound conclusion concerning risks from pesticides. A simplified conceptual model depicting important stressors acting on CRLF throughout their range is shown in Figure 2. Screening and prioritization of stressors might reduce the complete stressor list to a more manageable number for a focused evaluation. GIS or other spatially-based habitat assessment approaches can be useful at this stage to visualize and prioritize stressor impacts. We examine one stressor, pesticides, as an example of this approach.
The possibility that pesticides are a contributor to the lower population abundance of the CRLF and related ranid frog species is based largely on a spatial analysis of species distribution patterns in relation to a set of stressors including climate change, increased ultraviolet (UVB) radiation, habitat loss, and pesticide use [17-19]. The predominant patterns of lower abundances were considered consistent with the local extent of urbanization and amount of upwind agricultural land use. Because of this spatial pattern, researchers concluded that wind-borne agricultural pesticides are an important factor for decreasing frog populations downwind from the heavily cultivated Central Valley. The magnitude of the relation-
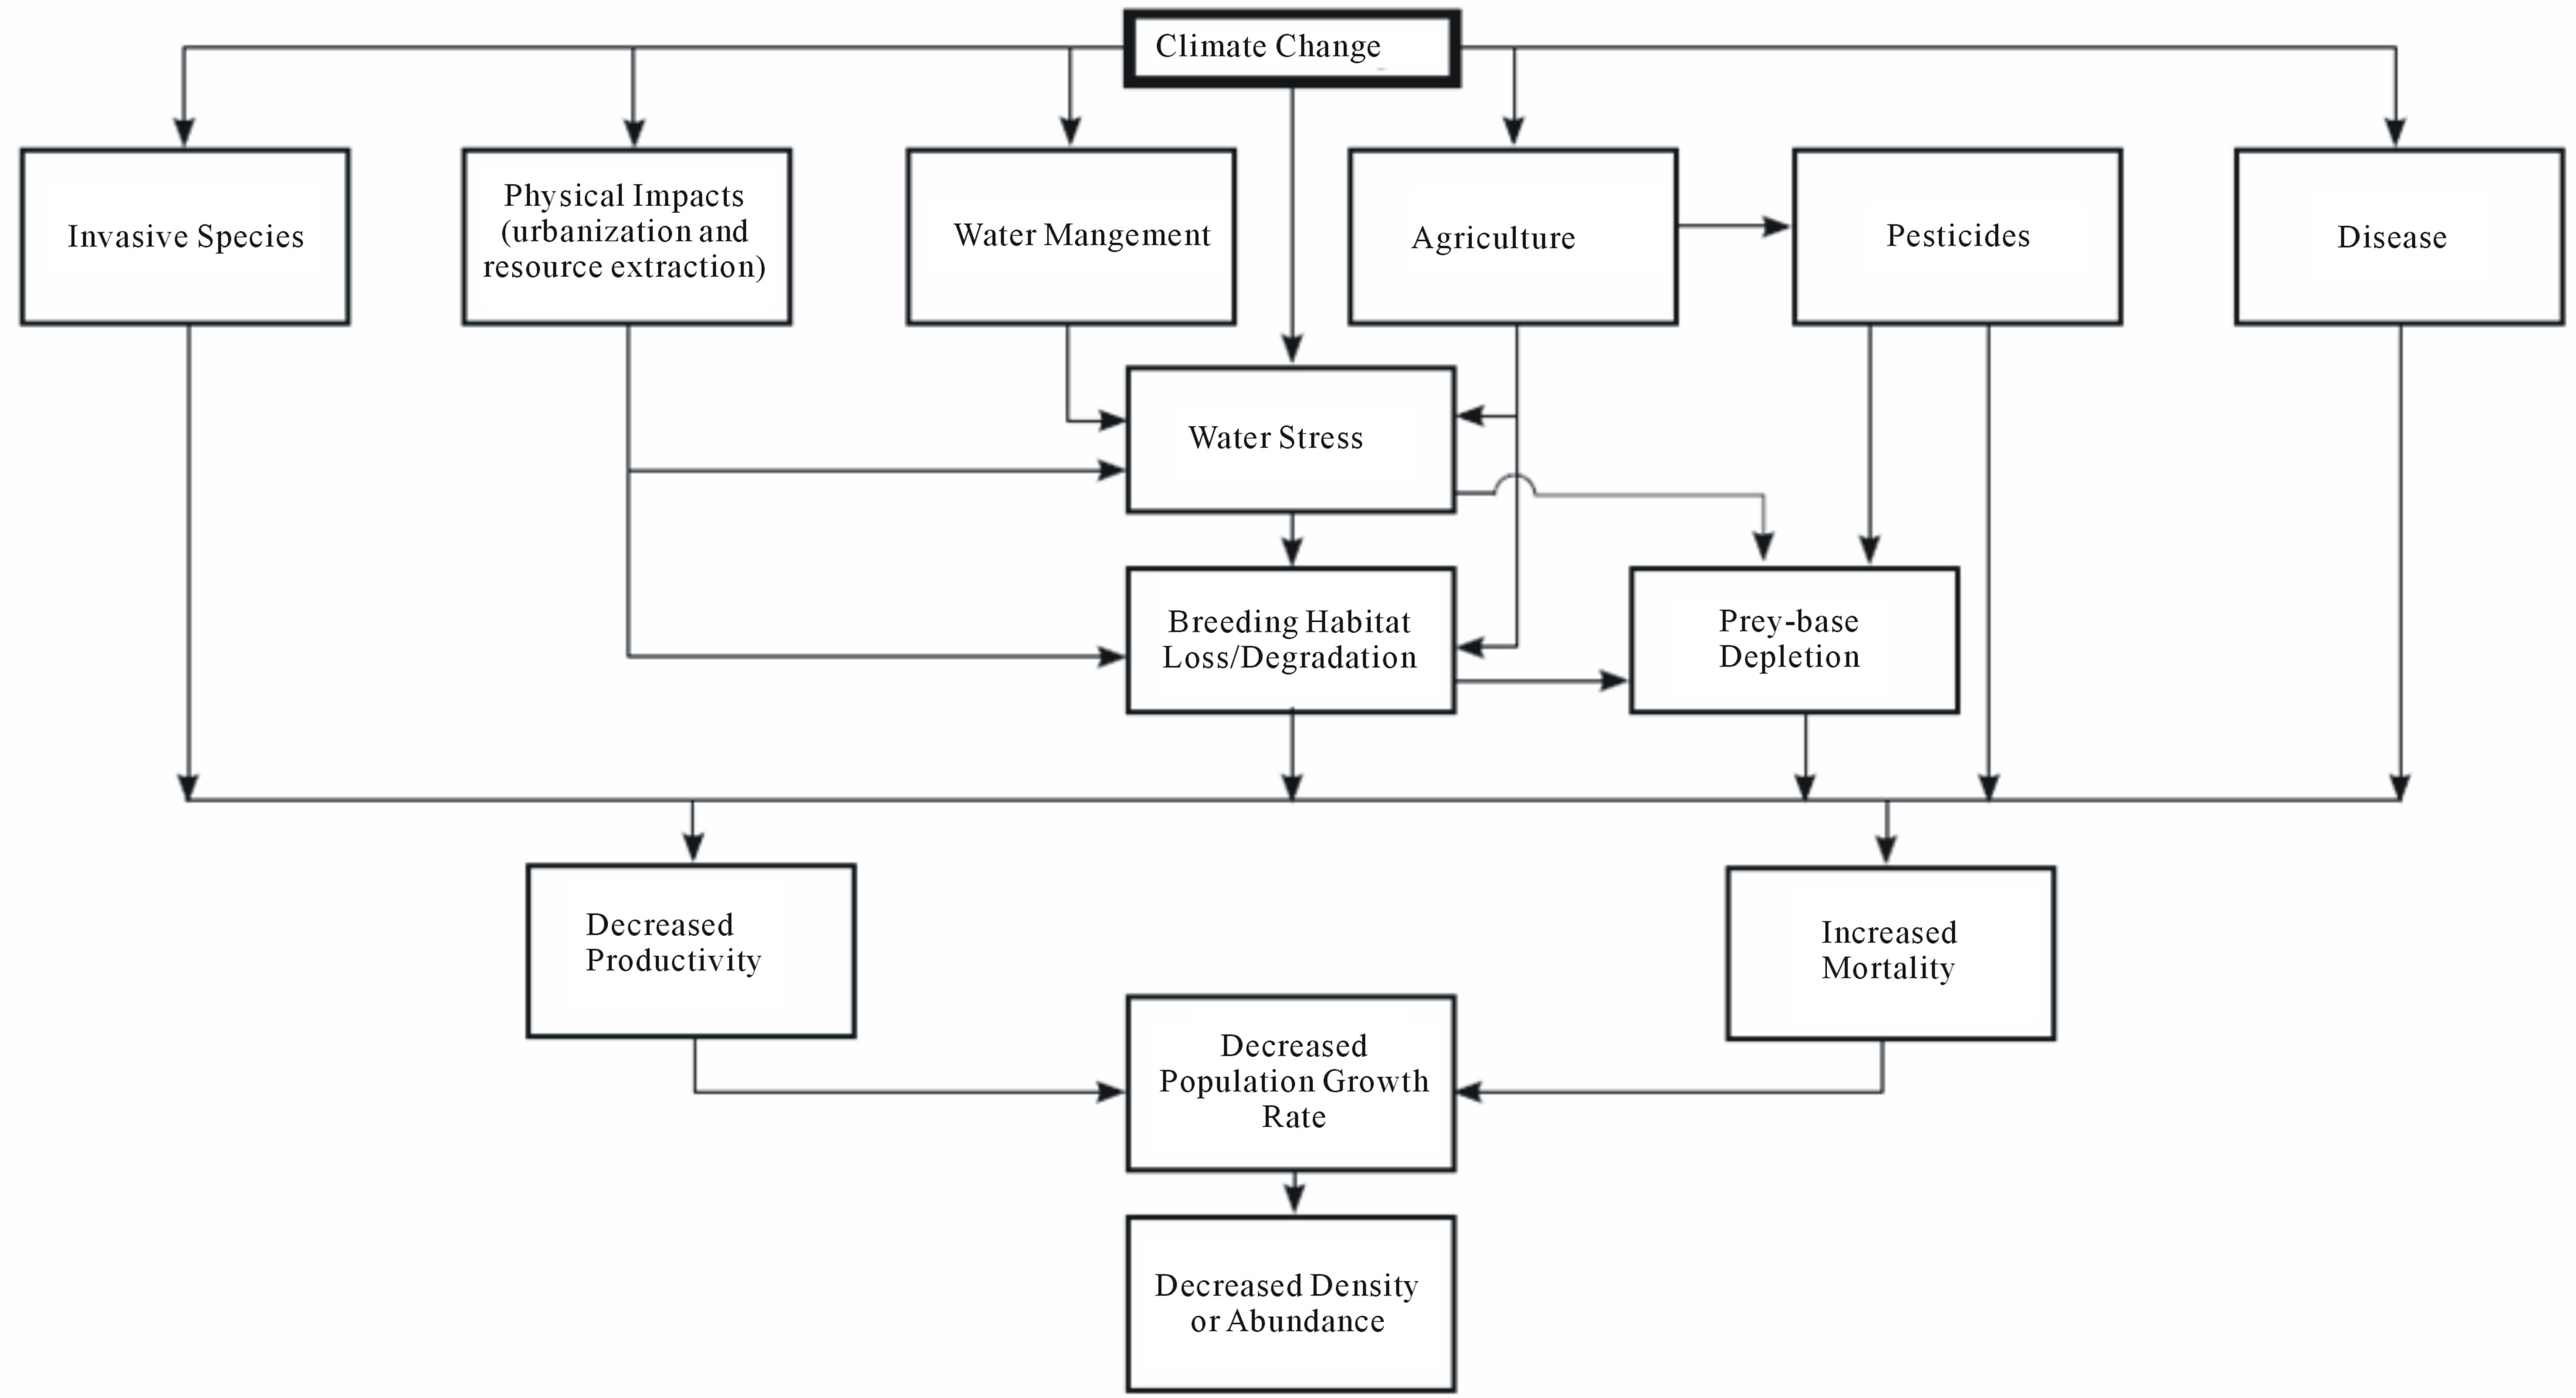
Figure 2. Simplified conceptual model depicting important stressors acting on the California Red-Legged Frog (Rana aurora draytonii) throughout its range.
ships varies among frog species [17-19].
While the study for the CRLF examined a number of stressors, it is not a full causal analysis and does not include all potential factors affecting frog populations, such as introduced predators. Additionally, the causal relationship is inferred only from a proxy measure of pesticide use (extent of upwind agricultural land) and frog populations in adjacent areas. The extent of agricultural land is a relatively crude measure of pesticide use, as it does not take into account factors such as specific crop use or microenvironments that affect wind speed and direction. A more formal causal analysis would provide a framework for identifying information that could strengthen the assessment and reduce the inherent uncertainty. Such an analysis would enable firmer judgment on the relative contributions of factors influencing frog populations.
A number of other studies also provide useful data that can be incorporated into a formal causal analysis of pesticide effects on CRLFs and related species downwind of agricultural areas in California. Several studies have reported the presence of commonly-applied organophosphate (OP) pesticides in air, snow, and surface water samples from the Sierra Nevada Mountains [23,24], with concentrations at times approaching within an order of magnitude of lethal concentrations for aquatic organisms. Cholinesterase (ChE) activity, a marker of exposure to OP and carbamates pesticides, was depressed in Pacific treefrog tadpoles (Pseudacris regilla) (used as a surrogate for endangered species) in mountainous areas downwind of the Central Valley compared to coastal and northern California sites [25]. Furthermore, within the Sierra Nevada Mountains, ChE in treefrogs was more depressed at sites with moderate or poor ranid populations compared with sites considered to still have good populations. The foothill yellow-legged frog (Rana boylii) was found to be more sensitive than the Pacific treefrog to the OP pesticide chlorpyrifos and the organochlorine endosulfan [26], so there is some evidence that ranid frogs may exhibit greater sensitivity to common pesticides than other amphibian species.
Together, these findings provide a starting basis for assessing some of the criteria for determining causality [27]. There is some evidence of exposure of frogs to pesticides in the Sierra Nevada mountain range and a plausible biological mechanism to show how exposure could lead to mortality or other adverse effects to frogs. There is an indication CRLF population declines appear to be greater in areas downwind of pesticide use than elsewhere in California, suggesting spatial co-occurrence. However, there does not appear to be a spatial gradient for pesticide concentrations in sediment or tadpoles within the Sierra Nevada mountain range with increasing distance from the Central Valley [28]. Temporal cooccurrence is less certain, as population declines may have been occurring prior to pesticide use. There is also no strong evidence for a biological gradient (i.e., a doseresponse demonstration of increasing exposure causing a greater intensity of effects). Coherence is also lacking, as there is strong evidence that other stressors are important drivers of population decline even if pesticides are not present.
As discussed above, a number of studies suggest a plausible role of pesticides as an important stressor. However, as we note, this relationship is largely correlative and contrary information can also be identified. One line of evidence in a formal causal analysis is consistency of association. Because the implication of the role of pesticides in population declines relied primarily on geographic relationships between the stressor and presumed effects, the same analytical approach could have been employed for other stressors. Ranid frog species have undergone population declines elsewhere where pesticides may be a less important stressor. For example, all seven species of ranid frogs native to Arizona have declined throughout their range [29]. Analyses found that factors influencing rarity included climate change, fungal infection, and introduced species. Data were insufficient to adequately evaluate pollution, but the other stressors are all known to be important in the Sierra Nevada region of California, and studies such as this would have relevance in any causal analysis evaluating pesticide effects.
A formal causal analysis would provide the needed framework for assessing the various stressors, highlighting the types of information to discriminate among them, identifying data gaps or uncertainties, and pointing to studies needed to collect data necessary to refine management decisions. It has been theorized that pesticides alone are unlikely to be causing population declines seen in ranid frogs in California, because the pesticides occur in low levels in frogs and are typically at concentrations below effect levels in environmental samples. Thus, an interactive effect may be occurring with another stressor such as fungal infection [30]. This hypothesis is amenable to analysis and could serve to identify the required research, including focused laboratory and field studies, to support or refute the inferred correlations. Evaluation methods could include meta-analysis, as has been used to assess the effects of UV-B on ranid frogs and its interactions with other stressors including pH, contaminants, and disease [31]. Another promising approach is epidemiological analysis, as was employed to evaluate factors associated with ranid frog declines in Arizona [29]. Other evaluation techniques that could be used include matrix approaches, influence diagrams, and Bayesian networks [6-8].
4. PREDICTIVE ASSESSMENT
Any proposed action that may adversely affect an endangered species needs to be examined with respect to the possibility of an interaction (a taking) and, if such interactions are possible, whether the taking would appreciably reduce the likelihood of the survival and recovery of the species in the wild. Past examples include impacts of logging of old growth timber in Northwest forests on the northern spotted owl (Strix occidentalis caurina) and marbled murrelet (Brachyramphus marmoratus) [32], or effects of road building in Ohio on the endangered Indiana bat (Myotis sodalist) [33].
Recent attention has been given to potential conflicts between “clean” energy sources (wind farms and solar collectors) and endangered species that inhabit some of the areas where these projects are being proposed. Such a conflict was identified in 2009 when the court halted the construction of a wind farm in the Appalachian Mountains in West Virginia [2] based on the possibility that the turbines would harm the endangered Indiana bat (Myotis sodalis). Turbines already in place were restricted to operation in winter months when bats are hibernating, and erection of additional turbines was prohibited. A key issue in the ruling was that the project developer had failed to conduct a rigorous assessment of effects of the turbines on bats, and failed to apply for an incidental take permit as required under Section 10 of the ESA. Although generalizations should not be drawn from one specific case, this situation raises the interesting dilemma of balancing policies encouraging the development of renewable energy resources, which may benefit numerous species and ecosystems through mitigation of climatic effects, with mandates to protect other species under the ESA. The same issue is emerging with solar power projects in the southwestern US desert, where environmental groups have expressed concern over possible effects to endangered species such as the desert tortoise (Gopherus agassizii). These types of issues are likely to become more common as other alternative energy sources, such as geothermal and tidal power, are evaluated for feasibility.
These cases are amenable to more rigorous analysis that can help quantify the likelihood and magnitude of potential takings. Because the species and the proposed project occupy and “utilize” parts of the landscape, spatially-explicit landscape-based approaches can be effective at quantifying the likelihood and magnitude of impacts on individual animals (a taking) and on the viability of the population. Spatially-explicit exposure assessment improves the realism of ecological risk assessment and the value of results for complex risk-management decision-making. For this reason, it addresses the types of uncertainties that can arise when assessments are based largely on professional judgment in the absence of a quantitative spatially-explicit framework. When quantitative methods are not employed, uncertainties associated with professional judgments can lead to regulatory decisions that are largely precautionary in nature.
The Department of Energy (DOE) and the authors of this paper are currently developing a spatially-explicit model for assessing the impacts of wind farms on endangered bats; the model could also be applied to endangered birds. The model is an adaptation of a spatially-explicit wildlife exposure model designed to evaluate risks to local populations [34-38]. The general framework for conducting this prospective evaluation is outlined on the right side of Figure 1.
Siting wind turbines in a manner that minimizes risks to endangered species provides a useful example of predictive risk assessment. The endangered Indiana bat lives in regions where wind energy development is occurring. Potential harm to the bat can occur from direct collisions or barotrauma (pressure-related impacts) of individuals in close proximity to the blades of the turbines. The probability that this will occur can be evaluated by integrating spatially-explicit information on landscape/ habitat characteristics, bat flight patterns, foraging behaviors/life stage sensitivities, bat population spatial distribution (horizontally and vertically), and the locations of turbines. The first portion of the assessment quantifies the likelihood of colocation of the bats and the turbines. A second module then considers whether an adverse interaction would occur and the degree of that interaction.
The spatially-explicit model being developed by the authors of this paper for DOE will track potential exposures of individual bats in a local population. Each individual is tracked over an ecologically relevant period of time as it travels across a landscape according to a set of pre-determined behavioral rules specific to the biology and foraging preferences of the Indiana bat and the quality of the habitat in the area of concern. Time periods are represented by periods of migration, roosting, and overwintering, which are considered over the lifetime of individual bats. Understanding spatial and temporal patterns of habitat use is necessary to accurately predict population effects. Inadequate documentation of Indiana bat habitat use patterns was an important factor in the court injunction halting development of the wind farm in West Virginia.
The spatially-explicit model incorporates the relevant landscape(s) features and associated habitats and topography for the species of concern not only within the wind turbine site, but across the much larger areas used by bat species. The physical and biological features of the landscape define areas where bats might live, migrate to and from, hibernate, and forage. The population of bats is distributed within this landscape according to existing knowledge about actual use or about favored habitat features. The individual animals are mobile and may follow a unique flight pathway across the landscape. Predictive risk assessment using spatially-explicit models for example, offers developers and regulators forecasting capabilities and the flexibility to explore the influences of alternative designs. In the case of the model being developed for the bat, the additional taking on the local population is assessed by examining the probability of excess collision mortality in relation to the total natural mortality. The probability of an incremental increase in mortality can also be used as an input variable to a population viability model to predict changes in population growth rate of the bat under different wind turbine configurations.
The ultimate goal of predictive risk assessment is to understand the potential effect of changes in mortality or other population-level metrics (birth rate, growth rate) on the persistence of the endangered species. As these assessments incorporate increased ecological realism and scenario-based risk forecasting, they yield information that can be used to refine and support incidental take permits and associated conservation plans. Predictive risk assessments can guide decisions on how to proceed with important projects while minimizing real threats to endangered species.
5. CONCLUSIONS
The endangered species examples cited here are not unique. The issue of multiple, co-occurring stressors as described for the CRLF is common to most threatened and endangered species. Quantifying the contribution of a stressor to the “take” of a species provides support for management decisions. For example, incidental taking resulting from water management activities in the Missouri River system of the Great Plains was evaluated for the threatened piping plover (Charadrius melodus). A stochastic population model was used to determine the population decline (7.8% per year) associated with flooding of nests resulting from river water-level management [39]. However, even without incidental take of piping plover caused by flooding, the model still estimated an annual decline of 7.5%. So, while there is some adverse effect from flooding, model results suggest that other factors have a more important influence on long-term persistence of piping plover populations. A similar approach could be employed for the CRLF, for which the incidental take resulting from pesticide applications could be evaluated in conjunction with effects of other stressors. If there were only a minor change in population growth rate with the exclusion of pesticide effects, then management activities should be directed toward other causal factors.
Future impacts on endangered species from infrastructure projects, resource extraction, or deployment of new technologies will become more commonplace as competing human and wildlife requirements for dwindling habitat or resources increase. As shown by the Indiana bat case, inadequate evaluation of potential impacts during the project planning stage can result in negative outcomes for both project developers and endangered species. The spatially explicit predictive risk assessment tool, integrated into a causal analysis of multiple stressors and coupled to an appropriate population viability model, offers an example of a quantitative approach that can be used to predict impacts and serve as an adaptive management tool to minimize effects to endangered species while optimizing the social and economic benefits of a project.
The causal analysis method described herein is a wellestablished procedure that is widely used in other scientific fields and offers a practical and logical process through which threats to endangered species can be assessed. Application of the method allows managers to prioritize recovery actions that address primary threats while minimizing expenditure of resources on stressors that are of secondary or minor importance.
REFERENCES
- US Fish and Wildlife Species Reports (2013) Summary of listed species listed populations and recovery plans. Environmental conservation online system. http://ecos.fws.gov/tess_public/pub/Boxscore.do
- Animal Welfare Institute v. Beech Ridge Energy LLC (2009) No. RWT 09cv1519.
- Center for Biological Diversity v. EPA. (2006) No. 02- 1580-JSW (JL).
- Washington Toxics Coalition v. EPA. (2005) No. 413 F.3d 1024.
- Schwarz, MW. (2008) The performance of the Endangered species act. Annual Review of Ecology, Evolution and Systematics, 39, 279-299. doi:10.1146/annurev.ecolsys.39.110707.173538
- Menzie, C.A., MacDonell, M.M. and Mumtaz, M. (2007) A phased approach for assessing combined effects from multiple stressors. Environmental Health Perspectives, 115, 807-816. doi:10.1289/ehp.9331
- Linder, S.H., Delclos, G. and Sexton, K. (2010) Making causal claims about environmentally induced adverse effects. Human and Ecological Risk Assessment, 16, 35-52. doi:10.1080/10807030903459288
- Menzie, C.A., MacDonell, M.M. and Mumtaz, M. (1997) A phased approach for assessing combined effects from multiple stressors. Environmental Health Perspectives, 115, 807-816. doi:10.1289/ehp.9331
- US Environmental Protection Agency (2000) Stressor identification guidance document. US Environmental Protection Agency, Office of Water and Office of Research and Development, Washington DC, EPA-822-B- 00-025.
- Cormier, S.M., Suter II, G.W. and Norton, S.B. (2010) Causal characteristics for ecoepidemiology. Human and Ecological Risk Assessment, 16, 53-73. doi:10.1080/10807030903459320
- Suter II, G.W., Norton, S.B. and Cormier, S.M. (2002) A methodology for inferring the causes of observed impairments in aquatic ecosystems. Environmental Toxicology and Chemistry, 21, 1101-1111. doi:10.1002/etc.5620210602
- Suter II, G.W., Norton, S.B. and Cormier, S.M. (2010) The science and philosophy of a method for assessing environmental causes. Human and Ecological Risk Assessment, 16, 19-34. doi:10.1080/10807030903459254
- US Environmental Protection Agency (1998) Guidelines for ecological risk assessment. US Environmental Protection Agency, Risk Assessment Forum, Washington DC, EPA-630-R095-002F.
- Wilcove, D.S., Rothstein, D., Dubow, J., Philips, A. and Losos, E. (1998) Quantifying threats to imperiled species in the United States. BioScience, 48, 607-615. doi:10.2307/1313420
- Lawler, J.J., Campbell, S.P., Guerry, A.D., Kolozsvary, M.B., O’Connor, R.J. and Seward, L.C.N. (2002) The scope and treatment of threats in endangered species recovery plans. Ecological Applications 12, 663-667. doi:10.1890/1051-0761(2002)012[0663:TSATOT]2.0.CO;2
- US Fish and Wildlife Service (2002) Recovery plan for the California Red-Legged Frog (Rana aurora draytonii). US Fish and Wildlife Service, Portland.
- Davidson, C., Shaffer, H.B. and Jennings, M.R. (2001) Declines of the California red-legged frog: Climate, UVB, habitat, and pesticide hypotheses. Ecological Applications, 11, 464-479. doi:10.1890/1051-0761(2001)011[0464:DOTCRL]2.0.CO;2
- Davidson, C., Shaffer, H.B. and Jennings, M.R. (2002) Spatial tests of the pesticide drift, habitat destruction, UVB, and climate-change hypotheses for California amphibian declines. Conservation Biology, 16, 1588-1601. doi:10.1046/j.1523-1739.2002.01030.x
- Davidson, C. (2004) Declining downwind: Amphibian population declines in California and historical pesticide use. Ecological Applications, 14, 1892-1902. doi:10.1890/03-5224
- Kiesecker, J.M. and Blaustein, A.R. (1998) Effects of introduced bullfrogs and smallmouth bass on microhabitat use, growth and survival of native red-legged frogs (Rana aurora). Conservation Biology, 12, 776-787. doi:10.1046/j.1523-1739.1998.97125.x
- Lawler, S.P., Dritz, D., Strange, T. and Holyoak, M. (1999) Effects of introduced mosquitofish and bullfrogs on the threatened California red-legged frog. Conservation Biology, 13, 613-622. doi:10.1046/j.1523-1739.1999.98075.x
- Doubledee, R.A., Muller, E.B. and Nisbet, R.M. (2003) Bullfrogs, disturbance regimes, and the persistence of California red-legged frogs. Journal of Wildlife Management, 67, 424-438. doi:10.2307/3802783
- McConnell, L.L., LeNoir, J.S., Datta, S. and Seiber, J.N. (1998) Wet deposition of current-use pesticides in the Sierra Nevada mountain range, California, USA. Environmental Toxicology and Chemistry, 17, 1980-1916. doi:10.1002/etc.5620171003
- LeNoir, J.S., McConnell, L.L., Fellers, G.M. and Cahill, T.M. (1999) Summertime transport of current use pesticides from California’s Central Valley to the Sierra Nevada mountain range. Environmental Toxicology and Chemistry, 18, 2715-2722. doi:10.1002/etc.5620181210
- Sparling, D.W., Fellers, G.M. and McConnell, L.L. (2001) Pesticides and amphibian population declines in California, USA. Environmental Toxicology and Chemistry, 20, 1591-1595. doi:10.1002/etc.5620200725
- Sparling, D.W. and Fellers, G.M. (2009) Toxicity of two insecticides to California, USA, anurans and its relevance to declining amphibian populations. Environmental Toxicology and Chemistry, 28, 1696-1703. doi:10.1897/08-336.1
- Hill, B.A. (1965) The environment and disease: Association or causation? Proceedings of the Royal Society of Medicine, 58, 295-300.
- Bradford, D.F., Stanley, K., McConnell, L.L., TallentHalsell, N.G., Nash, M.S. and Simonich, S.M. (2010) Spatial patterns of atmospherically deposited organic contaminants at high elevation in the southern Sierra Nevada Mountains, California, USA. Environmental Toxicology and Chemistry, 29, 1056-1066.
- Witte, C.L., Sredl, M.J., Kane, A.S. and Hungerford, LL. (2007) Epidemiologic analysis of factors associated with local disappearance of native ranid frogs in Arizona. Conservation Biology, 22, 375-383. doi:10.1111/j.1523-1739.2007.00878.x
- Davidson, C., Benard, M.F., Shafer, H.B., Parker, J.M., O’Leary, C., Conlon, J.M. and Rollins-Smith, L.A. (2007) Effects of chytrid and carbaryl exposure on survival, growth and skin peptide defenses in foothill yellowlegged frogs. Environmental Science and Technology, 41, 1771-1776. doi:10.1021/es0611947
- Bancroft, B.A., Baker, N.J. and Blaustein, A.R. (2008) A meta-analysis of the effects of ultraviolet B radiation and its synergistic interactions with pH, contaminants, and disease on amphibian survival. Conservation Biology, 22, 987-996. doi:10.1111/j.1523-1739.2008.00966.x
- USDI (2003) Biological Opinion and letter of concurrence for effects to bald eagles, marbled murrelets, northern spotted owls, bull trout, and designated critical habitat for marbled murrelets and northern spotted owls from Olympic National Forest program of activities for August 5, 2003, to December 31, 2008. USDI Fish and Wildlife Service, Lacey, Washington.
- US FWS (2007) Biological opinion on the Ohio Department of Transportation’s statewide transportation program for the federally-listed endangered Indiana bat (Myotis sodalis). US Fish and Wildlife Service, Ohio Ecological Services Field Office, Reynoldsburg.
- Wickwire, W.T., Menzie, C.A., Burmistrov, D. and Hope, B.K. (2004) Incorporating spatial data into ecological risk assessments: The spatially explicit exposure model (SEEM) for ARAMS. In: Kapustka, L.A., Galbraith, H., Luxon, M. and Biddinger, G.R., Eds., Landscape Ecology and Wildlife Habitat Evaluation: Critical Information for Ecological Risk Assessment, Land-Use Management Activities, and Biodiversity Enhancement Practices. ASTM International, West Conshohocken, 297. doi:10.1520/STP11955S
- Wickwire, W.T. and Menzie, C.A. (2003) New approaches in ecological risk assessment: Expanding scales, increaseing realism, and enhancing causal analysis. Human and Ecological Risk Assessment, 9, 1411-1414. doi:10.1080/10807030390250903
- Von Stackelberg, K., Wickwire, W.T. and Burmistrov, D. (2005) Spatially-explicit exposure modeling tools for use in human health and ecological risk assessment: SEEM and FISHRAND-Migration. In: Aral, M.M., Brebbia, C.A., Maslia, M.L. and Sinks, T., Eds., Environmental Exposure and Health. WIT Press, Southampton, 279.
- Freshman, J.S. and Menzie, C.A. (1996) Two wildlife exposure models to assess impacts at the individual and population levels and the efficacy of remedial actions. Human and Ecological Risk Assessment, 2, 481-496. doi:10.1080/10807039609383628
- Johnson, M.S., Wickwire, W.T., Quinn, M.J., Ziolkowski, D.J., Burmistrov, D., Menzie, C.A., Geraghty, C., Minnich, M. and Parsons, P.J. (2007) Are songbirds at risk from lead at small arms ranges? An application of the Spatially Explicit Exposure Model (SEEM). Environmental Toxicology and Chemistry, 26, 2215-2225. doi:10.1897/07-068R.1
- McGowan, C.P. and Ryan, M.R. (2009) A quantitative framework to evaluate incidental take and endangered species viability. Biological Conservation, 142, 3128- 3136. doi:10.1016/j.biocon.2009.08.012