Health
Vol.6 No.16(2014), Article
ID:49476,6
pages
DOI:10.4236/health.2014.616244
Correlation of Macular Thickness, Multifocal ERG with Visual Acuity in Oculocutaneous Albinism (OCA)
Jitendra Jethani1*, Monika Jethani2, Sugnesh Parmar1, Jayprakash Purohit1
1Dr. Thakorbhai V Patel Eye Institute, Vadodara, India
2Eye Q Hospitals, Vadodara, India
Email: *xethani@rediffmail.com
Copyright © 2014 by authors and Scientific Research Publishing Inc.
This work is licensed under the Creative Commons Attribution International License (CC BY).
http://creativecommons.org/licenses/by/4.0/


Received 25 June 2014; revised 14 August 2014; accepted 27 August 2014
ABSTRACT
Background and Aim: Ocular albinism is known to have nystagmus and foveal hypoplasia. A study was done to evaluate the correlation of visual acuity with macular thickness (MT) and mf ERG. Materials and Methods: A total of 20 eyes (10 patients) with OCA were selected. Macular thickness was evaluated with optical coherence tomography and mf ERG was done in all the patients. Results: Mean age was 16.1 ± 7.3 years. The patients were divided into three groups based on their visual acuity > 6/12 (group A), 6/18 - 6/24 (group B), 6/36 or less (group C). Mean MT in patients with visual acuity in group A, B and C was 194.8 ± 26.7, 220 ± 12.3 and 243.5 ± 17.3 microns respectively. The amplitudes of first positive wave (P1) and first negative wave (N1) for the central ring in mf ERG in patients of group A, B and C was 1.1 ± 0.5 (P1), 0.7 ± 0.2 (N1), 0.6 ± 0.5 (P1), 0.3 ± 0.2 (N1), 0.7 ± 0.2 (P1), 0.3 ± 0.1 (N1) microvolts respectively. The vision correlated well with the macular thickness. The mf ERG potentials (P1 and N1) do not correlate with the visual acuity. Conclusion: We believe that the visual acuity in albinotic patients is affected by the macular thickness but the electric potentials do not depend on the visual acuity.
Keywords:Multifocal Electroretinogram, Albinism, Ocular Coherence Tomography

1. Introduction
Ocular Albinism is a genetic disorder of production of pigment melanin. Visual abnormalities associated with ocular albinism include reduced visual acuity, nystagmus, and hypersensitivity to light (photophobia) [1] -[3] . The cause of poor vision may be foveal hypoplasia, nystagmus, photophobia and abnormal decussation of the nerve fibres at optic chiasm [1] -[3] . Flash Electroretinograms (ERG) are nearly normal in such patients except for a slightly larger a wave [4] [5] . Optic coherence tomography (OCT) shows thickened fovea and increased macular thickness. This has been graded by OCT by various authors [7] -[10] . Multifocal ERG shows retinal response at the focal level. Few reports have been suggestive of reduced function (amplitude) in the macular region in patients with ocular albinism [11] . There have been very few studies regarding the retinal function in ocular albinism. They have suggested that retinal function is normal, mildly subnormal or hypernormal (that is, better than normal) [1] . Foveal hypoplasia is characteristic of albinism generally. However, despite the hypoplastic foveal region, the status of macular cone function is largely unknown. The function of isolated hypoplastic fovea (also called fovea plana) has been evaluated by multifocal ERG (mfERG) and has been reported to be normal [12] . We did a study to evaluate the correlation of visual acuity with the thickening of fovea evaluated by OCT and function of thickened fovea evaluated with mf ERG.
2. Materials and Methods
A total of 10 patients were selected for the study with oculo cutaneous albinism. All the patients had features of ocular albinism viz. albinoid fundi tessellation, foveal hypoplasia, iris transillumination defects. All the patients underwent OCT (OCT stratus III, Zeiss Meditec, Dublin, CA, USA) (Figure 1(a) and Figure 1(b)). Foveal hypoplasia was evaluated using a fast macular cross-hair Stratus OCT scan with pupils dilated (Figure 2). To minimize test errors resulting from nystagmus or poor fixation, measurements by a skilled technician were replicated and only those images with good fixation and signal strength of more than 7 were selected. Multi-focal ERGs (Roland Consult, Germany) were recorded to map the topography of retinal function in the central retina (Figure 3). The stimulus array consisted of 103 hexagons that were modulated between black and white in a pseudo-random sequence called an m-sequence. The average amplitude of central ring (central 5˚) was taken into consideration and was matched with the outer rings. A paired t test was used for statistical analysis.
3. Results
A total of 10 patients (20 eyes) were included in the study. The mean age of the patients was 16.1 ± 7.3 years. The patients were divided into three groups based on their visual acuity into more than 6/12 (group A), between 6/18 - 6/24 (group B) and 6/36 or less (Group C). Mean macular thickness (MT) in group A (n = 6) as 194.8 ± 26.7 microns, group B (n = 10) was 220 ± 12.3 microns and group C (n = 4) was 243.5 ± 17.3 microns (Table 1).
 (a)
(a) (b)
(b)
Figure 1. (a) and (b) show the fundus photograph of albinoid patient with tessellation and foveal hypoplasia and absent annular reflex.
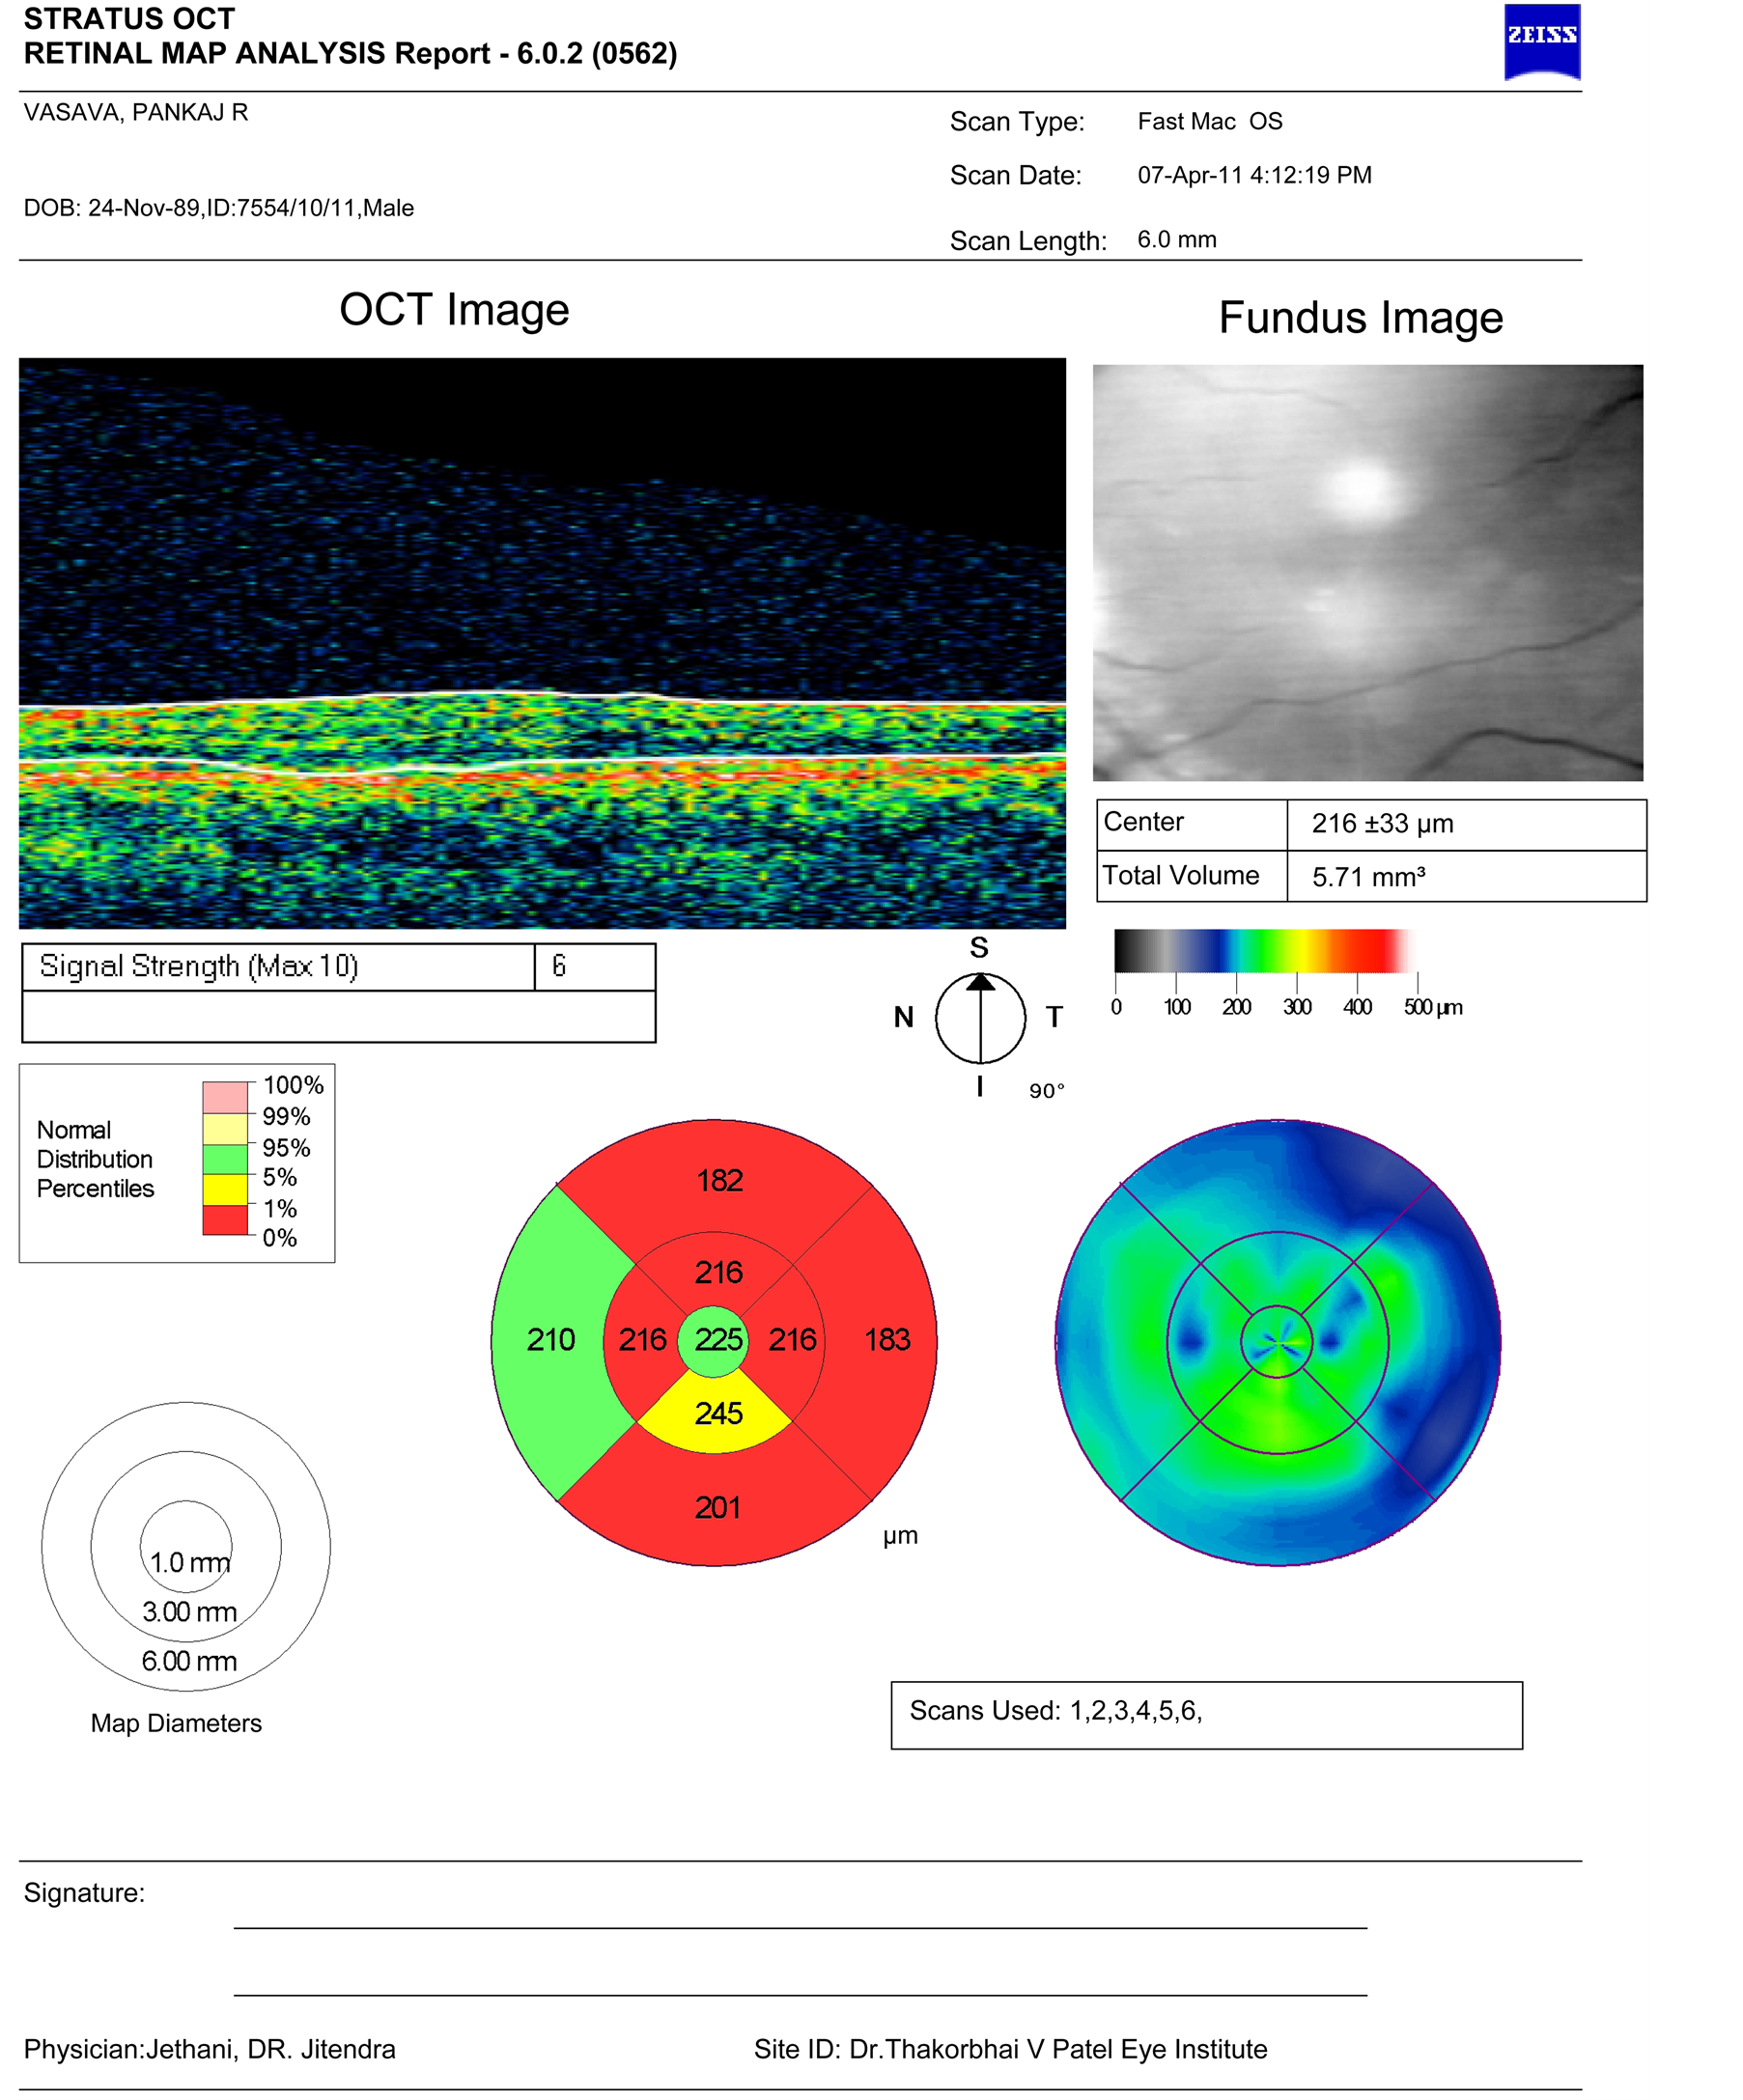
Figure 2. Shows OCT picture of one of the patients with foveal hypoplasia.

Table 1. Shows the socio demographic characteristics of the patients included in the study.
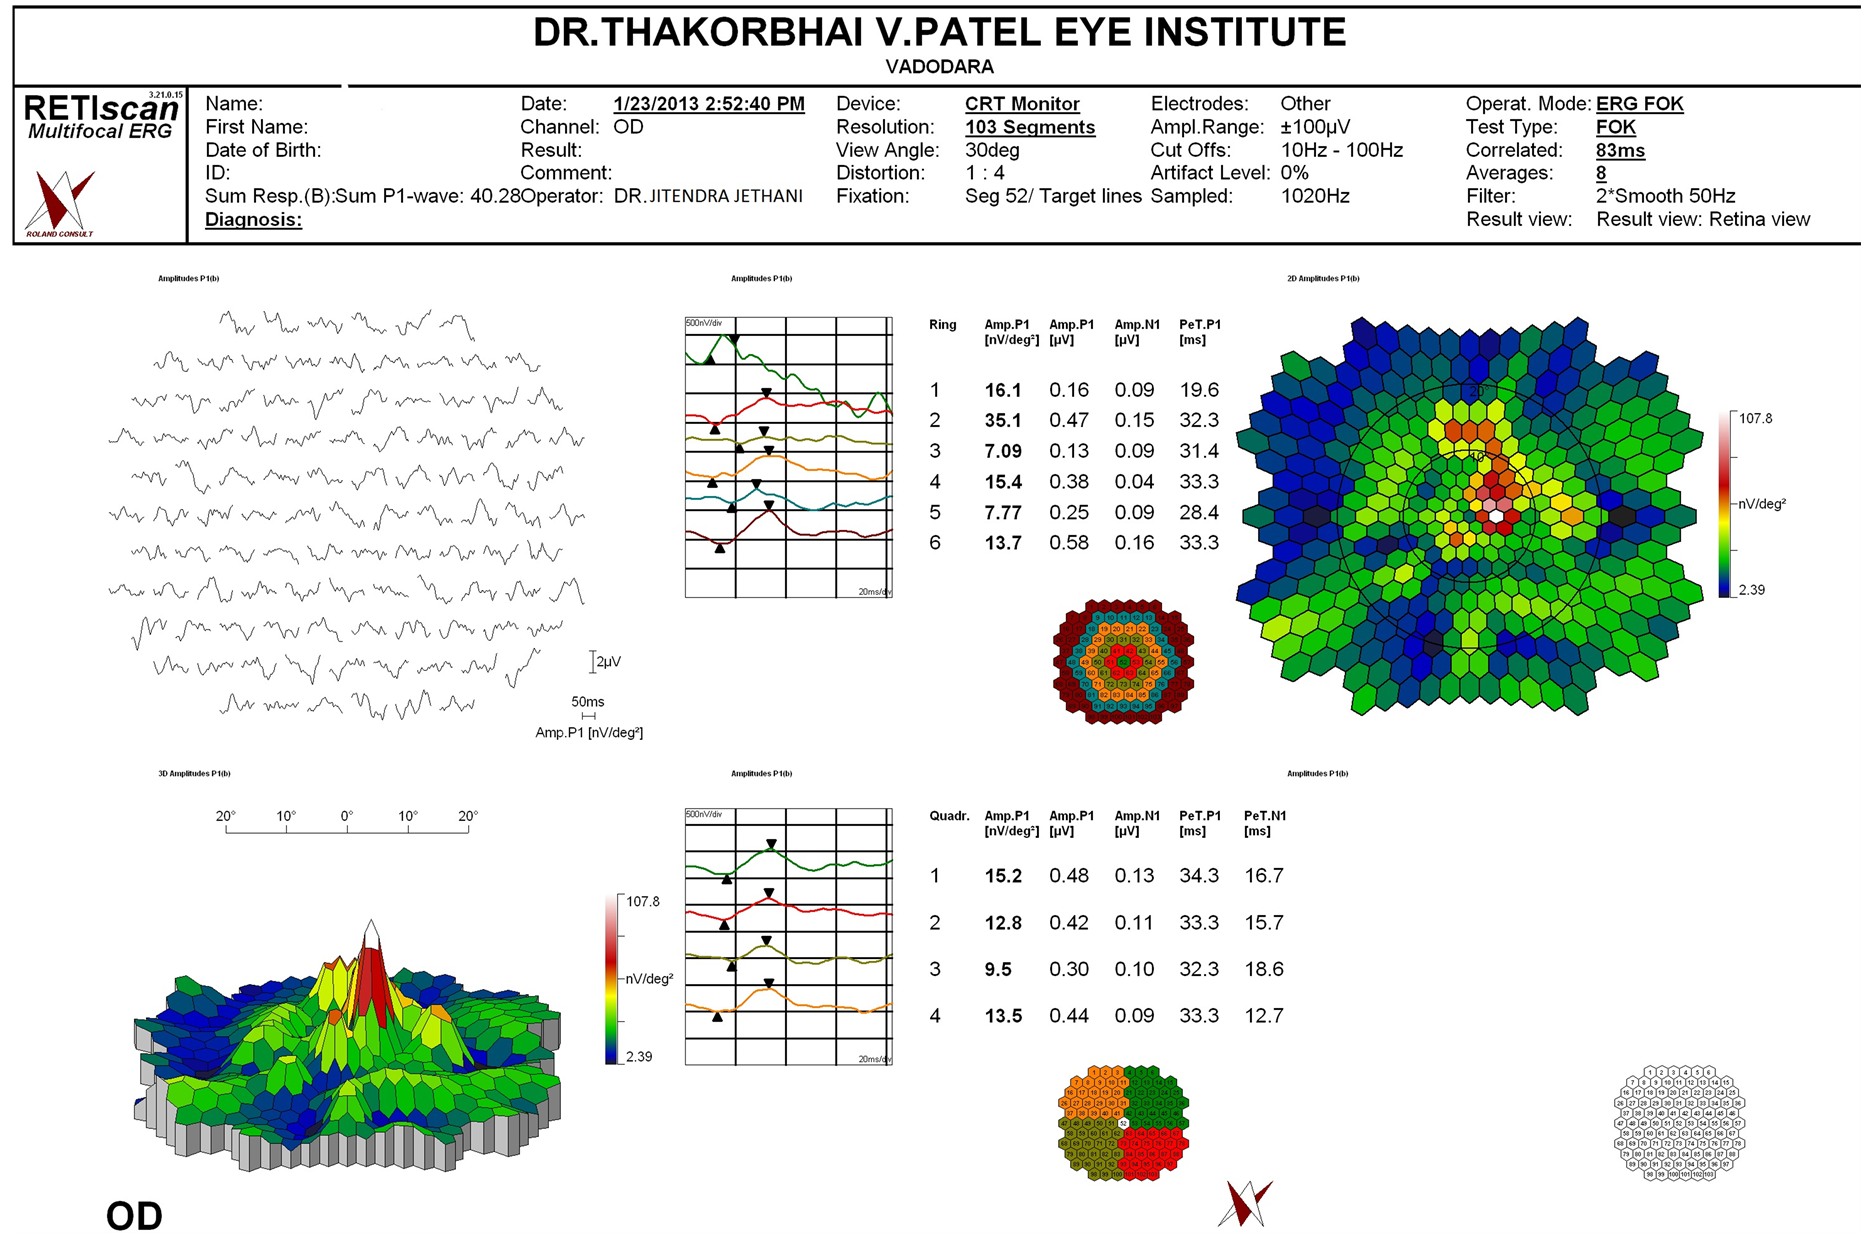
Figure 3. Multifocal ERG of one of the patients shows reduced potential in the central ring corresponding to foveal hypoplasia.
To compare whether the difference in macular thickness with respect to the visual acuity was statistically significant or not we found that the group A with group C, p value was 0.01. On comparison of macular thickness in vision between group B and group A the p value was 0.02 and p value was 0.01 on comparing groups with vision between group B and group C.
On evaluating the amplitude of ring 1 in the mfERG the P1 (the first positive wave) and N1 (the first negative wave) in group A patients was 1.1 ± 0.5 microvolts and 0.7 ± 0.2 microvolts, for group B patients the amplitude for P1 was 0.6 ± 0.5 microvolts and for N1 was 0.3 ± 0.2 microvolts and for group C patients the amplitude for P1 and N1 was 0.7 ± 0.2 microvolts and 0.3 ± 0.1 microvolts respectively. On comparing the group A and group B the p value was 0.01 for amplitude of P1. However, on comparing groups for amplitude of P1 between group C and gropup B the p value was 0.9.
A similar comparison for amplitude of N1 was done between the three groups. The p value on comparing group A with group C was 0.013, between group A with group B was 0.02 and p value for comparison between group C and group B was 0.01. All the comparison showed a significant p value which suggests that the visual acuity and amplitude of these potentials is related to each other.
4. Discussion
The visual acuity in OCA has been compared mainly with the macular thickness (MT) [7] -[10] . The macular thickness obviously is related with visual acuity as has been described by previous authors like Seo et al. [6] and Thomas et al. [9] . A few authors have found out the retinal function in foveal hypoplasia associated with or without OCA. Further, some authors have actually mentioned that foveal hypoplasia should actually be called fovea aplana since the retinal function is actually preserved in isolated foveal aplasia [12] . OCA patients apart from having the increased foveal thickness do have other ocular problems like iris transillumination defects, reduced choroidal pigmentation and abnormal decussation of fibres at the level of optic chiasm which may influence the visual acuity. Therefore a direct comparison of isolated foveal aplasia or cone achromotopsia (may have increased foveal thickening) would be errorneous.
A direct comparison of visual acuity with foveal thickness does show that poor visual acuity groups have statistically significant thickening of foveal region [6] -[9] . Since we restricted our study mainly to compare the visual acuity with the thickening of fovea and to compare this with the mf ERG we did not further staged the fovea as suggested by Thomas et al. [9] who used spectral domain OCT to classify these changes.
Kelly et al. [11] did mf ERG and found that only the central 5 - 10 deg of the macula had reduced ERG amplitudes. The mf ERG shows that there is reduction in the amplitude of N1 when the visual acuity is poor. Nusinowitz et al. [1] evaluated the retinal function in albino patients. They suggested that the central retinal function measured with the mERG had flatter response topography with depressed macular function compared to normal controls. They did not compare it with the visual acuity as they felt that the mf ERGs recorded in these patients may be having artefact secondary to the presence of nystagmus. Eye movements of any kind introduce a level of blur in the retinal image that will be variable and dependent on the extent of the eye movement. However, the two groups in our study with visual acuity less than 6/12 did not show much difference in the reduction of amplitude once the visual acuity was less than 6/12. This variation could be because of small sample size or may represent a true cutoff at the level of 6/12. This has to be carefully evaluated since the responses in the central ring are very poor even when the visual acuity is near normal. The responses are poor compared to normative adult responses in the central ring.
As there are currently no available methods to ensure stabilization of the mf ERG stimulus on the retina, or to modify local measurements by the severity of the nystagmus to increase the accuracy of the mf ERG recordings. The nystagmus certainly increases the level of “noise” in the recordings but we believe that a comparison of visual acuity macular thickness should be done with electric potentials to get a true picture of central macular function in these patients. The potentials may be reduced when compared to normal but comparison here was done amongst the OCA patients and that would be valid with visual acuity difference.
The amplitude of both the first negative and the positive wave is severely reduced in the central ring compared to the normal in our population. This could be because of nystagmus or foveal hypoplasia. As Marmor et al. [12] has shown previously that foveal hypoplasia may not affect the mfERG potentials, the continuous movement may have induce the blur and therefore reduced potentials. Also, the variation in visual acuity doesn’t make a difference in the amplitudes of the waves. They are significantly reduced from the normal for the central ring representing fovea.
The sample size in our study is very small for comparison among various groups. The comparison amongst groups reduced the number of eyes further in group A, B and C. However, it is obvious that the visual acuity does get affected due to thicker fovea/ macula but not with the mfERG amplitudes. Another limitation as mentioned above it getting the right potentials with continuous movements as this may not only induce the blur but also may have some artifacts in measuring the true amplitudes despite the use of filters by the machine.
5. Conclusion
Macular thickness in OCA patients affects the visual acuity. Thicker foveas may have reduced vision. The amplitude of central macular function may be reduced with reduced visual acuity especially the N1 waveform. Importantly the P1 waveforms show a reduction in amplitude with visual acuity but once the visual acuity loss is severe the amplitude doesn’t reduce further.
References
- Nusinowitz, S. and Sarraf, D. (2008) Retinal Function in X-Linked Ocular Albinism (OA1). Current Eye Research, 33, 789-803. http://dx.doi.org/10.1080/02713680802376353
- Creel, D., Witkop Jr., C.J. and King, R.A. (1974) Asymmetric Visually Evoked Potentials in Human Albinos: Evidence for Visual System Anomalies. Investigative Ophthalmology, 13, 430-440.
- Creel, D., O’Donnell Jr., F.E. and Witkop Jr., C.J. (1978) Visual System Anomalies in Human Ocular Albinos. Science, 201, 931-933. http://dx.doi.org/10.1126/science.684419
- Russell-Eggitt, I., Kriss, A. and Taylor, D.S. (1990) Albinism in Childhood: A Flash VEP and ERG Study. British Journal of Ophthalmology, 74, 136-140. http://dx.doi.org/10.1136/bjo.74.3.136
- Kriss, A., Russell-Eggitt, I. and Taylor, D. (1990) Childhood Albinism. Visual Electrophysiological Features. Ophthalmic Genetics, 11, 185-192. http://dx.doi.org/10.3109/13816819009020978
- Seo, J.H., Yu, Y.S., Kim, J.H., Choung, H.K., Heo, J.W. and Kim, S.J. (2007) Correlation of Visual Acuity with Foveal Hypoplasia Grading by Optical Coherence Tomography in Albinism. Ophthalmology, 114, 1547-1551. http://dx.doi.org/10.1016/j.ophtha.2006.10.054
- Harvey, P.S., King, R.A. and Summers, C.G. (2006) Spectrum of Foveal Development in Albinism Detected with Optical Coherence Tomography. Journal of American Association for Pediatric Ophthalmology and Strabismus, 10, 237-242. http://dx.doi.org/10.1016/j.jaapos.2006.01.008
- Harvey, P.S., King, R.A. and Summers, C.S. (2008) Foveal Depression and Albinism [Letter]. Ophthalmology, 115, 756; author reply 756-757. http://dx.doi.org/10.1016/j.ophtha.2007.11.006
- Thomas, M.G., Kumar, A., Mohammad, S., Proudlock, F.A., Engle, E.C., Andrews, C., Chan, W.M., Thomas, S. and Gottlob, I. (2011) Structural Grading of Foveal Hypoplasia Using Spectral-Domain Optical Coherence Tomography: A Predictor of Visual Acuity? Ophthalmology, 118, 1653-1660. http://dx.doi.org/10.1016/j.ophtha.2011.01.028
- Chong, G.T., Farsiu, S., Freedman, S.F., Sarin, N., Koreishi, A.F., Izatt, J.A. and Toth, C.A. (2009) Abnormal Foveal Morphology in Ocular Albinism Imaged with Spectral-Domain Optical Coherence Tomography. Archives of Ophthalmology, 127, 37-44. http://dx.doi.org/10.1001/archophthalmol.2008.550
- Kelly, J.P. and Weiss, A.H. (2006) Topographical Retinal Function in Oculocutaneous Albinism. American Journal of Ophthalmology, 141, 1156-1158. http://dx.doi.org/10.1016/j.ajo.2006.01.045
- Marmor, M.F., Choi, S.S., Zawadzki, R.J. and Werner, J.S. (2008) Visual Insignificance of the Foveal Pit: Reassessment of Foveal Hypoplasia as Fovea Plana. Archives of Ophthalmology, 126, 907-913. http://dx.doi.org/10.1001/archopht.126.7.907
NOTES

*Corresponding author.