Health
Vol.5 No.5A(2013), Article ID:31998,18 pages DOI:10.4236/health.2013.55A004
CGH-based microarray detection of cryptic and novel copy number alterations and balanced translocations in cytogenetically abnormal cases of b-cell all
![]()
1Signature Genomic Laboratories, PerkinElmer, Inc., Spokane, USA; *Corresponding Author: roger.schultz@perkinelmer.com
2Seattle Children’s Hospital, Seattle, USA
3Sonora Quest Laboratories, Tempe, USA
4Victorian Cancer Cytogenetics Service, St. Vincent’s Hospital Melbourne, Fitzroy, Australia
5Genetics Associates, Inc., Nashville, USA
6Johns Hopkins University School of Medicine, Baltimore, USA
7Pathology Associates Medical Laboratories (PAML), Spokane, USA
8Fred Hutchinson Cancer Research Center, Seattle, USA
9Department of Molecular and Human Genetics, Baylor College of Medicine, Houston, USA
10Paw Print Genetics, Genetic Veterinary Sciences, Inc., Spokane, USA
11Magee-Womens Hospital, University of Pittsburgh Medical Center, Pittsburgh, USA
12Empire Genomics, Buffalo, USA
Copyright © 2013 Roger A. Schultz et al. This is an open access article distributed under the Creative Commons Attribution License, which permits unrestricted use, distribution, and reproduction in any medium, provided the original work is properly cited.
Received 14 March 2013; revised 2 April 2013; accepted 15 May 2013
Keywords: Acute Lymphoblastic Leukemia; B-Cell ALL; Microarray; Balanced Translocation; Translocation CGH; Hematologic Malignancies
ABSTRACT
Acute lymphoblastic leukemia (ALL) is the most common malignancy in children, with the majority of cases being of precursor B-cell phenoltype. Conventional cytogenetic analysis plays an important role in the diagnosis of B-cell ALL, identifying characteristic chromosomal abnormalities associated with a given prognosis therein facilitating optimized treatment. The more recent introduction of microarray technology to the analysis of B-cell ALL has afforded both higher resolution for the detection of known abnormalities and an ability to identify novel copy number abnormalities (CNAs) with potential clinical relevance. In the current study, microarray analysis was performed on 20 cytogenetically abnormal B-cell ALL cases (10 pediatric and 10 adult), while a novel microarray-based balancedtranslocation detection methodology (translocation CGH or tCGH) was applied to that subset of cases with a known or suspected recurrent balanced translocation. Standard microarray analysis identified that CNAs was not detected by previous conventional cytogenetics in 75% (15/20) cases. tCGH identified 9/9 (100%) balanced translocations defining BCR/ABL1 (x4), ETV6/RUNX1 (x3), and MLL/AFF1 (x2) breakpoints with high resolution. The results illustrate the improved molecular detail afforded by these technologies and a comparison of translocation breakpoints, CNAs and patient age offers new insights into tumor biology with potential prognostic significance.
1. INTRODUCTION
B-cell acute lymphoblastic leukemia (B-cell ALL) is the most common pediatric malignancy. Despite significant advances in treatment resulting in a cure rate of nearly 80% in the pediatric population [1-3], approximately 20% to 25% of children and more than half of adult patients experience relapse [4,5]. Conventional cytogenetic analysis has been an integral part of the evaluation of B-cell ALL, influencing prognosis and treatment decisions [6,7]. Specific cytogenetic findings, such as the t (9;22) (q34;q11.2) resulting in BCR/ABL1 fusion, MLL rearrangements, and hypodiploidy are associated with a poor prognosis [8]. In contrast, hyperdiploidy, particularly involving gains of chromosomes 4 and 10, and the t (12;21) (p13;q22) resulting in ETV6/RUNX1 fusion, are associated with a good prognosis [8]. However, some cases of B-cell ALL lack alterations detectable by conventional cytogenetics and, importantly, some patients with favorable cytogenetic alterations still relapse, which may indicate that that there are additional undetected chromosome aberrations [9].
In recent years, genomic profiling of B-cell ALL using newer technologies has uncovered additional genetic alterations that cannot be detected by conventional cytogenetics [10-12]. Common alterations include genes involved in the regulation of B-cell development and differentiation (PAX5, IKZF1, EBF1, LEF1 and TCF3), cell cycle regulation and tumor suppression (CDKN2A, RB1 and PTEN), and lymphoid signaling (CD200, BTLA, and CRLF2) [10-16]. Many of these alterations are submitcroscopic deletions that can be identified using highdensity oligonucleotide comparative genomic hybridization (CGH)-based microarrays (aCGH) and single nucleotide polymorphism (SNP) microarrays. These novel findings have not only led to insights concerning the boilogy of B-cell ALL, but some have also been shown to be predictors of high-risk disease and have potential as future therapeutic targets. For example, deletions of IKZF1, often too small to be detected by fluorescence in situ hybridization (FISH), have been found to be a strong predictor of relapse [13,17]. Thus, it will be important in the clinical laboratory to employ technology with the capacity to identify these submicroscopic alterations that are below the resolution level of conventional cytogenetics.
Microarray-based detection of copy number alterations (CNAs) has become standard of care for the diagnosis of most constitutional chromosomal imbalances in children with developmental disabilities [18], but its potential for the evaluation of neoplasia in the clinical laboratory has been compromised by the inability to detect balanced rearrangements, which are important recurrent diagnostic and prognostic markers. To circumvent the limitation of balanced translocation detection, traditional microarray may be supplemented with routine karyotyping, selected FISH studies, targeted rtPCR analysis when appropriate, or a broader and more recently described technique of translocation array (tCGH)] [19,20]. This novel technique couples linear amplification of genomic DNA using multiplexed primer sets targeted to a set of translocation breakpoint intervals with microarray analysis, permitting diagnostic detection of balanced translocations with unprecedented genomic resolution of the breakpoints. In the study presented here we characterize 20 cases of cytogenetically abnormal B-cell ALL by microarray analysis, including microarray analysis of putative translocations in 10 cases using a single tCGH assay designed to interrogate genomic DNA for the presence of 8 distinct translocations common in B-cell ALL. Joint analysis of aCGH and tCGH results provides detailed resolution of CNAs and genomic breakpoints offering potential new insights into tumor biology and prognostic significance.
2. MATERIALS AND METHODS
2.1. Specimen Ascertainment
Residual bone marrow or leukemic peripheral blood was obtained after routine testing from seven clinical cytogenetic laboratories for DNA extraction. Routine Gbanded chromosome analysis was performed in the referring laboratories on all samples, and many cases were also analyzed by FISH as directed by standard clinical practice. The cases consisted of 13 bone marrow and four leukemic peripheral blood specimens at the time of initial diagnosis, one bone marrow three weeks after initial diagnosis, and two bone marrow specimens at relapse. Ten cases were from pediatric patients (1 - 18 years old), and ten cases were from adults (25 - 73 years old). Samples were de-identified for all information other than B-cell ALL indication for study, age, sex and prior cytogenetic findings. Except as otherwise indicated, additional specimen was not available for any post-analysis confirmatory studies. This study was conducted in accordance to Signature Genomics’ Spokane-IRB approved protocol.
2.2. DNA Extraction
Genomic DNA was extracted from unenriched blood and bone marrow specimens using the Gentra Puregene Blood Kit (Qiagen, Germantown, MD) according to the manufacturer’s instructions. Two million cells or 150 µl (if cell counts were unavailable) of blood or bone marrow were used as starting material. Additional Cell Lysis Solution (Gentra Puregene Blood Kit) was added to samples with high viscosity to ensure complete lysis. Samples were stabilized in Cell Lysis Solution within 24 to 48 hours of specimen receipt, when possible, to ensure high-quality DNA for use on the microarray.
DNA quality was assessed by measuring DNA concentration, 260/280 nm and 260/230 nm readings on a NanoDrop 2000 Spectrophotometer (Thermo Scientific, Waltham, MA). The DNA was also run on a 1% agarose gel with ethidium bromide to detect degradation. To be included in the study, samples had to have minimal degradation with 260/280 nm values near 1.8 and 260/230 nm readings greater than 1.35.
2.3. Oligonucleotide Microarray Labeling Hybridization and Analysis
Array CGH for copy number analysis was performed using a 135K-feature whole-genome oligonucleotide microarray (aCGH) (Signature OncoChip®, designed by Signature Genomics, Spokane, WA; manufactured by Roche NimbleGen, Madison, WI). When compared to probe coverage over the rest of the genome, this microarray has denser oligonucleotide coverage over 1893 cancer features, including genes with known roles in hematologic malignancies or solid tumors in which deletions or mutations had been previously reported, genes with suspected roles in cancer based on prior expression studies without specific evidence of genomic copy changes, genes with previously speculated roles based solely on association with a biological pathway or gene family, and genes involved in protein and microRNA (miRNA) coding. The microarray has an average coverage of one oligonucleotide per 0.2 - 7.0 kb for the targeted cancer features and genomic backbone coverage of one oligonucleotide per 35 kb. Labeling, hybridization, and washing were performed using previously published methods [21]. Data were analyzed and displayed using custom oligonucleotide aCGH data analysis and visualization software (Oncoglyphix®; Signature Genomics) as previously described [22]. Variants were identified based on the number of consecutive oligonucleotides involved and the magnitude in shift for the log2 ratio, with 5 - 99 oligonucleotides requiring a shift ≥ 0.300, 100 - 999 a shift ≥ 0.200, and a ≥ 1000 a shift ≥ 0.100.
2.4. Translocation CGH
For 10 of the 20 cases, prior chromosome and/or FISH analysis revealed evidence of a clinically relevant balanced translocation. For eight of those cases, translocations were identified by karyotypes only, for one case by both FISH and karyotype, and for one case by FISH only. Nine of those 10 cases had sufficient DNA to be assessed by both aCGH and the translocation CGH array (tCGH). For one additional case (Case 10), aCGH revealed a breakpoint for a genomic copy gain within the MLL gene, raising suspicion of a putative translocation. Thus, case 10 was also evaluated by the tCGH technique, a microarray strategy is based on linear amplification of the junction between partner genes involved in balanced translocations [19,20]. For tCGH, cases were analyzed using a single multiplexed assay designed to detect eight possible translocations (Table 1) that are all recurrent in B-cell
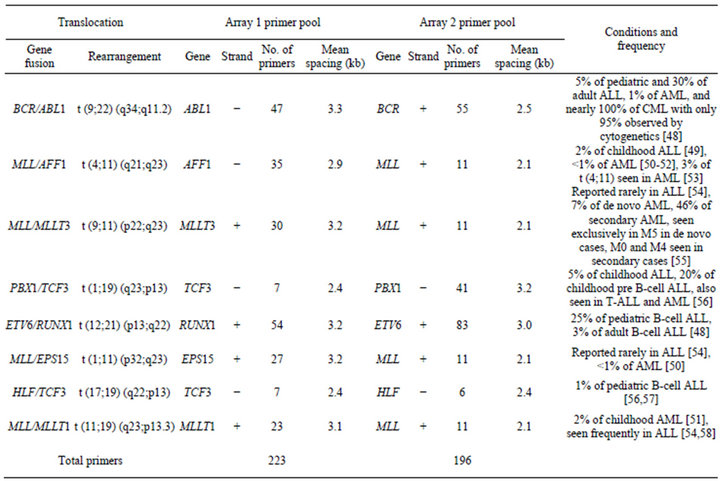
Table 1. Primer coverage in the multiplex tCGH assay designed to simultaneously detect eight different balanced translocations associated with B-cell ALL.
ALL. For each specimen tested, two separate linear amplification reactions were performed using multiplex primer pools designed to amplify one partner of each of the eight targeted balanced translocations (Table 1).
Unique DNA primers for genes of interest were designed using MacVector V11.1 (MacVector, Inc., Cary, NC) software with an average spacing of one primer every 2000 to 3500 bp. Primers were mixed into genespecific and multiplexed reactions at a final concentration of 200 nM for each primer. Linear amplification reactions using 600 ng genomic DNA were performed using the FailSafe PCR System with PreMix Choice using a single buffer (FailSafe PCR 2X PreMix D, Epicentre, Madison, WI) as described by the manufacturer, with 5% DMSO and a final reaction volume of 50 µl. After an initial denaturation at 94˚C for 2 minutes, reactions were amplified for 10 cycles with denaturation at 94˚C for 10 seconds, annealing at 62˚C for 30 seconds, and elongation at 68˚C for 20 minutes. This was followed by another 10 cycles with the same conditions except the denaturation time was increased to 15 seconds and the elongation time was extended by an additional 20 seconds on each successive cycle. The QuickStep 2 PCR Purification Kit (EdgeBio, Gaithersburg, MD) was used according to manufacturer’s specifications to purify samples after the linear amplification reactions and prior to labeling.
Microarray analysis was performed using the following methods. Amplified DNA (40 µl of the purified, linear amplification product) and 600 ng of non-amplified, genomic control DNA were labeled with Cyanine dyes (Cy5 for the specimen and Cy3 for the control) using the NimbleGen Dual-Color DNA Labeling Kit (Roche NimbleGen) and purified as described by the manufacturer. Labeled specimen and control DNA were quantified using the NanoDrop 8000 Spectrophotometer (Thermo Scientific), combined (31 µg each), and coprecipitated with 50 µg of Human Cot-1 DNA (Invitrogen, Carlsbad, CA) in isopropanol. Co-precipitated DNAs were hybridized to the arrays at 42˚C for 40 - 72 hours and then washed as described by the manufacturer (Roche NimbleGen). Arrays were scanned at 2 µm using a Roche NimbleGen MS 200 Microarray Scanner and the data were analyzed with NimbleScan 2.6 software. Results were displayed and analyzed with Oncoglyphix®.
2.5. Affymetrix SNP 6.0 Array Analysis
For Case 2, SNP microarray analysis was performed using the Affymetrix SNP Array 6.0 (Affymetrix, Santa Clara, CA) according to manufacturer’s instructions. Data were analyzed using Affymetrix Chromosome Analysis Suite (ChAS) software also in accordance with the manufacturer’s instructions and visualized with Oncoglyphix®.
3. RESULTS
3.1. Detection of Balanced Translocations by TCGH
Prior chromosome analysis and/or FISH indicated the presence of a clinically relevant balanced translocation in 10 of 20 cases (Tables 2 and 3) and aCGH results identified a potential additional case (case 10) with a CNA within the MLL gene indicative of a possible translocation. Of the 11 cases of interest, 10 had sufficient DNA to perform the tCGH assay (Table 3). Of these, all nine cases that revealed evidence of a translocation by karyotypes or FISH analysis demonstrate translocations by tCGH. These included four cases of t (9;22), three cases of t (12;21), and two cases of t (4;11) (Figure 1). Case 10, which revealed a breakpoint for a genomic copy gain by aCGH, did not exhibit any translocation when analyzed with the tCGH assay. Results provided high resolution mapping of the breakpoints, with precise definition dependent on the oligonucleotide coverage present on the tCGH arrays (Figure 1, Table 3). All translocation breakpoints were confirmed by PCR using individual primers flanking breakpoints defined by tCGH and standard PCR techniques (data not shown).
3.2. Detection of CNAs
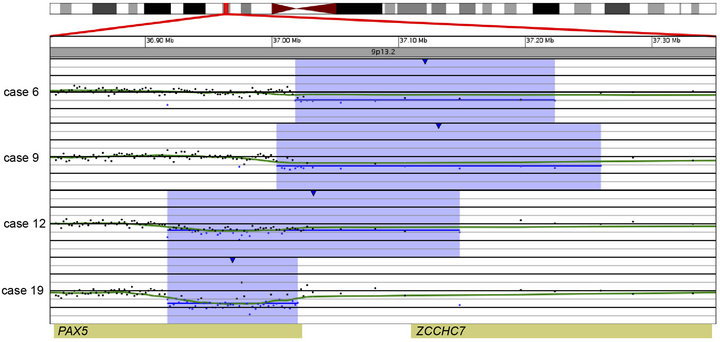
In 15 of the 20 cases (75%), CNAs that were not identified by G-banded analysis or FISH were detected by microarray (Table 2). These alterations ranged from focal intragenic imbalances to gains or losses of many megabases of DNA. Focal CNAs, predominantly deletions, involving genes that have previously been described in ALL included PAX5 (6 cases), BTG1 (4 cases), IKZF1 (6 cases), TOX (3 cases), EBF1 (2 cases), LEF1 (1 case), BTLA (1 case), NR3C1 (1 case), FOXP1 (1 case), and TBL1XR1 (1 case). Of the six cases with PAX5 CNAs, four consisted of heterozygous deletions (~200 to 250 kb) involving one or more exons at the 5’ end of the gene (Cases 6, 9, 12, and 19; Table 2 and Figure 2(a)), one case showed both a focal intronic loss and a multicopy gain involving exons 2 - 5 in PAX5 (Case 13; Table 2 and Figure 2(b)) and another case demonstrated amplification within PAX5 that included exons 2 - 5 (Case 1, Table 2 and Figure 2(b)). In addition to the six cases with focal PAX5 CNAs, one additional case (Case 5; Table 2) had heterozygous loss of PAX5 as the result of loss of 9p from a dic (9;20). Note that for TBL1XR1, the single observed deletion (Case 8) ends 37 kb distal to the 5’-end of the gene and may not impact expression.
All four cases with t (9;22) had loss of IKZF1 including deletions of varying sizes, and one t (9;22) positive case had monosomy 7 (Case 3). One case showed biallelic loss involving IKZF1 due to loss of 7p from an i (7q),
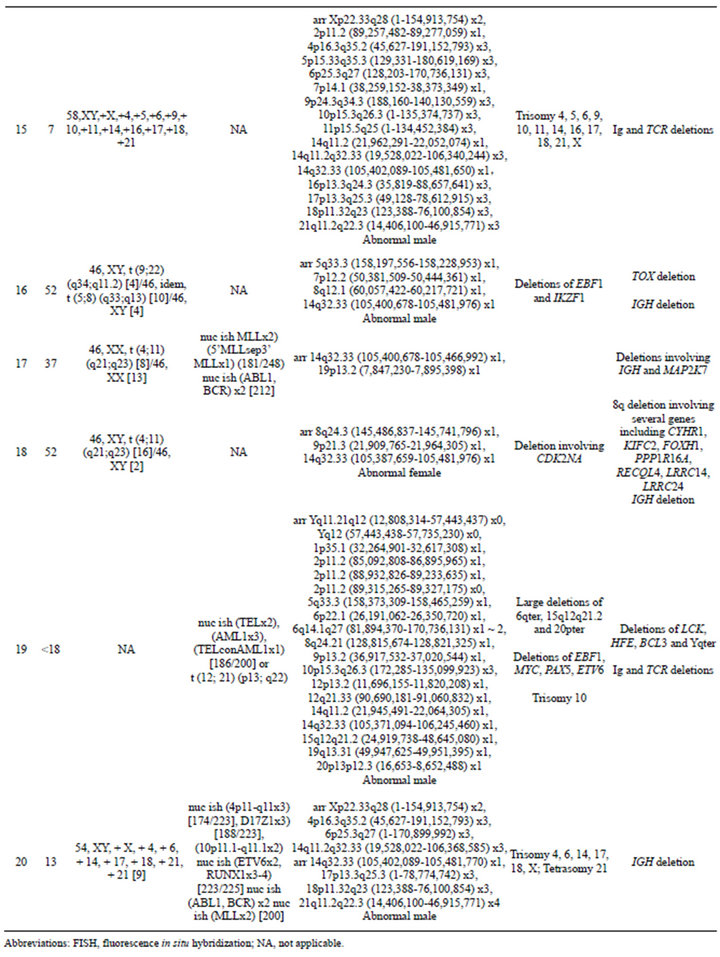
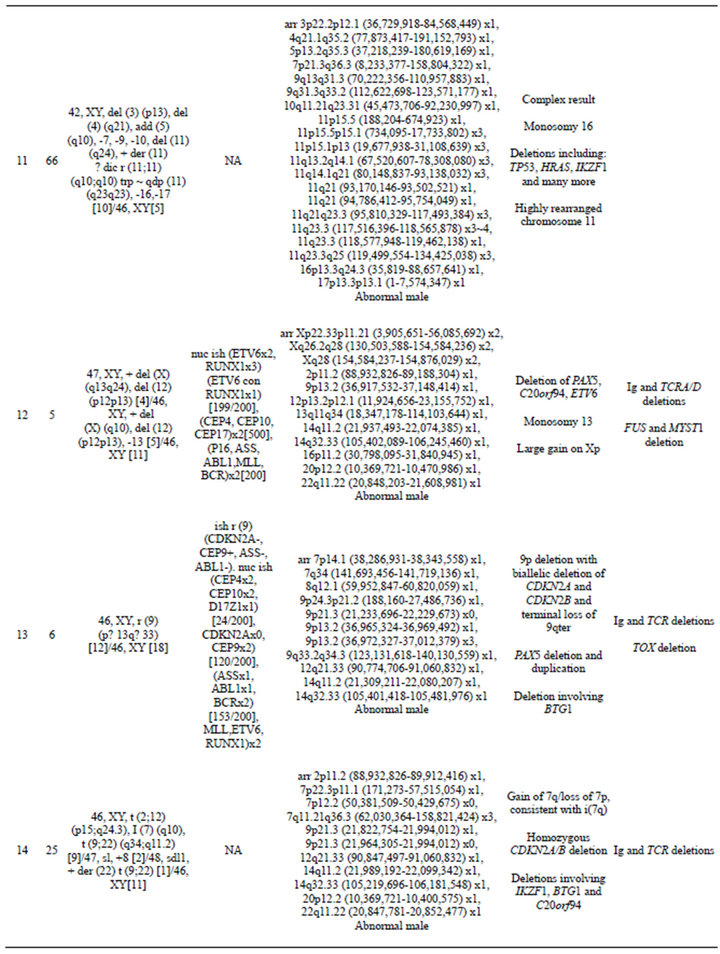
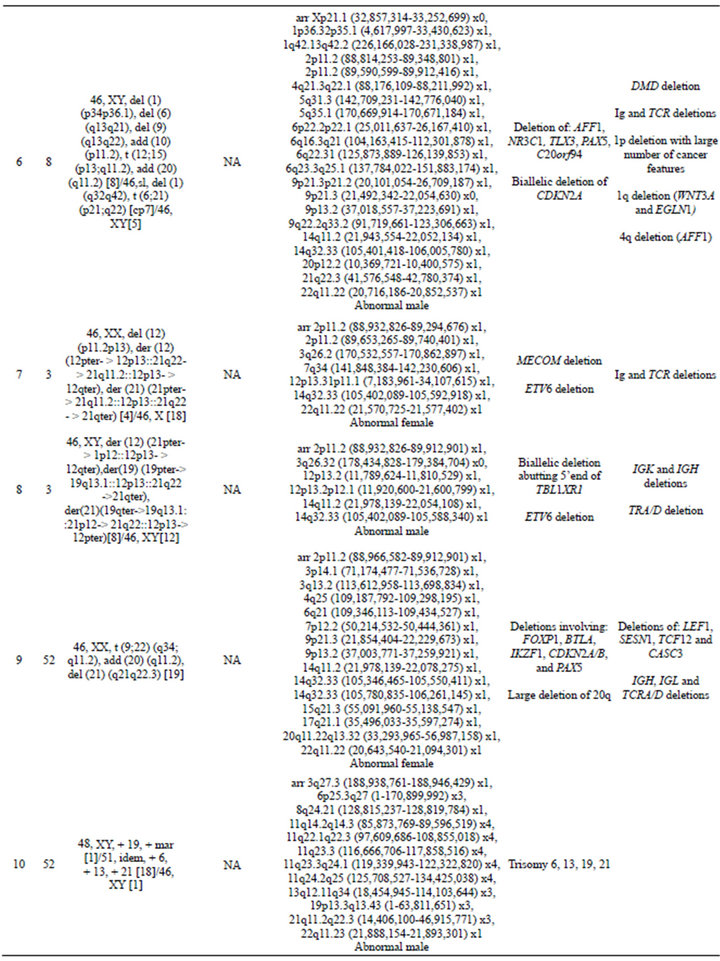
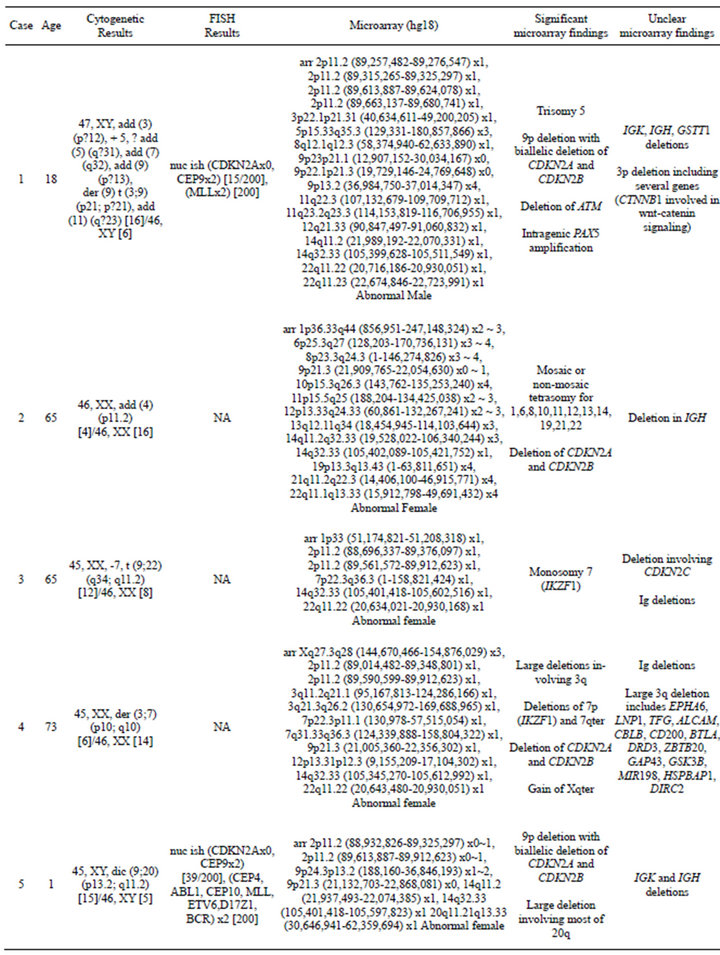
Table 2. Summary of microarray and other cytogenetic results for 20 B-cell ALL cases.
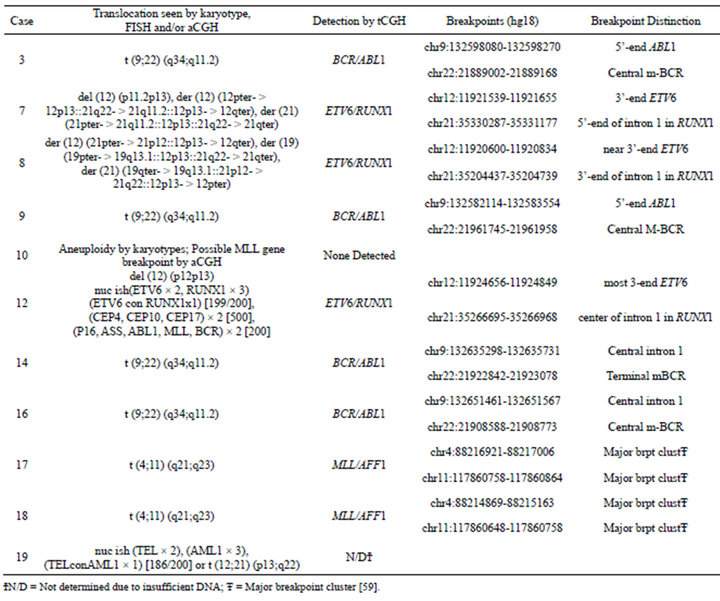
Table 3. Translocation microarray analysis (tCGH) for cases of B-cell ALL with known or suspected balanced translocations.
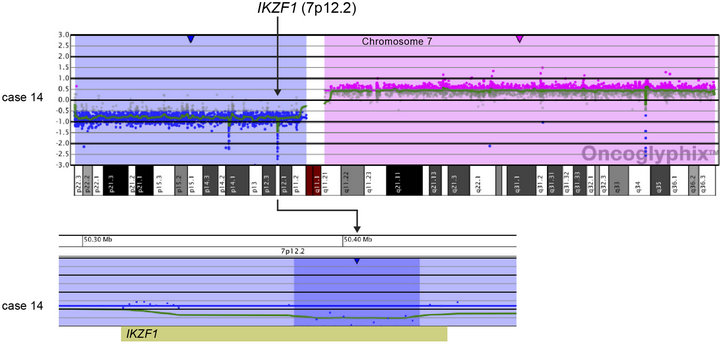
and an additional 48.2-kb deletion within the remaining IKZF1 allele (Case 14; Table 2 and Figure 3(a)). Another case showed focal heterozygous loss of the entire IKZF1gene, but not flanking genes (Case 9; Table 2 and Figure 3(b)), and a third case had a heterozygous deletion, approximately 60 kb in size, involving only the 3’ end of IKZF1 (Case 16; Table 2 and Figure 3(b)).
In addition to focal CNAs, gains and losses involving many megabases of DNA, which were only sometimes identified by conventional cytogenetic analysis, were detected by microarray (Table 2). Some of these alterations involved genes or regions previously known to be involved in ALL, such as deletions of 9p including CDKN2A and deletions of 12p including ETV6. Nine cases had losses involving CDKN2A that ranged from intragenic deletions to deletions of many megabases. Three of these cases had heterozygous deletions ranging from 145 kb to 1.4 Mb (Cases 4, 9, and 18; Table 2) and six had homozygous deletions (Cases 1, 2, 5, 6, 13, and 14; Table 2 and Figure 4). In case 6, biallelic loss of CDKN2A, including a 6.6-Mb loss of 9p21.3p21.2, was not seen by conventional cytogenetics. Of note, for case 14 deletion of one of the CDKN2A alleles that was detected by microarray was below the level of resolution of FISH (~30 kb) (Figure 4). In Case 14, homozygous deletion of CDKN2A was likely to be detectable only by microarray as the lesion (~30 kb) on one allele was likely below the level of resolution of standard CDKN2A FISH probes (150 kb - 190 kb) (Figure 4).
Losses involving ETV6 were seen in all three ETV6/RUNX1 fusion cases (Cases 7, 8, and 12; Table 2, Figure 1) and in one case that did not have a t (12;21) (Case 19; Table 2). Case 8 demonstrated a loss in ETV6 of 21 kb that was only detectable by microarray. Case 10, which was found to have trisomies for chromosomes 6, 13, 19 and 21 but no abnormalities of chromosome 11 by G-banded analysis, also showed multiple two-copy gains throughout 11q by microarray; these included a 1.2-Mb
 (a)
(a)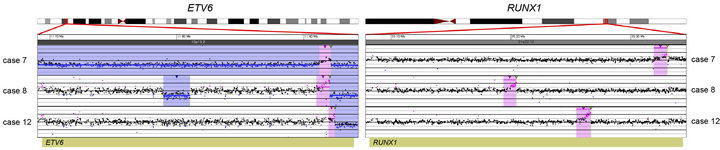 (b)
(b)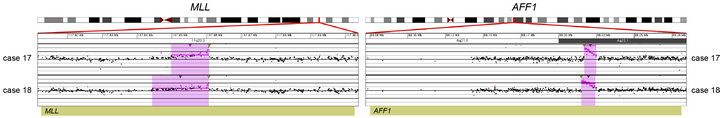 (c)
(c)
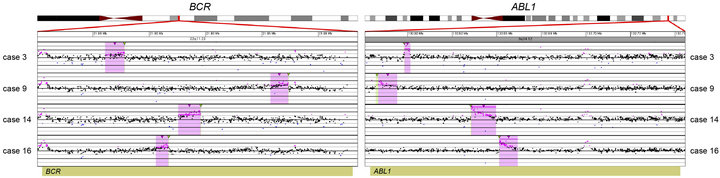
Figure 1. Balanced translocations detected by tCGH in B-cell ALL cases. The probes (pink dots) form a peak, indicating the amplification leading up to the breakpoint region (thin, green triangles). Copy gains (pink shaded regions) and copy losses (blue shaded regions) are also shown. (a) BCR/ABL1 translocations seen in cases 3, 9, 14, and 16. (b) ETV6/RUNX1 translocations seen in cases 7, 8, and 12. (c) MLL/AFF1 translocations seen in cases 17 and 18. For (a)-(c), probes are ordered on the x-axis according to physical mapping positions, and values along the y-axis represent log2 ratios of patient:control signal intensities. Results are visualized using Oncoglyphix (Signature Genomics).
gain in 11q 23.3 with a break in the MLL gene. Although one cell in this case was noted to have a marker chromosome by G-banding that could conceivably consist of 11q material, the presence of a single cell finding is not considered clonal. Even if the marker is part of the leukemic clone, the gains of 11q could not have easily been determined in this case, even by FISH. In cases that had chromosome abnormalities identified by G-banded analysis, microarray findings frequently resulted in more precise characterization of the genomic imbalances. For example, in case 11, abnormalities of chromosome 11 were noted by G-banded analysis; however, the complex pattern of chromosome 11 gains and losses detected by microarray could not be deduced from the karyotype.
Consistent with previous literature [23], cases with MLL gene rearrangements (Cases 17 and 18; Table 2) had only a few CNAs each. In contrast, cases with t (9;22) or t (12;21) frequently showed multiple CNAs. With the exception of case 3 that had a t (9;22) and only two CNAs, the remainder of cases with either a BCR/ABL1 (Cases 9, 14, 16, Table 2) or ETV6/RUNX1 (Cases 7, 8, and 12; Table 2) fusion had 4 to 17 CNAs.
3.3. Detection of Hypodiploidy/ Near-Haploidy
For Case 2, the presence of four copies of many chromosomes and two of others suggested that doubling of a hypodiploid/near-haploid clone had generated a hyperdiploid pattern that can be mistaken for high hyperdiploidy [24]. This is a classic cause for concern given the negative prognostic significance of the former and positive prognostic significance of an overlapping, but distinct, hyperdiploid pattern [25]. We, therefore, analyzed Case 2 by Affymetrix SNP 6.0 microarray analysis. The SNP data showed haplotypes consistent with the doubling of a hypodiploid clone with subsequent clonal evolution allowing the poor prognostic marker to be clearly distinguished from high hyperdiploidy in this case (Figure 5).
 (a)
(a)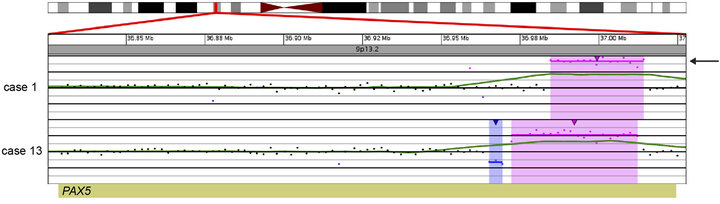 (b)
(b)
Figure 2. Copy number gains and losses of the gene PAX5 at 9p13.2 detected by microarray analysis. PAX5 is involved in the regulation of B-cell development and differentiation. (a) Cases with deletions including one or more exons at the 5’ end of PAX5: Case 6 has a 205-kb loss, Case 9 has a 256-kb loss, Case 12 has a 231-kb loss, and Case 19 has a 103-kb loss. (b) Intragenic copy number alterations of PAX5: Case 1 has a two-copy gain of 30 kb within PAX5 (arrow) and case 13 has a 4-kb loss and a 40-kb gain within PAX5. For A and B, probes are ordered on the x-axis according to physical mapping positions, and values along the y-axis represent log2 ratios of patient:control signal intensities. Results are visualized using Oncoglyphix (Signature Genomics).
3.4. Discrepancies between G-Banded Chromosome and Microarray Results
Although it was expected that many CNAs detected by microarray would be missed by G-banded analysis as noted above, there were a few cases in which alterations identified by G-banded analysis could not be substantiated by the microarray results. Some cases were noted to have chromosomes with additional material of unknown origin by G-banding (Cases 1, 2, 6, 9, and 11). If these were true “add” abnormalities, they would be expected to show a deletion distal to the breakpoint of the “add” chromosome and gain of the additional chromosomal material. These imbalances were not seen by microarray. It is unlikely that these abnormalities were missed by the microarray due to low-level mosaicism, because all of the “add” chromosomes were present in a high enough proportion of cells to be detected by microarray. It is possible that some of these “add” chromosomes represent balanced rearrangements, or that they are actually normal chromosomes with distortion due to poor morphology, which is a common problem in karyotyping ALL specimens. In addition, in Case 1, deletions of 3p and 9p were detected by microarray that may be the result of the add (3p) and the add (9p); however, there was no deletion of 7q that would be expected from the add (7q) reported in the same clone from this case. For Case 9, a del(21) (q21;q22.3) was reported by G-banding, but no 21q deletion was detected by microarray. Again, it may be that the 21q abnormality consists of a balanced rear-
 (a)
(a)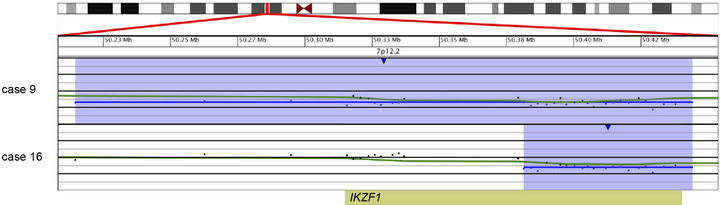 (b)
(b)
Figure 3. Copy number losses of IKZF1 at 7p12.2 detected by microarray analysis. IKZF1 is involved in the regulation of B-cell development and differentiation. (a) Microarray results for case 14, showing a copy number loss of the entire p-arm of chromosome 7 (shaded in blue) and a copy number gain of the entire q-arm (shaded in pink). The zoomed-in view of IKZF1 at 7p12.2 for case 14 shows an intragenic, biallelic 48.2 kb loss of part of IKZF1 (shorter arrow). (b) Microarray results for cases 9 and 16 with copy number losses (shaded in blue) of 7p12.2 that include IKZF1. Case 9 has a 320-kb deletion that includes the entire gene, and case 16 has a 62-kb deletion of the 3’-end of the gene. For a and b, probes are ordered on the x-axis according to physical mapping positions, and values along the y-axis represent log2 ratios of patient: control signal intensities. Results are visualized using Oncoglyphix (Signature Genomics).
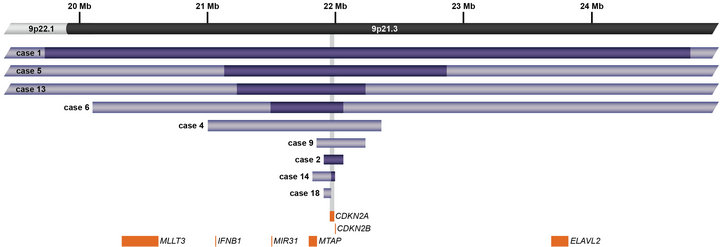
Figure 4. Schematic representation showing deletions of CDKN2A at 9p21.3 detected by microarray analysis in nine cases. CDKN2A is involved in cell cycle regulation and tumor suppression. Light purple bars represent deletion sizes for each case (based on UCSC 2006 hg 18 assembly); the deletions in Cases 1, 5, 6, and 13 are larger than the genomic region shown. Cases 1, 2, 5, 6, 13, and 14 had biallelic deletions represented by dark purple bars. Orange boxes represent cancer features of interest in the region.
 (a)
(a)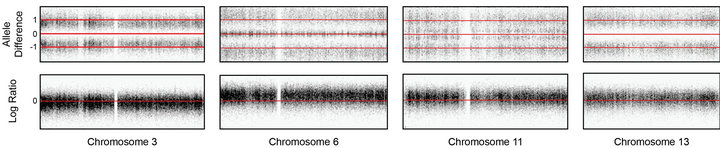 (b)
(b)
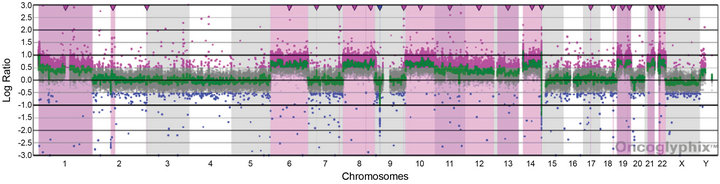
Figure 5. Copy number and SNP microarray analysis of Case 2. (a) aCGH microarray analysis of Case 2 with the Signature OncoChip. Microarray probes are ordered on the x-axis according to physical mapping positions, with data for chromosomes 1 - 22, X, and Y being displayed from left to right, and values along the y-axis represent log2 ratios of patient: control signal intensities. Copy gains are shown as pink shaded regions. Variations in log2 ratios suggest different clones are present in this patient sample. The presence of four copies of many chromosomes and two of others was suggestive of doubling of a hypodiploid clone. (b)-(e) Affymetrix SNP 6.0 analysis of Case 2. The allelic difference for the SNP probes is shown at the top of each panel with the log ratio for the copy number probes shown at the bottom. (b) Data for chromosome 3 are shown as a representative example for chromosomes X, 2, 3, 4, 5, 7, 9, 15, 16, 17, 18, and 20, which showed identical patterns. These data are consistent with a copy number of 2 and loss of heterozygosity with the presence of only two genotypes (AA and BB). (c) Data for chromosome 6 are shown as a representative example for chromosomes 6, 8, 10, 14, 19, 21, and 22, which showed identical patterns. These data are consistent with a copy number of 4 and no loss of heterozygosity with the presence of only three genotypes (AAAA, AABB, and BBBB). (d) Data for chromosome 11 are shown as a representative example for chromosomes 1, 11, and 12, which showed identical patterns. These data are consistent with a copy number of three chromosomes and no loss of heterozygosity with the presence of four genotypes (AAA, AAB, BBA, and BBB). (e) Data for chromosome 13 are shown, the only chromosome in this patient sample with this pattern. These data are consistent with a copy number of three chromosomes and loss of heterozygosity with the presence of only two genotypes (AAA and BBB). The presence of homozygosity in the chromosomes with two copies as well as the presence of heterozygosity in the chromosomes with four copies is consistent with doubling of a hypodiploid clone. For (a)-(e), results are visualized using Oncoglyphix (Signature Genomics).
rangement, with 21q material missing from one chromosome 21 homologue but inserted elsewhere in the genome. In case 11, monosomy 7, 9, and 10 were reported by G-banded analysis. The microarray results for this case showed loss of most of chromosome 7 but normal copy number from 7p21.3 to the terminus, an interstitial loss of 9q but normal copy number for the remainder of chromosome 9, and an interstitial deletion of 10q with normal copy number for the rest of chromosome 10. As this case had a complex karyotype, it is not surprising that the retained segments of chromosomes 7, 9, and 10 could be present in a rearranged form that was not identifiable by G-banding. These cases illustrate that microarray analysis can clarify the karyotype results and provide a more accurate and unbiased assessment of imbalances in the cancer genome.
4. DISCUSSION
Conventional cytogenetics has been the standard of care for the identification of diagnostically and prognostically significant genomic alterations in ALL, despite the inherent challenge posed by these cases due to poor chromosome morphology. Although FISH has allowed for the detection of known alterations regardless of the presence of metaphase cells or poor morphology, the number of FISH tests that can be performed on a given case is limited, and some of the recently detected deletions of known clinical significance are below the resolution level of FISH. Despite those limitations and in spite of the relative small size of the cohort studied, the cases examined showed an age-related pattern of abnormalities highly consistent with that previously reported ([26]). Hyperdiploidy and ETV6/RUNX1 translocations were seen exclusively in pediatric cases, while BCR/ABL1 fusions were restricted to adults.
In this study, microarray analysis allowed for the identification of CNAs below the resolution of chromosome analysis and FISH in 75% of cases. Furthermore, a novel application of linear amplification prior to aCGH, termed tCGH, identified all known translocations in nine specimens. In addition, the translocation breakpoints were identified to within a few hundred base pairs, and in some cases submicroscopic deletions at the translocation breakpoints were evident by the microarray analysis.
Most cases in our study also had additional CNAs detected by microarray, some of which are known to be prognostically significant as summarized below. Similar to other recent studies, CNAs in genes that are involved in B-cell development and differentiation were frequently detected in ALL. Other less frequent deletions in genes involved in B-cell development and differentiation that we detected have been reported in other studies of ALL and include LEF1, BTLA, and EBF1 [27].
PAX5, one of the most frequent targets of alterations in ALL, encodes a transcription factor required for Blineage commitment and maturation [28]. Consistent with recent array studies [10-12], PAX5 losses or gains were present in 33% of the ALL cases tested here (Figure 3). Not including a case with loss of the entire 9p due to a dicentric (9;20), all other cases with CNAs involving PAX5 were either intragenic or only a few hundred kilobases in size. For the current study, cases 9 and 12 showed PAX5 CNAs and were BCR/ABl1 and ETV6/ RUNX1 positive, respectively, with the remaining 4 cases being translocation negative. The PAX5 CNAs consisted of both deletions and amplifications. Mutations in PAX5, including intragenic amplification as seen in case 1, have been previously described in B-cell ALL, although such alterations appear not to be correlated with a particular outcome [16,29].
Also consistent with recent literature, all cases with a t (9;22) in our study were found to have loss of IKZF1 [30]. In one of these cases (Case 16), the deletion was only 63 kb in size, which is below the resolution of FISH probes that are typically used by clinical laboratories. Deletions of IKZF1, which encodes the early lymphoid transcription factor IKAROS, have been found in 84% of BCR/ABL1-positive and 28% of BCR/ABL1-negative ALL [17,30]. IKZF1 alterations have been shown to be associated with poor outcome both in BCR/ABL1-positive and BCR/ABL1-negative ALL [13,27,31]. Thus, the ability to detect IKZF1 deletions is critical for appropriate risk stratification.
Deletions in 8q12, ranging from 160 kb to 4.3 Mb, were detected by microarray in three of our cases. All three of these deletions included or partially overlapped TOX (KIAA080). This gene has been proposed as one of two candidate genes in recurring 8q12.1 deletions that are present in approximately 4% of ALL [32]. TOX, originally shown to play a role in T-cell development, has recently been found to be involved in the development of many cell lineages of the immune system [33]. In Case 16, the 160-kb deletion of 8q12.1 includes the first 5’ exon of TOX and does not involve any other genes; therefore, our results further support TOX as a significant candidate gene within these 8q12.1 deletions.
The microarray results also identified deletions of genes involved in glucocorticoid resistance. Synthetic glucocorticoids are used in the treatment of pediatric ALL due to their ability to induce apoptosis in leukemic blasts; resistance to glucocorticoids is predictive of poor therapy outcome [34]. Focal deletions of BTG1 were present in four of our cases. Deletion of BTG1 is frequently seen in ALL, and loss of BTG1 expression has been shown to result in glucocorticoid resistance [35]. One case in our study demonstrated a deletion within NR3C1 (Case 6), and another had a biallelic loss within GSTT1 (Case 1). Germline mutations in NR3C1 have been found in patients with glucocorticoid resistance, and deletions of this gene have also been described in ALL [27]. Polymorphisms in the glutathione S-transferase (GST) genes have been implicated in glucocorticoid resistance. Inherited homozygous deletions of GSTT1 have been associated with an initial good response to prednisone, although the association between GST polymorphisms and relapse is controversial [36-39].
Other CNAs of interest detected in the cases studied here include frequent CDKN2A losses (9/20; 45%) ranging from small intragenic deletions to many megabases in size (Figure 4). The frequency of losses seen here was higher than that reported in some previous studies [40, 41], although our findings agreed with others [17,42]. Six of the CDKN2A deletions appeared homozygous by array, while the remaining cases may reflect either heterozygosity or homozygosity in a subclone of cells, given the inherent non-cellular limitations of array technology. In a previous study of childhood ALL, CDKN2A deletion was found more frequently in cases with t (9;22) (61%) than with t (12;21) (15%) or MLL gene rearrangements (13%) [40]. The present study showed similar results with CDKN2A deletion found in 2/4 cases with t (9;22), 1/2 cases with a MLL gene rearrangements (Case 18) and in none of the cases with t (12;21).
Cases 17 and 18 exhibited MLL/AFF1 translocations and represent cases with the least number of CNAs detected by aCGH. This is consistent with the notion that MLL gene rearrangement is a potent and sufficient oncogenic driver mutation. Of those cases exhibiting CDKN2A deletion, case 18 exhibited deletion of CDKN 2A at an apparently heterozygous level, the only clinically significant finding in addition to the MLL/AFF1 translocations in the case. In contrast, all three cases with a t (12;21) cases showed intermediate levels of instability as measured by CNAs, including loss of or deletion in ETV6. In addition, one t (12;21) case showed biallelic loss at the 5’-end of TBL1XR1, which has also been found to be a recurrent event in this ALL subtype [43].
The cases showing the greatest number of CNAs were those that did not exhibit recurrent translocations, perhaps a consequence of cellular evolution in search of an oncogenic threshold (e.g., Cases 1, 6, 10, 11, and 13). Of these, Case 1 exhibited a substantial number of CNAs that included both homozygous deletion of CDKN2A and a two-copy gain within the PAX5 locus. As both abnormalities reside on chromosome 9p and are homozygous, the results are suspicious for copy neutral loss of heterozygosity event, although confirmatory SNP analysis was not performed. As shown in Figure 2, the PAX5 two-copy duplication occurs within the gene. Although duplications in PAX5 have previously been thought to result in loss-of-function alleles [12], this duplication involves exons 2-5 that encode the Paired box DNA binding domain that potentially produces an in-frame product. A similar duplication involving the same specific exons was seen in case 13 (Figure 4), a case that also exhibited homozygous deletion of CDKN2A. Thus, a novel PAX5 function related to paired box duplication may be related to greater instability, homozygous CDKN2A mutation and lack of translocation, features shared by these two cases.
In the current study, copy number variation of the immunoglobulin and T-cell receptor genes were noted due to high-density coverage within these genes (see Table 2). Such alterations may also be observed in normal individuals due to somatic rearrangement; however, in hematological malignancies, these copy number changes can be indicative of clonal cell populations (see Table 2). Clonality, if present, may be related to viral infection, immunodeficiency, or neoplasia [44]. Thus, gains and losses of these regions present a unique challenge in the analysis and interpretation of oncology aCGH cases. Further studies employing additional clinical information and a standardized statistical means of analysis will be required for interpreting copy number variation in these regions and ascertaining potential clinical significance of these alterations.
It is important to note that although the aCGH analysis in Case 2 was suggestive of the doubling of a hypodiploid/near-haploid clone, the confirmation of this abnormality was only made possible by subsequent SNP microarray analysis. This information is critical to this case in order to distinguish apparent hyperdiploidy that is associated with a good prognosis from true hypodiploidy that is associated with a poor prognosis.
The tCGH technology offers unprecedented resolution of translocation breakpoints affording a new opportunity to explore the potential clinical and biological value of such data. To this end, Case 9 is of potential interest. Of the BCR/ABL1 positive cases, Case 9 had the most CNAs detected by aCGH and represented newly diagnosed disease. The current data provide high-resolution analysis of the genomic breakpoints for each recurrent translocation. Relative to the other BCR/ABL1 positive cases in this study, for Case 9 those breakpoints map to the furthest 3’-end of intron 1 for BCR and the furthest 5’-end of intron 1 for ABL1, yielding a genomic fusion gene larger than for other BCR/ABL1 translocations. Although all four BCR and ABL1 breakpoints occurs within the first introns of those genes, it is interesting to speculate that regulatory and/or cryptic alternative splice sites might influence the oncogenic potential for the specific fusions. The additional genomic landscape included in the fusion for Case 9 may necessitate the acquisition of additional driver mutations (e.g., deletions of CDKN2A, PAX5, IKZF1) to produce disease. A similar albeit less dramatic example comes from data comparison for Cases 17 and 18. Cases 17 and 18 exhibited MLL/AFF1 translocations and represent cases with the least number of CNAs detected by aCGH. This is consistent with the notion that MLL gene rearrangement is a potent and sufficient oncogengic driver. Consistent with that assumption these cases show minimal CNAs. As determined by tCGH the cases share nearly identical MLL gene breakpoints within the common cluster region (Case 17 = chr11:117860758- 117860864; Case 18 = chr11:1178606 48-117860758), with AFF1 breakpoints separated by only a few kb (case 17 = chr4:88216921-88217006; case 18 = chr4:882148 69-88215163). Once again, one could speculate that the precise sequence context of the breakpoints or specific elements contained in the sequences of difference observed (several kb on chromosome 4) was a contributing factor for Case 18 acquiring the additional oncogenic lesion at CDKN2A. Similar proposals could be generated for the significance of ETV6/RUNX1 breakpoints. Obviously a much larger study would be required to discern to what degree breakpoints correlate with presence of additional oncogene CNAs.
The current study was completed with cases all previously analyzed by chromosome and/or FISH analysis. One potential limitation of microarray-based analysis for leukemia is that separate clones cannot be distinguished; however, current studies indicate that the presence or absence of certain CNAs at diagnosis, such as IKZF1 deletions, are important for determining relapse, regardless of whether they represent the predominant clone at diagnosis [45]. Also certain alterations may be inferred from microarray results, although the mechanism that leads to the alteration(s) may only be confirmed by conventional cytogenetic methods that allow visualization of the chromosomes. For example, microarray results on case 5 showed loss of 9p and 20q that would suggest the presence of a dic (9;20), although confirmation of this finding requires visualization of the metaphase cells by G-banding or FISH. However, if the loss of genetic material is the prognostically significant finding, which it appears to be in the case of the dic (9;20) [46,47], then the specific mechanism of loss is probably not as important as the genetic content of the altered region. Another issue that clinical laboratories will need to address is the potential of uncovering germline CNAs during the course of testing neoplastic specimens for acquired alterations. For example, deletions in the DMD gene have been uncovered in studies of ALL [27] (see also our case 6). Other examples are given in the study performed by Dougherty et al., 2011) [3]. A non-neoplastic source of DNA from the patient may be required to determine if these are acquired or germline alterations and families would ideally receive appropriate pre-test counseling for these scenarios.
Despite the aforementioned issues, the ability to detect diagnostically and prognostically significant translocations and CNAs by microarray has significant advantages over conventional cytogenetics, with the ability to detect deletions below the resolution of FISH. Thus, arrays will be an important adjunct to conventional cytogenetics, and may eventually become the standard for first-tier testing. The ability to detect both prognostically significant balanced rearrangements and genomic imbalances is a major step toward implementing arrays in the clinical laboratory for evaluation of ALL and other forms of neoplasia.
5. ACKNOWLEDGEMENTS
We thank Erin Dodge (Signature Genomics) for figure creation and critical editing of the tables and manuscript and A. Michelle Caldwell (Signature Genomics) for critical editing of the manuscript.
REFERENCES
- Pui, C.H., Pei, D., Sandlund, J.T., Ribeiro, R.C., Rubnitz, J.E., Raimondi, S.C., et al. (2010) Long-term results of St Jude Total Therapy Studies 11, 12, 13A, 13B, and 14 for childhood acute lymphoblastic leukemia. Leukemia, 24, 371-382. doi:10.1038/leu.2009.252
- Pui, C.H., Campana, D., Pei, D., Bowman, W.P., Sandlund, J.T., Kaste, S.C., et al. (2009) Treating childhood acute lymphoblastic leukemia without cranial irradiation. The New England Journal of Medicine, 360, 2730-2741. doi:10.1056/NEJMoa0900386
- Dougherty, M.J., Wilmoth, D.M., Tooke, L.S., Shaikh, T.H., Gai, X., Hakonarson, H., et al. (2011) Implementation of high resolution single nucleotide polymorphism array analysis as a clinical test for patients with hematologic malignancies. Cancer Genetics, 204, 26-38. doi:10.1016/j.cancergencyto.2010.10.007
- Fielding, A.K., Richards, S.M., Chopra, R., Lazarus, H.M., Litzow, M.R., Buck, G., et al. (2007) Outcome of 609 adults after relapse of acute lymphoblastic leukemia (ALL); an MRC UKALL12/ECOG 2993 study. Blood, 109, 944-950. doi:10.1182/blood-2006-05-018192
- Nguyen, K., Devidas, M., Cheng, S.C., La, M., Raetz, E.A., Carroll, W.L., et al. (2008) Factors influencing survival after relapse from acute lymphoblastic leukemia: A Children’s Oncology Group study. Leukemia, 22, 2142- 2150. doi:10.1038/leu.2008.251
- Pui, C.H., Relling, M.V. and Downing, J.R. (2004) Acute lymphoblastic leukemia. The New England Journal of Medicine, 350, 1535-1548. doi:10.1056/NEJMra023001
- Malempati, S., Gaynon, P.S., Sather, H., La, M.K. and Stork, L.C. (2007) Outcome after relapse among children with standard-risk acute lymphoblastic leukemia: Children’s Oncology Group study CCG-1952. Journal of Clinical Oncology, 25, 5800-5807. doi:10.1200/JCO.2007.10.7508
- Pui, C.H., Robison, L.L. and Look, A.T. (2008) Acute lymphoblastic leukaemia. Lancet, 371, 1030-1043. doi:10.1016/S0140-6736(08)60457-2
- Mullighan, C.G. (2011) New strategies in acute lymphoblastic leukemia: Translating advances in genomics into clinical practice. Clinical Cancer Research, 17, 396- 400. doi:10.1158/1078-0432.CCR-10-1203
- Kawamata, N., Ogawa, S., Zimmermann, M., Kato, M., Sanada, M., Hemminki, K., et al. (2008) Molecular allelokaryotyping of pediatric acute lymphoblastic leukemias by high-resolution single nucleotide polymorphism oligonucleotide genomic microarray. Blood, 111, 776-784. doi:10.1182/blood-2007-05-088310
- Kuiper, R.P., Schoenmakers, E.F., van Reijmersdal, S.V., Hehir-Kwa, J.Y., Van Kessel, A.G., Van Leeuwen, F.N., et al. (2007) High-resolution genomic profiling of childhood ALL reveals novel recurrent genetic lesions affecting pathways involved in lymphocyte differentiation and cell cycle progression. Leukemia, 21, 1258-1266. doi:10.1038/sj.leu.2404691
- Mullighan, C.G., Goorha, S., Radtke, I., Miller, C.B., Cou- stan-Smith, E., Dalton, J.D., et al. (2007) Genomewide analysis of genetic alterations in acute lymphoblastic leukaemia. Nature, 446, 758-764. doi:10.1038/nature05690
- Kuiper, R.P., Waanders, E., Van Der Velden, V.H., Van Reijmersdal, S.V., Venkatachalam, R., Scheijen, B., et al. (2010) IKZF1 deletions predict relapse in uniformly treated pediatric precursor B-ALL. Leukemia, 24, 1258-1264. doi:10.1038/leu.2010.87
- White, M.K. and McCubrey, J.A. (2001) Suppression of apoptosis: Role in cell growth and neoplasia. Leukemia, 15, 1011-1021. doi:10.1038/sj.leu.2402143
- Russell, L.J., Capasso, M., Vater, I., Akasaka, T., Bernard, O.A., Calasanz, M.J., et al. (2009) Deregulated expression of cytokine receptor gene, CRLF2, is involved in lymphoid transformation in B-cell precursor acute lymphoblastic leukemia. Blood, 114, 2688-2698.
- Mullighan, C.G. (2010) Genetic Alterations in High-Risk B-Progenitor Acute Lymphoblastic Leukemia, in SIOP Education Book 2010: 42nd Congress of the International Society of Paediatric Oncology, Boston, USA, October 21-24, 2010, Agarwal, B.R., et al. Ed., International Society of Paediatric Oncology, SIOP (International Society of Paediatric Oncology), Eindhoven, 77-87.
- Mullighan, C.G., Su, X., Zhang, J., Radtke, I., Phillips, L.A., Miller, C.B., et al. (2009) Deletion of IKZF1 and prognosis in acute lymphoblastic leukemia. The New England Journal of Medicine, 360, 470-480. doi:10.1056/NEJMoa0808253
- Miller, D.T., Adam, M.P., Aradhya, S., Biesecker, L.G., Brothman, A.R., Carter, N.P., et al. (2010) Consensus statement: chromosomal microarray is a first-tier clinical diagnostic test for individuals with developmental disabilities or congenital anomalies. The American Journal of Human Genetics, 86, 749-764. doi:10.1016/j.ajhg.2010.04.006
- Shaffer, L.G., Schultz, R.A. and Ballif, B.C. (2012) The use of new technologies in the detection of balanced translocations in hematologic disorders. Current Opinion in Genetics & Development, 22, 264-271. doi:10.1016/j.gde.2012.01.005
- Greisman, H.A., Hoffman, N.G. and Yi, H.S. (2011) Rapid High-Resolution Mapping of Balanced Chromosomal Rearrangements on Tiling CGH Arrays. The Journal of Molecular Diagnostics, 13, 621-633. doi:10.1016/j.jmoldx.2011.07.005
- Yu, L., Slovak, M.L., Mannoor, K., Chen, C., Hunger, S.P., Carroll, A.J., et al. (2011) Microarray detection of multiple recurring submicroscopic chromosomal aberrations in pediatric T-cell acute lymphoblastic leukemia. Leukemia, 25, 1042-1046. doi:10.1038/leu.2011.33
- Kolquist, K.A., Schultz, R.A, Furrow, A., Brown, T.C., Han, J.Y., Campbell, L.J., et al. (2011) Microarray-based comparative genomic hybridization of cancer targets reveals novel, recurrent genetic aberrations in the myelodysplastic syndromes. Cancer Genetics, 204, 603-628. doi:10.1016/j.cancergen.2011.10.004
- Mullighan, C.G. and Downing, J.R. (2009) Global genomic characterization of acute lymphoblastic leukemia. Seminars in Hematology, 46, 3-15. doi:10.1053/j.seminhematol.2008.09.005
- Charrin, C., Thomas, X., Ffrench, M., Le, Q.H., Andrieux, J., Mozziconacci, M.J., et al. (2004) A report from the LALA-94 and LALA-SA groups on hypodiploidy with 30 to 39 chromosomes and near-triploidy: 2 possible expressions of a sole entity conferring poor prognosis in adult acute lymphoblastic leukemia (ALL). Blood, 104, 2444- 2451. doi:10.1182/blood-2003-04-1299
- Moorman, A.V., Richards, S.M., Robinson, H.M., Strefford, J.C., Gibson, B.E., Kinsey, S.E., et al. (2007) Prognosis of children with acute lymphoblastic leukemia (ALL) and intrachromosomal amplification of chromosome 21 (iAMP21). Blood, 109, 2327-2330. doi:10.1182/blood-2006-08-040436
- Moorman, A.V. (2012) The clinical relevance of chromosomal and genomic abnormalities in B-cell precursor acute lymphoblastic leukaemia. Blood Reviews. 26, 123- 135. doi:10.1016/j.blre.2012.01.001
- Mullighan, C.G. and Downing, J.R. (2009) Genome-wide profiling of genetic alterations in acute lymphoblastic leukemia: Recent insights and future directions. Leukemia, 23, 1209-1218. doi:10.1038/leu.2009.18
- Nutt, S.L., Eberhard, D., Horcher, M., Rolink, A.G. and Busslinger, M. (2001) Pax5 determines the identity of B cells from the beginning to the end of B-lymphopoiesis. International Reviews of Immunology, 20, 65-82. doi:10.3109/08830180109056723
- Nebral, K., Denk, D., Attarbaschi, A., Konig, M., Mann, G., Haas, O.A., et al. (2009) Incidence and diversity of PAX5 fusion genes in childhood acute lymphoblastic leukemia. Leukemia, 23, 134-143. doi:10.1038/leu.2008.306
- Mullighan, C.G., Miller, C.B., Radtke, I., Phillips, L.A., Dalton, J., Ma, J., et al. (2008) BCR-ABL1 lymphoblastic leukaemia is characterized by the deletion of Ikaros. Nature, 453, 110-114. doi:10.1038/nature06866
- Martinelli, G., Iacobucci, I., Storlazzi, C.T., Vignetti, M., Paoloni, F., Cilloni, D., et al. (2009) IKZF1 (Ikaros) deletions in BCR-ABL1-positive acute lymphoblastic leukemia are associated with short disease-free survival and high rate of cumulative incidence of relapse: A GIMEMA AL WP report. Journal of Clinical Oncology, 27, 5202- 5207. doi:10.1200/JCO.2008.21.6408
- Bardet, V., Couque, N., Cattolico, L., Hetet, G., Devaux, I., Duprat, S., et al. (2002) Molecular analysis of nonrandom 8q12 deletions in acute lymphoblastic leukemia: Identification of two candidate genes. Genes Chromosomes Cancer, 33, 178-187. doi:10.1002/gcc.10014
- Aliahmad, P., de la Torre, B. and Kaye, J. (2010) Shared dependence on the DNA-binding factor TOX for the development of lymphoid tissue-inducer cell and NK cell lineages. Nature Immunology, 11, 945-952. doi:10.1038/ni.1930
- Tissing, W.J., Meijerink, J.P., den Boer, M.L. and Pieters, R. (2003) Molecular determinants of glucocorticoid sensitivity and resistance in acute lymphoblastic leukemia. Leukemia, 17, 17-25. doi:10.1038/sj.leu.2402733
- Van Galen, J.C., Kuiper, R.P., Van Emst, L., Levers, M., Tijchon, E., Scheijen, B., et al. (2010) BTG1 regulates glucocorticoid receptor autoinduction in acute lymphoblastic leukemia. Blood, 115, 4810-4819. doi:10.1182/blood-2009-05-223081
- Davies, S.M., Bhatia, S., Ross, J.A., Kiffmeyer, W.R., Gaynon, P.S., Radloff, G.A., et al. (2002) Glutathione S-transferase genotypes, genetic susceptibility, and outcome of therapy in childhood acute lymphoblastic leukemia. Blood, 100, 67-71. doi:10.1182/blood.V100.1.67
- Takanashi, M., Morimoto, A., Yagi, T., Kuriyama, K., Kano, G., Imamura, T., et al. (2003) Impact of glutathione S-transferase gene deletion on early relapse in childhood B-precursor acute lymphoblastic leukemia. Haematologica, 88, 1238-1244.
- Meissner, B., Stanulla, M., Ludwig, W.D., Harbott, J., Moricke, A., Welte, K., et al. (2004) The GSTT1 deletion polymorphism is associated with initial response to glucocorticoids in childhood acute lymphoblastic leukemia. Leukemia, 18, 1920-1923. doi:10.1038/sj.leu.2403521
- Sulong, S., Moorman, A.V., Irving, J.A., Strefford, J.C., Konn, Z.J., Case, M.C., et al. (2009) A comprehensive analysis of the CDKN2A gene in childhood acute lymphoblastic leukemia reveals genomic deletion, copy number neutral loss of heterozygosity, and association with specific cytogenetic subgroups. Blood, 113, 100-107. doi:10.1182/blood-2008-07-166801
- Bertin, R., Acquaviva, C., Mirebeau, D., Guidal-Giroux, C., Vilmer, E. and Cave, H. (2003) CDKN2A, CDKN2B, and MTAP gene dosage permits precise characterization of monoand bi-allelic 9p21 deletions in childhood acute lymphoblastic leukemia. Genes Chromosomes Cancer, 37, 44-57. doi:10.1002/gcc.10188
- Usvasalo, A., Savola, S., Raty, R., Vettenranta, K., HarilaSaari, A., Koistinen, P. et al. (2008) CDKN2A deletions in acute lymphoblastic leukemia of adolescents and young adults: An array CGH study. Leukemia Research, 32, 1228-1235. doi:10.1016/j.leukres.2008.01.014
- Parker, H., An, Q., Barber, K., Case, M., Davies, T., Konn, Z. et al. (2008) The complex genomic profile of ETV6- RUNX1 positive acute lymphoblastic leukemia highlights a recurrent deletion of TBL1XR1. Genes Chromosomes Cancer, 47, 1118-1125. doi:10.1002/gcc.20613
- Hodges, E., Krishna, M.T., Pickard, C. and Smith, J.L. (2003) Diagnostic role of tests for T cell receptor (TCR) genes. Journal of Clinical Pathology, 56, 1-11. doi:10.1136/jcp.56.1.1
- Roberts, K.G. and Mullighan, C.G. (2011) How new advances in genetic analysis are influencing the understanding and treatment of childhood acute leukemia. Current Opinion in Pediatrics, 23, 34-40. doi:10.1097/MOP.0b013e3283426260
- Schoumans, J., Johansson, B., Corcoran, M., Kuchinskaya, E., Golovleva, I., Grander, D., et al. (2006) Characterisation of dic(9;20)(p11-13;q11) in childhood B-cell precursor acute lymphoblastic leukaemia by tiling resolution array-based comparative genomic hybridisation reveals clustered breakpoints at 9p13.2 and 20q11.2. British Journal of Haematology, 135, 492-499. doi:10.1111/j.1365-2141.2006.06328.x
- Strefford, J.C., Worley, H., Barber, K., Wright, S., Stewart, A.R., Robinson, H.M. et al. (2007) Genome complexity in acute lymphoblastic leukemia is revealed by array-based comparative genomic hybridization. Oncogenomics, 26, 4306-4318. doi:10.1038/sj.onc.1210190
- Dewald, G.W., Ketterling, R.P., Wyatt, W.A. and Stupca, P.J. (2002) Cytogenetics studies in neoplastic hematologic disorders, in clinical laboratory medicine. In: McClatchey, K.D., Ed., Lippincott Williams & Wilkins, Philadelphia, 658-685.
- Pui, C.H., Frankel, L.S., Carroll, A.J., Raimondi, S.C., Shuster, J.J., Head, D.R. et al. (1991) Clinical characteristics and treatment outcome of childhood acute lymphoblastic leukemia with the t(4;11)(q21;q23): A collaborative study of 40 cases. Blood, 77, 440-447.
- Grimwade, D., Walker, H., Oliver, F., Wheatley, K., Harrison, C., Harrison, G., et al. (1998) The importance of diagnostic cytogenetics on outcome in AML: Analysis of 1,612 patients entered into the MRC AML 10 trial. The Medical Research Council Adult and Children’s Leukaemia Working Parties. Blood, 92, 2322-2333.
- Raimondi, S.C., Chang, M.N., Ravindranath, Y., Behm, F.G., Gresik, M.V., Steuber, C.P., et al. (1999) Chromosomal abnormalities in 478 children with acute myeloid leukemia: Clinical characteristics and treatment outcome in a cooperative pediatric oncology group study-POG 8821. Blood, 94, 3707-3716.
- Balgobind, B.V., Raimondi, S.C., Harbott, J., Zimmermann, M., Alonzo, T.A., Auvrignon, A., et al. (2009) Novel prognostic subgroups in childhood 11q23/MLLrearranged acute myeloid leukemia: Results of an international retrospective study. Blood, 114, 2489-2496. doi:10.1182/blood-2009-04-215152
- Johansson, B., Moorman, A.V., Haas, O.A., Watmore, A.E., Cheung, K.L., Swanton, S., et al. (1998) Hematologic malignancies with t(4;11)(q21;q23)—A cytogenetic, morphologic, immunophenotypic and clinical study of 183 cases. European 11q23 Workshop participants. Leukemia, 12, 779-787. doi:10.1038/sj.leu.2401012
- Burmeister, T., Meyer, C., Schwartz, S., Hofmann, J., Molkentin, M., Kowarz, E., et al. (2009) The MLL recombinome of adult CD10-negative B-cell precursor acute lymphoblastic leukemia: Results from the GMALL study group. Blood, 113, 4011-4015. doi:10.1182/blood-2008-10-183483
- Sandoval, C., Head, D.R., Mirro, J.Jr., Behm, F.G., Ayers, G.D. and Raimondi, S.C. (1992) Translocation t(9;11) (p21;q23) in pediatric de novo and secondary acute myeloblastic leukemia. Leukemia, 6, 513-519.
- Hunger, S.P. (1996) Chromosomal translocations involveing the E2A gene in acute lymphoblastic leukemia: Clinical features and molecular pathogenesis. Blood, 87, 1211- 1224.
- Raimondi, S.C., Privitera, E., Williams, D.L., Look, A.T., Behm, F., Rivera, G.K., et al. (1991) New recurring chromosomal translocations in childhood acute lymphoblastic leukemia. Blood, 77, 2016-2022.
- Rubnitz, J.E., Behm, F.G., Curcio-Brint, A.M., Pinheiro, R.P., Carroll, A.J., Raimondi, S.C., et al. (1996) Molecular analysis of t(11;19) breakpoints in childhood acute leukemias. Blood, 87, 4804-4808.
- Meyer, C., Schneider, B., Jakob, S., Strehl, S., Attarbaschi, A., Schnittger, S., et al. (2006) The MLL recombinome of acute leukemias. Leukemia, 20, 777-784. doi:10.1038/sj.leu.2404150