Health
Vol.4 No.10A(2012), Article ID:24247,4 pages DOI:10.4236/health.2012.430144
Influenza epidemics and Spanish climatic domains
![]()
Department of Geography, University of Cantabria, Santander, Spain; fernandhp@unican.es
Received 19 September 2012; revised 17 October 2012; accepted 29 October 2012
Keywords: Acclimatization; Adaptation; Biometeorology; Reanalysis; Weather Types; Strain
ABSTRACT
The present article proposes a climatic approach to the study of the interaction between influenza spreading and climatic and meteorological factors in different climatic domains of the Iberian Peninsula. This association can be used to help in the prevention and mitigation of influenza epidemics. A biometeorological index has been defined and applied to the epidemic periods that took place in the Iberian Peninsula between 2000 and 2009 considering its climatic domains.
1. INTRODUCTION
The term influenza comes initially from Latin language—influere—which meaning is formed by “inside”, “to flow” and “the action of”. The term was used in Italy [1] for epidemic diseases at least since 1504 after having a relevant even of scarlet fever in this country. In 1743 there was a relevant epidemic all over Europe which was called “influenza di cattarro” which can be translated as “flow of cold”. In French language [2] influenza comes from the astronomic term “influence” which refers to the “radiation of an ethereal fluid from the stars, regarded as affecting humans actions and destinies”. The medical meaning of the term influenza was used in French and English language (flu) at the end of the XVIII century and in Spanish one in 1895.
Any approach to the study of influenza should consider at least three different complex approaches: a) the microbiological one, which it is related to the study of the different types of influenza viruses and strains from a biological point of view; b) the spatial spreading dimension of an infectious disease. This is a complex issue where social and cultural factors are very relevant; c) the environmental approach in which the main difficulty is found on the multiple interactions there are between human beings and natural surroundings. This research is essentially focused in this final line considering the study of the interactions between climate/weather and influenza expansion.
2. CLIMATE AND INFLUENZA
2.1. Climate and Weather
First, it is necessary to clarify two concepts that are normally misunderstood such as weather and climate. Weather has been defined by the World Meteorological Organization (WMO) as the state of the atmosphere in a particular moment or in a short period of time. On the other hand, climate refers to the average state of the atmosphere for a long period of time (30 - 40 years) on a specific region of the world. Climatic and meteorological patterns are defined through the empirical measurement of meteorological variables such as maximum and minimum temperatures, air humidity, precipitation or solar radiation. Seasons are a clear consequence of astronomic and atmospheric factors.
One of the most relevant characteristics of influenza epidemics is also its seasonality as an emergent property of viral infection and host status. Influenza B virus mutates at a much lower rate than influenza A does. Variability and change of the host immune system are frequent [3]. Therefore, influenza seasonality may be linked to this “ups and downs” of the strength of the host immune system, which it can be related, to some extent, to meteorological factors such as the light/dark cycle, humidity or air temperature [4]. Host nutrient intake may also contribute to the seasonal patterns of flu, especially when vitamin D and selenium level are low in host [5]. Climate limits the geographical extend of infectious diseases and its produce biological answers [6].
2.2. Health: A Biometeorological Approach
The International Society of Biometeorology (ISB) defines Biometeorology as an interdisciplinary science that considers the interaction between atmospheric processes and living organisms (plant, animals and humans) with the central question within the field being “how does weather and climate impact the well-being of all living creatures?” [7]. Biometeorology is an interdisciplinary science where researchers from many different backgrounds get together to share different approaches about the same topic. From a biometeorological point of view, human health is related to concepts of acclimatization and adaptation. Acclimatization takes place in a relatively short period of time while adaptation needs a longer period to happen.
From micro to macro scales, human being is constantly acclimatizing and adapting to atmospheric variability and changes. As it can be seen in Figure 1, there are continuous impacts on human’s health at different temporal scales. Weather variability has affected our health on daily basis for ages while climate change can provoke, directly or indirectly, big health impacts on different parts of the world on a longer temporal scale.
Health impacts from climate change can be avoided through migration and through biological, cultural, infrastructural or technological adaptation processes [8]. Moreover, strategies for mitigation of climate change impacts have been developed for the last decade from different report of the International Panel for Climate Change [9]. However, weather variability has been affecting our health for ages on a more quiet way and few studies have been developed in this issue. Small meteorological changes can produce physiological stress. Then, a process of acclimatization and/or adaptation on human beings health occurs. Healthy people have not problems in these processes but elderly people or those which chronic diseases can get into troubles because of it. Previous studies have already shown, via experimentation in animals [10] or from a biometeorological approach [11], that the probability of being infected is related to air humidity and temperature.
2.3. Hyphothesis
This research is mainly based on the following hypothesis. Meteorological contrast at a synoptic level can generate physiological and psychological stress. The more extreme the contrast is, the bigger the impact on human health can be. If there is no mitigation of the
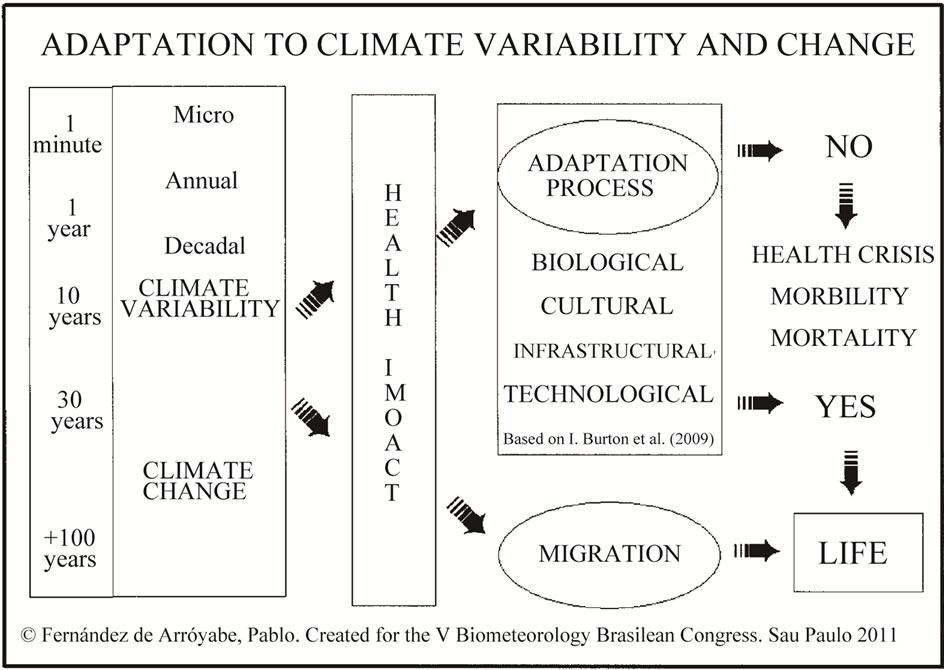
Figure 1. Adaptation to climate variability and change.
impacts, no adaptation, no migration, a health crisis is produced and morbidity and mortality rates increase because of atmospheric reasons. Meteorological contrast can make weaker humans immune system or stimulate viruses’ activity increasing their potential for infection. Meteorological contrast can be produced at different scales. This study is mainly focused on the analysis of contrast at a synoptic level. Any potential link between weather and influenza should be considered as a potential starting point in the process of defining a health warning systems based on biometeorological forecasting at a synoptic scale.
3. DATA AND METHODOLOGY
3.1. Medical Data and Climatic Domains
Influenza data have been facilitated by the National Center of Epidemiology (CNE) at the Health Institute Carlos III, in Madrid, where the Spanish Influenza Sentinel Network submits periodically the number of influenza cases that have been registered at a regional level by Autonomous Communities. The available data corresponds to the official rates—number of cases per 100,000 habitants—from 2000 to 2009. The average rate per climatic regions has been calculated attending to available information for the three different Spanish climatic domains Figure 2, (Atlantic, Continental and Mediterranean).
3.2. Meteorologic Data and Types of Weather
Meteorological reanalysis datasets have been obtained from the National Center for Atmospheric Research
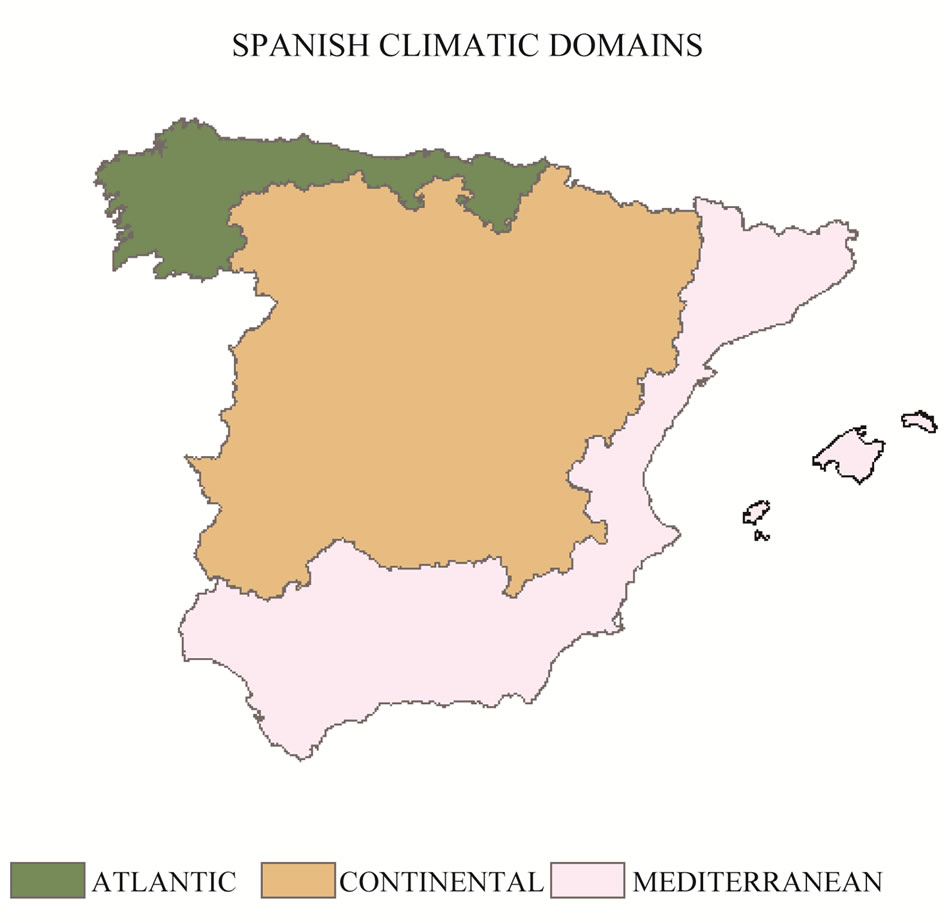
Figure 2. Spanish climatic domains.
(NCAR) in the USA, for the studied period. Daily gridded sea level pressure (SLP) has been used as input in order to define a four daily weather types classification (CWT) [12]. The grid has a spatial resolution of 2.5 degree and covers the Iberian Peninsula. The classification method is based on three flow indices: direction and strength of the flow and total shear vorticity. The resulting catalog is formed by sixteen adventive weather types corresponding to the normal wind rose directions, two rotational (A, C) and one undefined type (U).
3.3. Meteorological Contrast Index
The Meteorological Contrast Index (MCI) has been applied using the epidemiologic week as temporal unit of analysis which traditionally goes from Sunday to Saturday. MCI is based on the estimation of three parameters:
• Parameter 1 (P1): Diversity of types of atmospheric circulation on a specific period of time, in this particular case during each epidemiologic week.
• Parameter 2 (P2): The number of outbreaks in the sequence of types during the studied period.
• Parameter 3 (MCI): Magnitude of contrast in the outbreaks.
According to these criteria, it has been written a specific soft package to estimate automatically the MCI. The index can be calculated with any existing or future catalog of weather types. It is scalable and can be applied to any region around the world using different delay periods for the analysis and varying the number of daily weather types from one to four. In this particular research, MCI has been computed considering a delay period between the infection and the medical diagnostic of seven days and considering only the daily weather type registered at GMT 12:00 hours. This tool is freely available in Spanish language and it will be in English soon from the website: http://www.geobiomet.es.
4. RESULTS AND DISCUSSION
Results are presented attending to the different scales of climate and weather mentioned previously. A down scaling style, no statistical but geographical, is proposed for the presentation of results.
4.1. Climate and Influenza
It is clear that influenza rates vary each year as it can be seen in Figure 3 which shows how different epidemic processes can be depending on many factors, especially on the type circulating viruses and their stains patterns.
The temporal window in which the disease spreads oscillates from year to year. While the expansion of the epidemic was very soon in the period 2003-2004, reaching the peak point in week 4, it was very late in period 2005-2006 when the peak took place on week 11. Never-
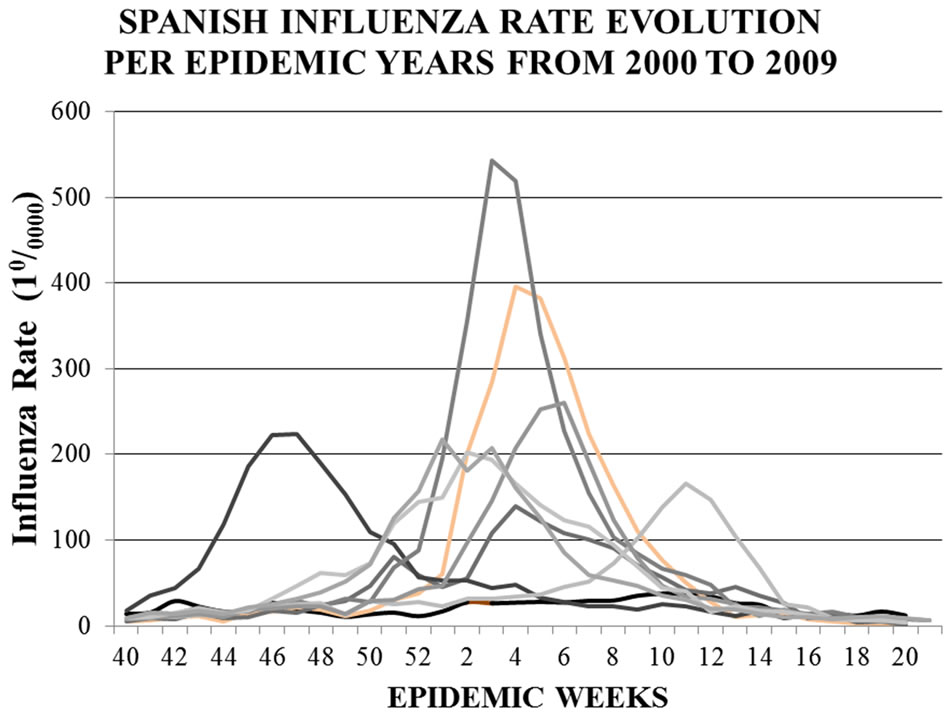
Figure 3. Influenza rate evolutions per epidemic year from 2000 to 2009. Each curve represents an epidemic year.
theless, these temporal windows in which flu rates increase are synchronic in relation to climatic domains. This means that being influenza rates very different, epidemics occur, more or less, simultaneously in the three different climatic domains as it can be seen in Figure 4.
One preliminary consideration that comes out from this graph is how different the average flu rates are depending on the climatic domain that is analyzed. Rate values were higher in the Atlantic domain than in the Continental or Mediterranean ones. The Continental rate was also higher than the Mediterranean one. The highest flu rates were registered in the Atlantic area, being 2001- 2002 and 2004-2005 two periods where influenza rates were over 800 and close to 700 respectively.
The Continental domain rate was also very relevant in 2004-2005 and other epidemic years. The Mediterranean domain is the geographic extent with lowest values.
This preliminary consideration is against traditional statistical approaches based exclusively on mathematical models that do not include the geographical location and the climatic domain in their inputs. Rate values differrences among climatic domains open a new door to the consideration of other aspect such as environmental issues, social and cultural factors to the complex problem of flu transmission.
4.2. Weather and Influenza
MCI has been estimated for each epidemic year. The analysis is focused on the spreading periods of those epidemics years that were more relevant. Table 1 presents MCI parameters for the period 2001-2002. MCI values on week 45 had a clear impact on reversing a negative flu rate increment on week the before to positive numbers. In this sense, weeks 51, 52 and 1 reproduce the same process promoting a progressive increment of flu rates. Lower MCI values on weeks 2 and 3
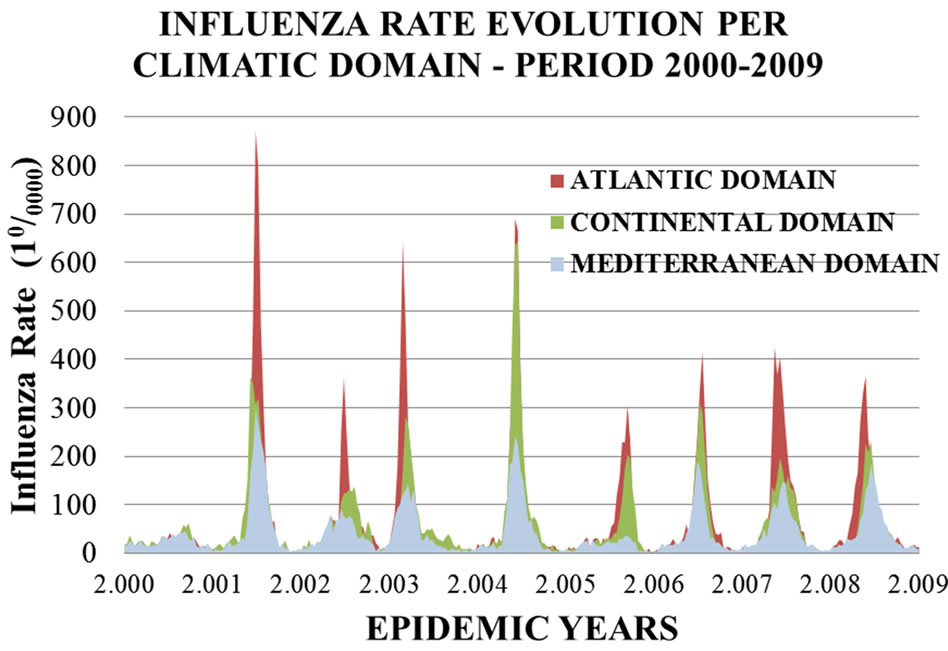
Figure 4. Influenza rate evolution per climatic domains in Spain between years 2000 and 2009.
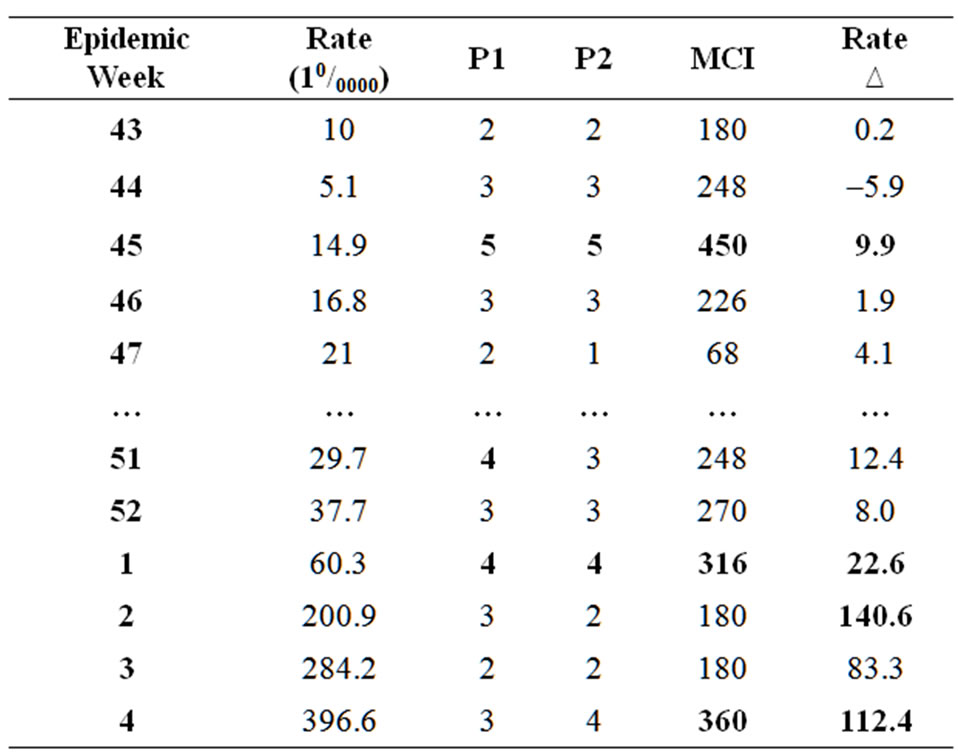
Table 1. Influenza rates, MCI parameters and rate increment per epidemiologic weeks. Period 2001-2002.
were not able to stop the expansion of the epidemic that reached the highest rate on week 4. In this case atomspheric contrast acted as a trigger of the epidemic.
The sequence of circulation types at 12:00 GMT on week 45 was SSE; E; A; NNW; NNE; E; with a very high diversity of atmospheric circulation types in one epidemic week. It will be similar on week 1 when the sequence was different (SSE; E; A; NNW; NNE; E) but MCI values were also relevant.
In the 2004-2005 epidemic, Table 2, the highest value of MCI for the whole period took place on week 52. In this particular case, outbreaks (P2) in the weekly sequence were more relevant than diversity (P1) of types. It also important to mention that this week was preceded by several weeks in which MCI parameters were also very high. Since week 48, there was a progressive increment on diversity of types of circulation (P1) and, two weeks later, in the number of weekly outbreaks (P2) being the expansion of the epidemic very related to all these issues.
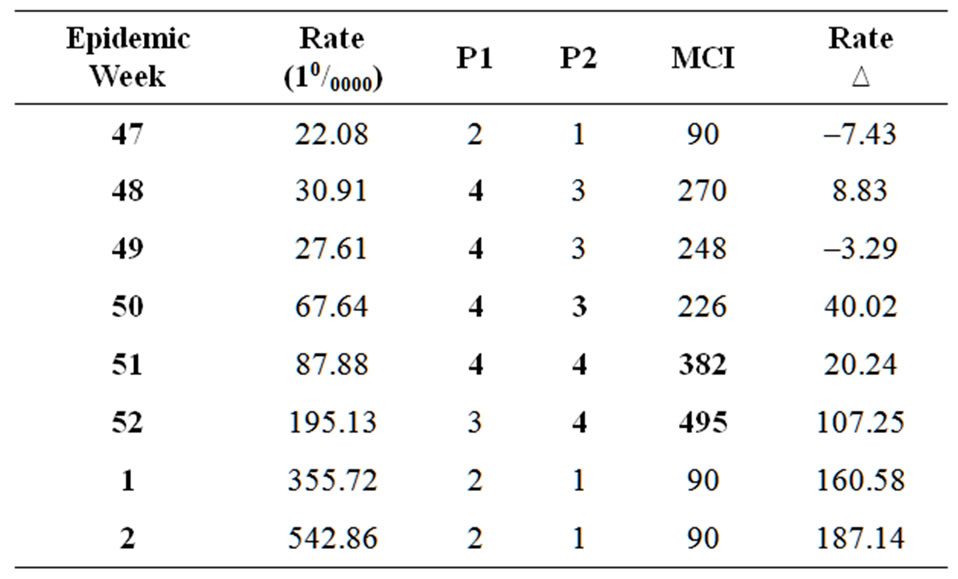
Table 2. Influenza rates, MCI parameters and rate increment per epidemiologic weeks. Period 2004-2005.
P1 and P2 values show a progressive increase in what clearly contributes to the expansion of the flu rate in this epidemic year. High MCI values were also registered weeks after the maximum peak without impacting on flu rates. This can be explained from an epidemiological point of view. Once the peak is reached on an influenza epidemic, the probability of having new peaks with the same virus is very limited.
Finally, a new examle is given in Table 3. In this cases we look at one temporal period cahracterisized by very low flu activity such as 2005-2006. At this point, it must be said that national average flu rate in this period was no higher than 1660/0000 in week 11 and this is far from maximum national average flu rates in the periods previously analysed, with values over 396.60/0000 and 4950/0000, even much different if it is compared specifically, to the average rates in the Atlantic domain where values of 872.80/0000 and 690.40/0000 were reached. During 2005-2006 period virus A (60%) and B (40%) circulated simultaneously in Spain while in the 2004-2005 and 2001-2002, leading viruses were A(H3N2) and A(H1N2) respectively.
5. CONCLUSIONS
The analysis of Spanish influenza rates per climatic domains confirms the existence of clear interactions between climatic factors and influenza epidemics. This first outcome gives an enormous value to the inclusion of meteorological in the statistical models that are used to forecast the outbreaks and temporal evolution of influenza epidemics.
Crowding because of autumn and winter low temperatures has been a traditional explanation to the expansion of the epidemics. Nevertheless, this is not acceptable in Spain where very cold climatic area such as the Continental domain registered periodically lower rates than those with more temperate weather in the Atlantic domain. In this sense crowding should be also linked to rainfall as much as to low temperatures because rain is
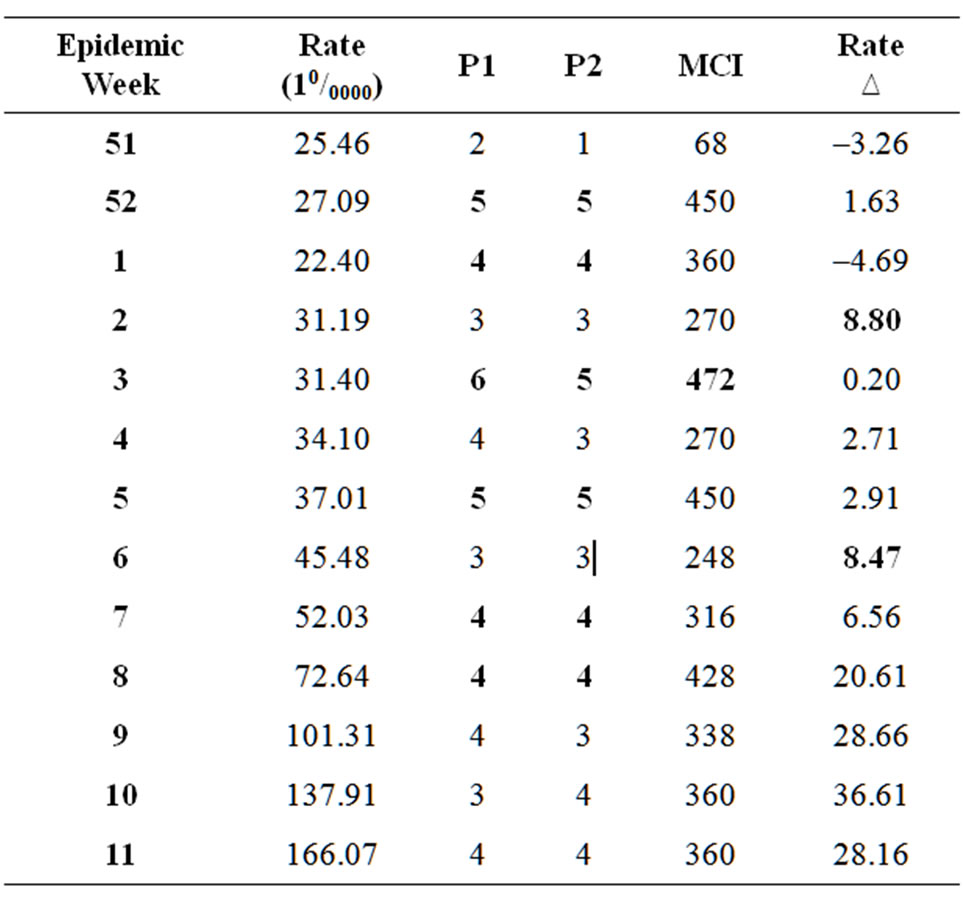
Table 3. Influenza rates, MCI parameters and rate increment per epidemiologic weeks. Period 2005-2006.
more relevant in the Spanish Atlantic domain than in the Continental one. Crowding can also be a consequence of rainfall. From a climatological point of view, rainfall persistence is a characteristic in the Atlantic domain and it very related to the dark-light cycle which is connected to many physiological processes that affect our immune system through melatonin and vitamin D.
Under this new conceptual umbrella, rate differences between the Spanish climatic domains can be explained and the original hypothesis related to the impact of climate variability and contrast on humans immune system becomes object of further research.
MCI high values can happened at any time during the epidemic periods and this not allways implies an outbreaks of the epidemic but it is relevant that a high meteorological contrast index can affect the probability of taking place influenza outbreaks.
New approaches to the study of influenza in the environmental dimension are being developed working with datasets from specific weather station at a very high temporal resolution and detailed flu rates at specific locations, in the three Spanish climatic domains. The final aim of this approach to the problem of influenza is the development of a health warning systems based on biometeorological forecasting that can help to counteract the sanitary impacts of this infectious disease in the near future.
6. ACKNOWLEDGEMENTS
We would like to thank to the Spanish Minister of Science and Innovation for the economic support given to carry out the present research through the research program CSO2010-16432 and to the Spanish Influenza Sentinel Network, the Spanish National Center of Epidemiology and to the Health Institute Carlos III by the prolific collaboration they have offered in this study.
REFERENCES
- http://www.etymonline.com/
- http://dictionary.reference.com
- Lofgren, E., Fefferman, N.H., Naumov, Y.N., Gorski, J. and Naumova, E.N. (2007) Influenza seasonality: Undelying causes and modeling theories. Journal of Virology, 81, 5429-5436. doi:10.1128/JVI.01680-06
- Dowell, S.F. (2001) Seasonal variation in host susceptibility and cycles of certain infectious diseases. Emerging Infectious Diseases, 7, 369-374.
- Beck, M.A., Handy J. and Levander, O.A. (2004) Host nutritional status: The neglected virulence factor. Trends in Microbiology, 12, 417-423.
- Epstein, P.R. (2001) Climate change and emerging infectious diseases. Microbes and Infection, 3, 747-754. doi:10.1016/j.bbr.2011.03.031
- McGregor, G.R. (2011) Human biometeorology. Progress in Physical Geography, 1-17. doi:10.1177/0309133311417942
- Burton, I., Ebi, K.L. and McGregor, G.R. (2009) Biometeorology for adaptation to climate variability and change. Biometeorology, 1, 1-5.
- Metz, B., Davidson, O.R., Bosch, P.R., Dave, R. and Meyer, L.A. IPCC Fourth Assessment Report. Cambridge University Press, Cambridge, UK and New York, USA.
- Lowen, A.C., Mubareka, S., Tumpey, T.M., Garcia S.A.J. and Palese, P. (2006) The guinea pig as a transmission model for human viruses. Proceedings of the National Academy of Science, 103, 9988-9992. doi:10.1073/pnas.0604157103
- Fdez-Arroyabe, P. (2004) Climate, weather and flu diagnoses incidence in the region of Santander (Northern Spain) during the 1999-2000 epidemic diffusion period. Aerobiologia, 20, 223-228. doi:10.1007/s10453-004-1186-z
- Rasilla, D. (2000) Synoptic scale circulation conditions over the Iberian Peninsula during extreme NAO phases. Chapman Conference on NAO, Orense.