Health
Vol. 4 No. 3 (2012) , Article ID: 18329 , 4 pages DOI:10.4236/health.2012.43021
Causal relationships between physical, mental and social health-related factors among the Japanese elderly: A chronological study
![]()
1Graduate School of Medicine, Juntendo University, Tokyo, Japan; *Corresponding Author: moyuasa@juntendo.ac.jp
2Graduate School of Urban System Science, Tokyo Metropolitan University, Tokyo, Japan
3Graduate School of Nursing, Keio University, Kanagawa, Japan
4Graduate School of Nursing, Ibaraki Christian University, Ibaraki, Japan
5School of Nursing, Tokyo Jikeikai Medical College, Tokyo, Japan
Received 23 December 2011; revised 16 January 2012; accepted 3 February 2012
Keywords: Physical Health; Mental Health; Social Health; Elderly; Japan
ABSTRACT
The World Health Organization defines health as a state of physical, mental and social well being. This study was conducted to explore chronological relationships between physical, mental and social factors. Among urban-dwelling elderly aged 65 years and over, data were collected via a self-report questionnaire in 2001 and 2004. The three health-related latent factors were identified with nine measurement variables by an exploratory factor analysis. A structural equation modeling method was used to analyze underlying relationships among the three factors with a cross-lagged model and a synchronous model. A total of 7683 individuals aged between 65 and 84 years were analyzed. The three-year prior and current physical health significantly affected social health as well as mental health, and this effect appeared to be stronger in males compared to females. Maintenance of physical health may be crucial to support mental and social health among elderly individuals.
1. INTRODUCTION
The word “health” is derived from the Old English word “hoelth”, which meant a state of being sound and was generally used to infer a soundness of the body [1]. The most commonly cited definition of health is one accepted by the World Health Organization (WHO): health is a state of complete physical, mental and social well being and not merely the absence of disease or infirmity (International Health Conference, 1946). To date, however, this definition has been criticized for being utopian, inflexible and unrealistic [2]. Saracci [3] also criticized it, concluding that the state of health the WHO formalized corresponds much more closely to happiness than to health. Bircher [4] asserted that the unlimited, idealistic aspect of the WHO definition does not provide an operational definition relevant to the health care system. Instead, he redefined health as being a dynamic state of well being characterized by a physical, mental and social potential, which satisfies the demands of a life commensurate with age, culture, and personal responsibility. If the potential is insufficient to satisfy these demands, the state is disease. Nevertheless, these authors highly appreciated that the WHO definition represented a major advance by widening health to the mental and social dimensions [3,4]. These three components of health are now commonly embraced worldwide.
A number of previous studies have investigated the relationship between mortality and/or survival among elderly individuals and physical health [5-7], mental health [8,9] and social health [10,11]. As such, each of the aforementioned three aspects of health has been well examined and found to associate with various other health outcomes. However, there have been few detailed studies that objectively and systematically assessed overall health across these three aspects. It is acknowledged that we should recognize chronological relationships between the three health aspects in order to comprehend the quality of life and overall health of the elderly across time. Thus, via structural equation modeling methods using longitudinal data from elderly Japanese individuals, we investigated causal relationships among these three primary health factors.
2. METHODS
2.1. Study Setting and Subjects
This prospective cohort study was initiated in September 2001 and implemented a questionnaire survey for elderly individuals aged 65 years and over who were home-dwellers in urban areas in the suburb of metropolitan Tokyo, Japan. The study setting had a population of approximately 140,000 as of 2001 with 9.6% of the individuals aged 65 years and older among the total population. This percentage of elderly individuals was smaller compared to the national average of 17.3% in 2000. Of 16,462 eligible people, we obtained responses from 13,195 elderly individuals. They returned by mail the self-administered questionnaire attached with a written informed consent form that expressed their intention to participate in the study. In September 2004, the second set of questionnaires with the same contents as the 2001 survey were mailed to the subjects who responded to the 2001 survey. A total of 8558 subjects answered, whereas 505 had moved, 914 had died and 3218 did not respond. We followed up all of the participants until August 31, 2007, and ultimately collected individual data, deceased or living, for a total of 8162 subjects through the municipal residents registry.
2.2. Measurement Variables
To estimate a chronological relationship among the three latent factors of physical, mental and social health, we defined the factors using observed variables obtained in the 2001 survey via an exploratory factor analysis. This was performed to fit the observed variables to the corresponding latent factors with maximum likelihood in a Promax oblique rotation using IBM SPSS Statistics 20 for Windows (IBM Inc., New York, USA). As Table 1 shows, all of the observed variables were categorized into three factors.
Factor 1 was labeled a “mental health-related factor” and consisted of three variables including self-rated health, self-rated health compared to the previous year and life satisfaction. Self-rated health was assessed on a four-point Likert scale to determine perceived overall health with the question: “In general, how would you say your health is?” The answer was selected from the following options: very poor, poor, fair and excellent [12, 13]. The score ranged from 1 to 4 in the same respective order, such that higher scores indicated a greater perceived health. If not known, subjects received a score of zero. Self-rated health compared to the previous year was determined on a three-point Likert-scale using the following question: “How is your current health compared to your health last year?” The respondents chose one answer among the following: poorer, may or may not be better and better. The score ranged from 1 to 3 in the

Table 1. Exploratory factor analysis of observed variables from the 2001 survey.
same respective order and if no answer was given, respondents received a score of zero. We measured life satisfaction by inquiring: “Are you satisfied in your current daily life?” The respondents answered from: not satisfied, may or may not be satisfied and satisfied, and respondents scored from 1 to 3 in this order with a score of zero being assigned in the case of no answer.
Factor 2 was identified as a “physical health-related factor” and was measured by three variables: instrumental activities of daily living (IADL), basic activities of daily living (BADL) and the number of comorbidities. The IADL score was assessed using the following five questions based on activity competence: “Can you buy daily necessities by yourself?”; “Can you cook daily meals by yourself?”; “Can you deposit and withdraw money at your bank?”; “Can you fill out a document related to insurance or a pension?”; “Can you read books and newspapers?” [14]. If they could perform these functions, they obtained one point, and otherwise no points. Total scores ranged from 0 to 5 with a higher score indicating better instrumental activity. The BADL score was estimated through the following three questions: “Can you go to the bathroom by yourself?”; “Can you take a bath by yourself?”; “Can you take a walk outside?” [15, 16]. As the BADL was scored in the same fashion as the IADL, scores ranged from 0 to 3 with a higher score indicating a greater level of basic activity competence. The number of comorbidities was determined by asking the subjects to “Choose the diagnosed diseases for which you are currently treated”. We identified four diseases, including cerebrovascular disease, cardiovascular disease, hepatic disease and diabetes mellitus, which had a statistically significant and negative association with the number of survival days of the subjects between September 2004 and August 2007 [17]. We then defined the extent of comorbidity as the number of diseases with which the subjects were diagnosed among the four diseases. We categorized the number of comorbidities into the physical factor in accordance with our previous study [18] despite the poor fit according to the results of our factor analysis (Table 1).
Factor 3 was termed a “social health-related factor” and included the observed variables of communi-cation with neighborhood, hobby-related activities and frequency of going out. Communication with the neighborhood was assessed by the following question: “How often do you communicate with your friends or neighborhood?” The choices were: seldom, once per month, 3 to 4 times a week and almost everyday. The scores ranged from 1 to 4 in the same respective order and zero if the answer was not known. Hobby-related activities were determined by inquiring “Do you participate in hobby-related activities?” with a binary answer format: yes or no. One point was given to individuals with no hobbies, two points for individuals with hobbies, and zero points for subjects providing no answer. The frequency of going out was measured by the question “How often do you go outside, including around your neighborhood?” The following answers were given: less than once per month; more than once per month; more than 3 to 4 times a week. Scores obtained ranged from 1 to 3 in the same respective order. When the answer was not known, subjects received a score of zero.
We obtained the subjects’ socio-demographic information including age, gender, educational attainment and annual income. Educational levels were categorized into four groups: graduation from junior high school, graduation from high school, those achieving a higher educational level than college and those who did not want to respond. Annual income in 2001 was assessed according to four categories: less than one million Japanese yen (equivalent to less than US $13,000), less than three million yen, less than seven million yen and more than seven million yen. We also examined the subjects’ degree of required long-term care in 2001. The degree was measured using a public assessment tool devised by the Japanese Ministry of Health, Labor and Welfare [19]. The tool categorizes elderly health conditions into six levels ranging from the mildest degree (requiring slight support) to the most severe degree (requiring comprehensive care).
2.3. Statistical Analyses
The subjects aged 85 years and older and requiring more than the middle degree of long-term care in the 2001 survey were excluded from the analysis due to a large deviation in their individual measurement variables. In the analyses, we divided all data into two groups across both genders: an early-elderly age group aged between 65 and 74 years (termed an early-elderly group), and a late-elderly age group aged between 75 and 84 years (termed a late-elderly group).
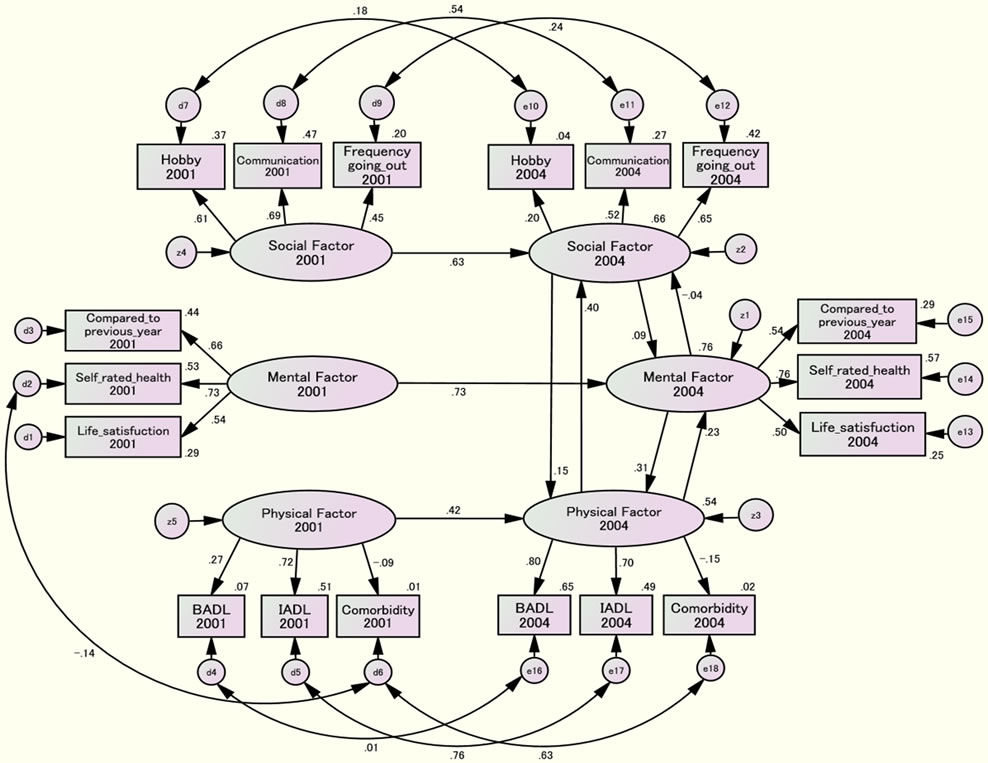
A structural equation modeling (SEM) method was used to analyze the underlying chronological relationships between the three health-related latent factors by Amos ver.19 for Windows (IBM Inc.). In order to analyze causal relationships, we introduced a cross-lagged effect model as well as a synchronous model [20]. If an earlier level of a predictor variable is associated with a later variable, we have evidence to infer that the predictor variable exerts a causal influence on the criterion. Therefore, we hypothesized that each of the health-related factors measured in the 2001 survey may have an effect on the identical corresponding health-related factor measured in the 2004 survey. In the cross-lagged effects model, each factor in the 2001 survey may have an effect on a factor in the 2004 survey other than a corresponding factor (for example, a physical factor in 2001 may have an effect on a social and/or mental factor in 2004 as well as a physical factor in 2004) (Figure 1). In the synchronous effect model, each factor in 2004 may have an effect on the other two factors in 2004 (e.g., a physical factor in 2001 may not affect a social or mental factor in 2004 but a physical factor in 2004 may affect a social and/or mental factor in 2004) (Figure 2).
Estimation of the best-fitting model was performed by a maximum likelihood method using the SEM. The optimization algorithm was implemented with missing data. Standardized effects among different latent factors were calculated by gender and age group. Goodness-of-fit of the models was assessed by Chi-square, Normed Fit Index (NFI), Comparative Fit Index (CFI) and Root Mean Square Error of Approximation (RMSEA). Values of RMSEA less than 0.05 imply a goodness-of-fit, while in the other indices values greater than 0.80 represent a good fit. Results were regarded as statistically significant if the p value was less than 0.05.
2.4. Ethical Approval
All subjects provided written informed consent by mail via the returned questionnaire. We agreed with the municipal administration bureau of the study site on the confidentiality of the subjects’ personal data. The present study protocol was also approved by the ethical committee of Tokyo Metropolitan University.
3. RESULTS
In the final analyses, a total of 7,683 subjects (male: 3671, female: 4012) were included. Table 2 indicates the socio-demographics of the subjects by gender and age group. A majority of the subjects were assigned as requiring no degree of long-term care. Gender (male) and age (younger subjects) were associated with greater educational attainment and higher income.

CMIN =5726.123 NFI = .822 CFI = .834 RMSEA = .038
Figure 1. Cross-lagged effects model of the early-elderly male group.
CMIN=5547.610 NFI= .827 CFI= .840 RMSEA= .037
Figure 2. Synchronous effects model of the late-elderly female group.
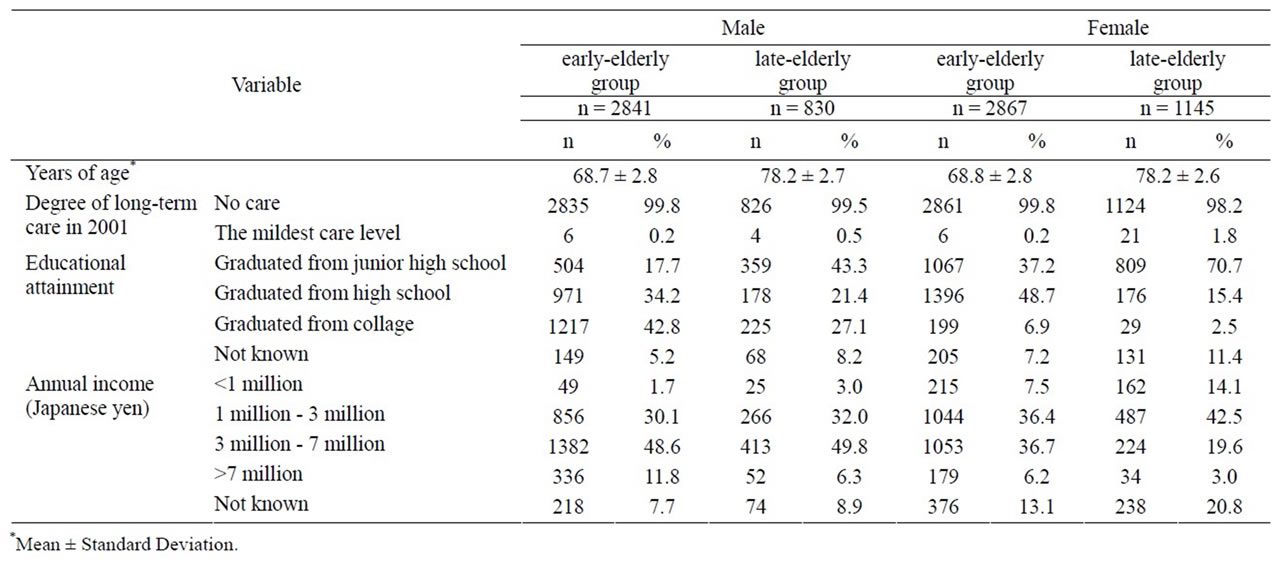
Table 2. Socio-demographics of the subjects by gender and age group.
Tables 3 and 4 show the distributions of subject variables in 2001 and 2004 for males and females, respectively. To compare each of variables between 2001 and 2004, the paried-Wilcoxon signed rank test was conducted among an early-elderly and a late-elderly age group in both gender, respectively. Perceived health self-ratings of “fair” decreased from 2001 to 2004, with all other ratings increasing for both genders. It is especially of note that both genders increased their health rating of “excellent” from 2001 to 2004 in both age groups. However, there was no statistically significant difference between 2001 and 2004 in the late-elderly age groups of both genders. Compared to the previous year, perceived health selfratings of being “better” decreased and of being “poorer” increased from 2001 to 2004 in both genders. In particular, the proportion of being “better” among both male age groups decreased from 2001 to 2004 more so than in females. Life satisfaction dropped during the survey period among all groups. IADL and BADL (representing physical factors) likely shifted from higher active levels to lower levels between 2001 and 2004 in both gender groups. The number of comorbidities was higher in the late-elderly age group versus the early-elderly group in both genders. Compared to females, males were more likely to have less communication with their neighborhood. More than half of the male subjects reported limited communication with their neighbors. Both genders displayed an increase in participating in hobby-related activities during the survey period, but these cannot be directly compared due to the fact that the 2004 survey did not include a choice of responding “I do not know”. The incidence of going out more than 3 to 4 times a week dropped from 2001 to 2004 among all age and gender groups.
From the results of SEM analyses, Figures 1 and 2 represent the final example models of the cross-lagged effect for the early-elderly male group and the synchronous effect for the late-elderly female group, respectively. The cross-lagged effect models for all gender and age groups indicated significant correlations between corresponding factors at the 2001 and 2004 survey (data not shown). The synchronous effect model also demonstrated that the three health-related factors in the 2001 survey significantly predicted the identical corresponding latent factors in the 2004 survey with high standard effect coefficients between these time points (data not shown).
Table 5 shows the findings of the cross-lagged effect relationships between the three health-related factors, including significant chronological relationships with standard effect coefficients greater than 0.3. In all of the groups except the early-elderly females, we observed significant predictive effects from the physical factor in 2001 to the social factor in 2004 as well as from the physical factor in 2001 to the mental factor in 2004. The physical effects seemed to be more strongly predictive of the social factor than the mental factor. The synchronous effect models also revealed that the physical factor in 2004 significantly predicted the social factor in 2004 among all gender and age groups (Table 6). In particular, a bidirectional relationship between the physical and social factor was detected among the late-elderly male group. In the late-elderly female group, a mental effect on the physical factor was observed (β = 0.313, p < 0.001) (Figure 2). The above physical effects on the social factor were deemed to be stronger in males than females. Otherwise, the causal effects of the mental factor on the social factor, and vice versa, were tenuous, regardless of their being statistically significant due to the large sample size (data not shown).
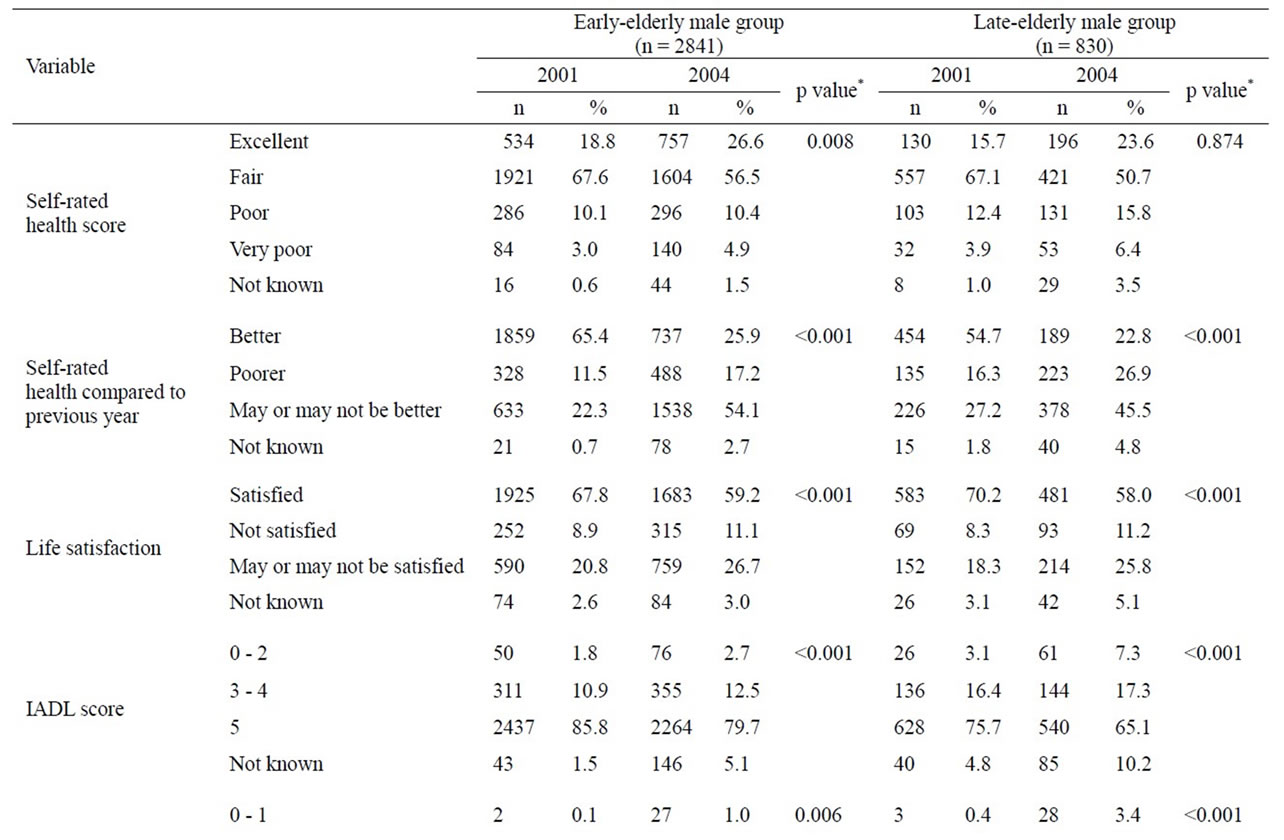
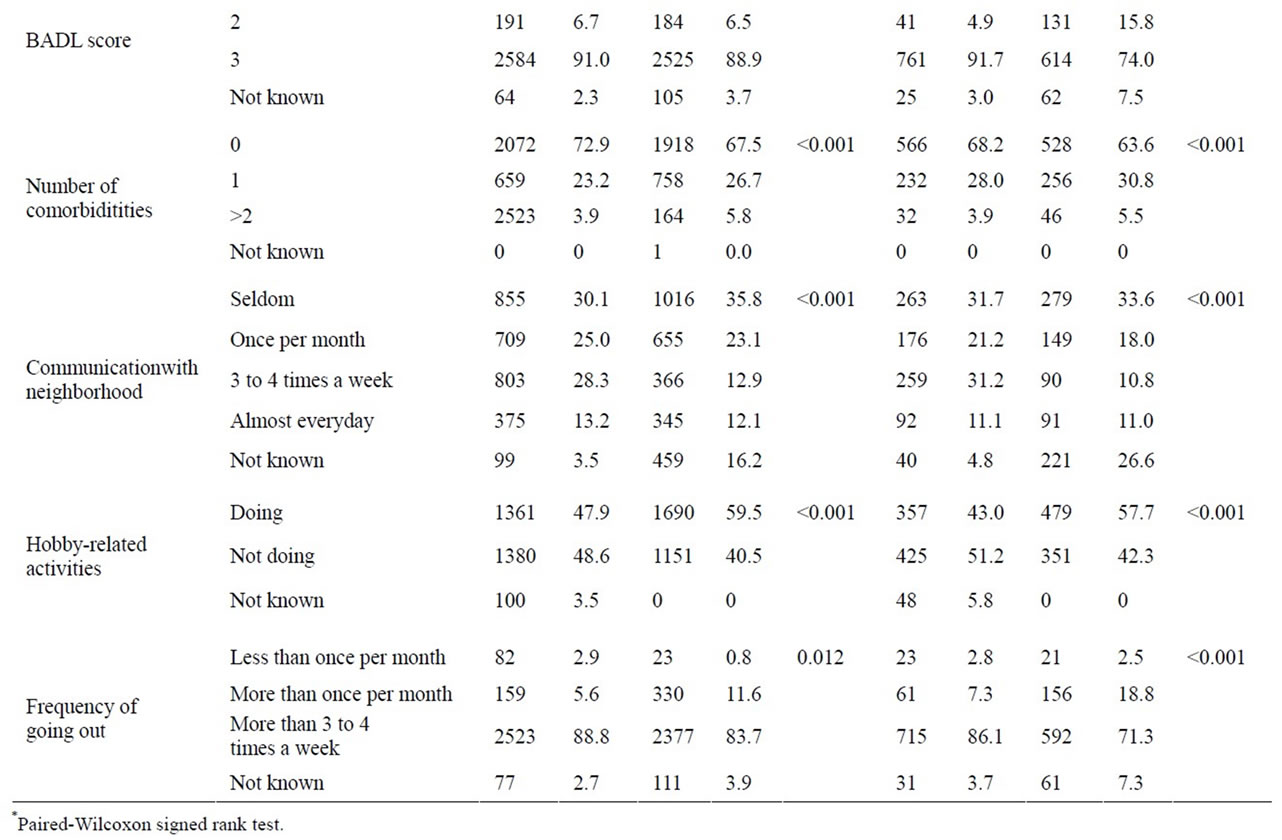
Table 3. Variables for male subjects in 2001 and 2004 by age group.

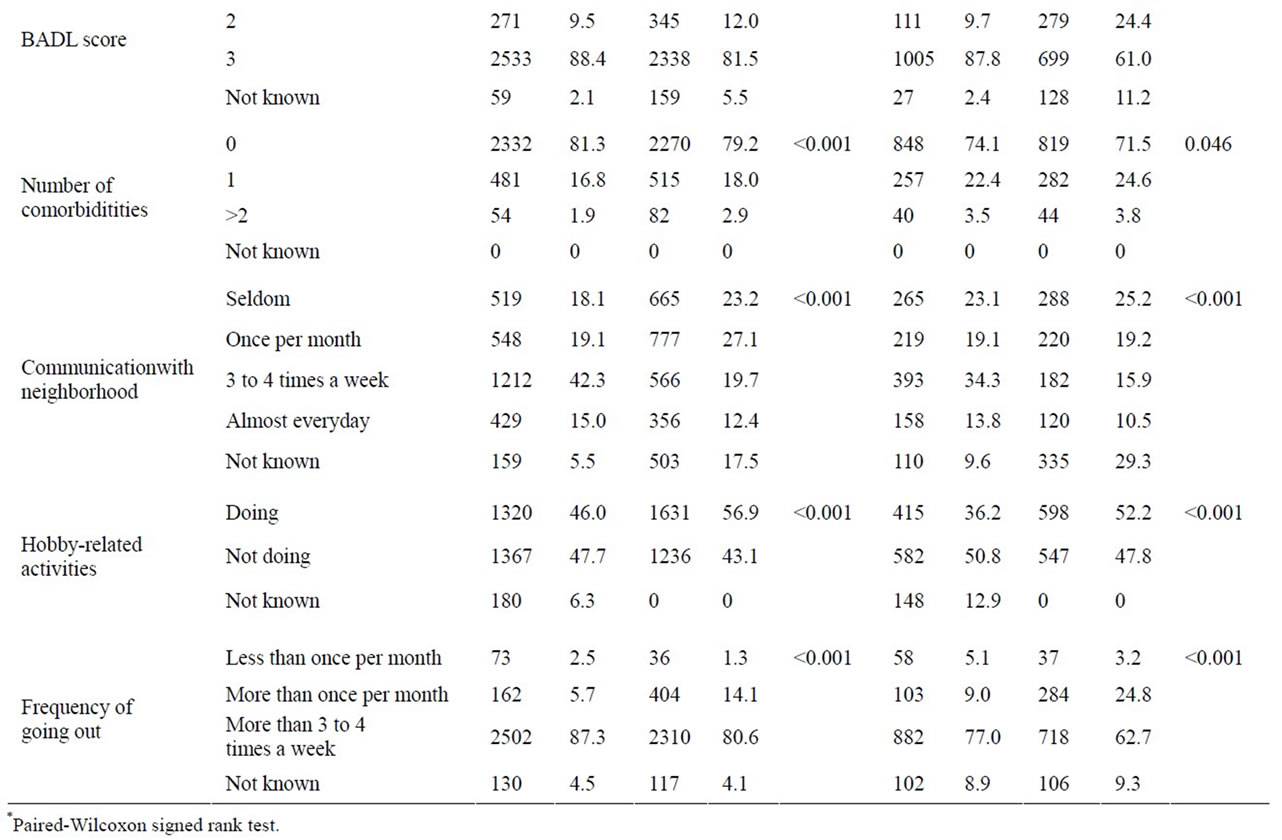
Table 4. Variables for female subjects in 2001 and 2004 by age group.

Table 5. Causal relationships between significant factors in the cross-lagged effects model.

Table 6. Causal relationships between significant factors in the synchro-nous effects model.
4. DISCUSSION
The present study revealed that three-year-prior health related factors such as physical, mental and social health significantly predicted current corresponding health-related factors. In particular, as shown in the cross-lagged model as well as the synchronous model, the three-year prior and current physical health considerably affected subjects’ social health across both genders. Such findings were likely stronger in elderly male individuals compared to females. The three-year prior and current physical health also possibly influenced the mental health factor. However, mutually causal relationships between social and mental factors may be minor, and these factors had little effect on the physical factor among the elderly participants in this study. In other words, the findings may indicate that the elderly are able to remain in an overall healthy state primarily based on their physical condition alone, which confers a high activity competence in daily life with a paucity of disease, or it may indicate that they maintain a heightened psychological well being and active connections with society on the basis of being in good physical condition. In this regard, our results were not surprising. It is granted that those whose physical condition is poor may be limited in any social interactions and may be prone to suffer from mental disorders. However, it is meaningful that our study verified the chronological relationship between the three health-related factors using a large sample size and longitudinal data. It is also interesting that there were only minor relationships between mental and social factors.
Previous studies revealed significant associations of physical health with mental and social health-related conditions among the elderly [21-25]. For example, Ratner et al. [26] indicated that physical health alone accounted for 55.1% of the variance in self-rated health status and that psychological and social determinants did not have a significant impact on self-rated health. However, it is difficult to compare our study with these reports since different definitions and diverse indices of the three health-related factors were used. Moreover, the results between studies could be inconsistent due to the use of different categories related to subject ages [27], gender disparities [28] and racial differences [29]. Our study included only Japanese subjects and analyzed data divided by both gender and by commonly used age groupings, including an earlyand a late-elderly group in order to account for such factors.
The strength of our study was the inclusion of a large sample size from the cohort survey tracked over six years, and the collection of data with a high response rate (80.2% in the 2001 survey, 64.9% in the 2004 survey), implying highly desirable coverage in such a population-based research study.
This study does suffer from some limitations. Although our analysis was performed to control for gender and age of the subjects, the models were not adjusted for other basic characteristics such as education and income. Neri et al. [30] reported that family income confounded the association between physical and psychological factors. Thus, we carried out the SEM analysis using stratified samples including only those with the lowest (less than a million yen) and the highest (7 million yen and over) annual income as well as the lowest (graduation from junior high school) and the highest (graduation from college) educational attainment. However, we observed results similar to those reported above, except for some models that were not fixed due to restricted sample size (data not shown). Owing to the high recruitment rate covering 80% of those potential eligible in the first survey, we presumed a relatively high internal validity for our reported results. Nevertheless, selection bias may exist in our survey, which may result in disputable external validity. Van Heuvelen et al. [31] addressed a volunteer bias in which physical functioning subscores (like BADL and IADL) are likely higher if the subjects are recruited from voluntary participants. In addition, we did not randomly chose the research setting which, as a result, had a lower elderly population rate and a considerably higher social status with higher income and greater educational attainment compared to the national average. Moreover, we conducted the selection of observed variables based on our previous studies [17,18], but the nine observed variables indicating the three health-related factors may not represent an exhaustive list of factors impacting health as defined by the WHO. In particular, it is necessary to further speculate on which social and mental determinants of health are important. The study also has a fundamental limitation in terms of a restriction to self-assessed measurements to examine the three healthrelated factors [32].
In conclusion, our study suggests that the maintenance of physical health may be particularly crucial in impacting the mental and social health of elderly populations, both male and female. Further research is needed including the study of other, more wide-ranging measurement variables representing the three related aspects of health.
5. ACKNOWLEDGEMENTS
We express a special gratitude to all the participants of Tama city. The study was funded by the grant of Japanese Ministry of Health, Labor and Welfare (H10-Health-042), and the Grant-in-Aid for Scientific Research (B) from Japanese Ministry of Education, Culture, Sports, Science and Technology (No. 1531012 & 14350327). We also thank for the financial support from the Mitsubishi Foundation (2009-21).
![]()
![]()
REFERENCES
- Dolfman, M.L. (1973) The concept of health: An historic and analytic examination. Journal of School Health, 43, 491-497. doi:10.1111/j.1746-1561.1973.tb03740.x
- Breslow, L. (1972) A quantitative approach to the World Health Organization definition of health: Physical, mental and social well-being. International Journal of Epidemiology, 1, 347-355. doi:10.1093/ije/1.4.347
- Saracci, R. (1997) The World Health Organisation needs to reconsider its definition of health. British Medical Journal (BMJ), 314, 1409-1410. doi:10.1136/bmj.314.7091.1409
- Bircher, J. (2005) Towards a dynamic definition of health and disease. Medicine, Healthcare & Philosophy, 8, 335- 341. doi:10.1007/s11019-005-0538-y
- Liu, X., Liang, J., Muramatsu, N. and Sugisawa, H. (1995) Transitions in functional status and active life expectancy among older people in Japan. The Journals of Gerontology: Series B, 50, S383-394. doi:10.1093/geronb/50B.6.S383
- Stessman, J., Hammerman-Rozenberg, R., Cohen, A., EinMor, E. and Jacobs, J.M. (2009) Physical activity, function, and longevity among the very old. Archives of Internal Medicine, 169, 1476-1483. doi:10.1001/archinternmed.2009.248
- Yates, L.B., Djousse, L., Kurth, T., Buring, J.E. and Gaziano, J.M. (2008) Exceptional longevity in men: Modifiable factors associated with survival and function to age 90 years. Archives of Internal Medicine, 168, 284-290. doi:10.1001/archinternmed.2007.77
- Kaplan, G.A., Goldberg, D.E., Everson, S.A., Cohen, R.D., Salonen, R., Tuomilehto, J. and Salonen, J. (1996) Perceived health status and morbidity and mortality: Evidence from the Kuopio ischaemic heart disease risk factor study. International Journal of Epidemiology, 25, 259- 265. doi:10.1093/ije/25.2.259
- Spiers, N., Jagger, C., Clarke, M. and Arthur, A. (2003) Are gender differences in the relationship between selfrated health and mortality enduring? Results from three birth cohorts in Melton Mowbray, United Kingdom. Gerontologist, 43, 406-411. doi:10.1093/geront/43.3.406
- Ichida, Y., Kondo, K., Hirai, H., Hanibuchi, T., Yoshikawa, G. and Murata, C. (2009) Social capital, income inequality and self-rated health in Chita peninsula, Japan: A multilevel analysis of older people in 25 communities. Social Science & Medicine, 69, 489-499. doi:10.1016/j.socscimed.2009.05.006
- Sugisawa, H., Liang, J. and Liu, X. (1994) Social networks, social support, and mortality among older people in Japan. Journals of Gerontology, 49, S3-13.
- Blazer, D.G. and Houpt, J.L. (1979) Perception of poor health in the healthy older adult. Journal of the American Geriatrics Society, 27, 330-334.
- Perruccio, A.V., Badley, E.M., Hogg-Johnson, S. and Davis, A.M. (2010) Characterizing self-rated health during a period of changing health status. Social Science & Medicine, 71, 1636-1643. doi:10.1016/j.socscimed.2010.07.042
- Koyano, W., Shibata, H., Nakazato, K., Haga, H. and Suyama, Y. (1991) Measurement of competence: Reliability and validity of the TMIG Index of Competence. Archives of Gerontology and Geriatrics, 13, 103-116. doi:10.1016/0167-4943(91)90053-S
- Branch, L.G., Katz, S., Kniepmann, K. and Papsidero, J.A. (1984) A prospective study of functional status among community elders. American Journal of Public Health, 74, 266-268. doi:10.2105/AJPH.74.3.266
- Katz, S., Ford, A.B., Moskowitz, R.W., Jackson, B.A. and Jaffe, M.W. (1963) Studies of illness in the aged. The index of ADL: A standardized measure of biological and psychological function. Journal of the American Medical Association (JAMA), 185, 914-919. doi:10.1001/jama.1963.03060120024016
- Hoshi, T., Ryu, S. and Fujiwara, Y. (2007) Urban health and determinant factors for longer life for the elderly urban dwellers in Tokyo. Proceedings of the International Symposium on Sustainable Urban Environment, 1, 61-66.
- Hoshi, T., Takagi, C., Bosako, Y., Nakayama, N., Yan, S., Kurimori, S., Hasegawa, T., Inoue, N., Yamamoto, C. and Takahashi, T. (2011) Chronological evaluation of physical, psychological and social health of urban elderly dwellers over 6 years and assessment of causal inter-relationships. Nihon Koshu Eisei Zasshi, 58, 491-500.
- Tsutsui, T. and Muramatsu, N. (2007) Japan’s universal long-term care system reform of 2005: Containing costs and realizing a vision. Journal of the American Geriatrics Society, 55, 1458-1463. doi:10.1111/j.1532-5415.2007.01281.x
- Finkel, E.S. (1995) Causal analysis with panel data. SAGE Publications, Inc., Thousand Oaks.
- Asakawa, T., Koyano, W., Ando, T. and Shibata, H. (2000) Effects of functional decline on quality of life among the Japanese elderly. International Journal of Aging and Human Development, 50, 319-328. doi:10.2190/3TR1-4V6R-MA5M-U1BV
- Dorgo, S., Robinson, K.M. and Bader, J. (2009) The effectiveness of a peer-mentored older adult fitness program on perceived physical, mental, and social function. Journal of the American Academy of Nurse Practitioners, 21, 116-122. doi:10.1111/j.1745-7599.2008.00393.x
- Dungan, J.M., Brown, A.V. and Ramsey, M.A. (1996) Health maintenance for the independent frail older adult: Can it improve physical and mental well-being? Journal of Advanced Nursing, 23, 1185-1193. doi:10.1046/j.1365-2648.1996.12016.x
- Fox, K.R., Stathi, A., McKenna, J. and Davis, M.G. (2007) Physical activity and mental well-being in older people participating in the Better Ageing Project. European Journal of Applied Physiology, 100, 591-602. doi:10.1007/s00421-007-0392-0
- Jang, Y., Bergman, E., Schonfeld, L. and Molinari, V. (2007) The mediating role of health perceptions in the relation between physical and mental health: A study of older residents in assisted living facilities. Journal of Aging Health, 19, 439-452. doi:10.1177/0898264307300969
- Ratner, P.A., Johnson, J.L. and Jeffery, B. (1998) Examining emotional, physical, social, and spiritual health as determinants of self-rated health status. American Journal of Health Promotion, 12, 275-282. doi:10.4278/0890-1171-12.4.275
- Stafford, M., McMunn, A., Zaninotto, P. and Nazroo, J. (2011) Positive and negative exchanges in social relationships as predictors of depression: Evidence from the English longitudinal study of aging. Journal of Aging Health, 23, 607-628. doi:10.1177/0898264310392992
- De Souto Barreto, P., Ferrandez, A.M. and Guihard-Costa, A.M. (2011) Predictors of body satisfaction: Differences between older men and women’s perceptions of their body functioning and appearance. Journal of Aging Health, 23, 505-528. doi:10.1177/0898264310386370
- Boyington, J.E., Howard, D.L. and Holmes, D.N. (2008) Self-rated health, activities of daily living, and mobility limitations among black and white stroke survivors. Journal of Aging Health, 20, 920-939. doi:10.1177/0898264308324643
- Neri, A.L., Yassuda, M.S., Fortes-Burgos, A.C., Mantovani, E.P., Arbex, F.S., de Souza Torres, S.V., Perracini, M.R. and Guariento, M.E. (2012) Relationships between gender, age, family conditions, physical and mental health, and social isolation of elderly caregivers. International Psychogeriatric, 24, 472-483.
- Van Heuvelen, M.J., Hochstenbach, J.B., Brouwer, W.H., de Greef, M.H., Zijlstra, G.A., van Jaarsveld, E., Kempen, G.I., van Sonderen, E., Ormel, J. and Mulder, T. (2005) Differences between participants and non-participants in an RCT on physical activity and psychological interventions for older persons. Aging Clinical and Experimental Research, 17, 236-245.
- Smith, K.V. and Goldman, N. (2011) Measuring health status: Self-, interviewer, and physician reports of overall health. Journal of Aging Health, 23, 242-266. doi:10.1177/0898264310383421