Engineering
Vol.08 No.01(2016), Article ID:63113,11 pages
10.4236/eng.2016.81004
The Effect of the Industrial Activities on Air Pollution at Baiji and Its Surrounding Areas, Iraq
Salwan S. Al-Hasnawi1, Hussain M. Hussain2, Nadhir Al-Ansari3, Sven Knutsson3
1Chemistry Department, Collage of Science, Mustansirya University, Baghdad, Iraq
2Geology Department, Faculty Science, Kufa University, Kufa, Iraq
3Luleå University of Technology, Luleå, Sweden

Copyright © 2016 by authors and Scientific Research Publishing Inc.
This work is licensed under the Creative Commons Attribution International License (CC BY).
http://creativecommons.org/licenses/by/4.0/


Received 28 December 2015; accepted 25 January 2016; published 28 January 2016
ABSTRACT
The polluters of total suspended particles (TSP) and some heavy metals (Cd, Co, and Ni) concentrations were studied in the areas of Al-Fatha, Al-Alam and Baiji, Iraq. These concentrations were measured for selected 22 sample locations for two periods, January and July 2013. The analyzed values of (TSP) and (Cd) exceeded the limits of Iraqi National and the World Health Organization (WHO) for the two periods. Also, (Ni) values exceeded the limits for July only, while (Co) values were under the limits for the two periods. The difference between the two periods reflects the effect of the wind speed and direction, rainfall, and the intensity of the dust storms during the two months, respectively. GIS technique makes optimal predictions possible by examining the relationships between all the sample points and producing a continuous surface of polluter’s concentration. Therefore, GIS was used to produce predictions and probabilities maps for the critical polluter values in the study area.
Keywords:
Air Pollution, Pollution, GIS, Predictions Map, Iraq

1. Introduction
Dust is a primary cause of air pollution. Air pollution is usually caused by natural events and/or anthropogenic activities. Major man-made activities include automobiles, power generation and industrial activities in particular oil refineries, which represent the main source of air pollution. Prolonged exposure to inhalant dust can cause serious disease. Industrial activities will be more hazardous in highly populated areas (e.g. highly populated cities) [1] . Such activities have great impact on the ecology and agriculture as well as health and safety effects.
Dust is small enough (small volume ranges between 0.01 - 200 Microns), that can be carried away for long distance and cause soil degradation in case it contains heavy metals and air pollution. Small suspended solids particle (small volume ranges between 0.01 - 200 Microns), remain in air for a long period of time. For this reason, these particles increase the respiratory diseases, especially asthma, and may lead to lung tissue damage. Relatively bigger particles (Nuisance dust) settle down more rapidly due to their weight where air turbulence cannot sustain their presence in suspension for a long period of time. In addition to that smaller particles seem to interact with other air pollutants, leading to severe damages [2] - [5] . Suspended solids consist of suspended minerals and heavy metals. The source of the latter might be natural or artificial. Natural sources are usually caused be particles of soil and sediments that are transported by winds, while artificial sources include the industrial activities that emit heavy metals to the air and cause contamination of the atmosphere.
The most effective trace elements that can cause number of health problems are Pb, Zn, Cu, Ni, Cr, and Cd [3] . Iraq is well known as an oil exporter country where it produces 3.45 mb/d and domestically consumes 0.81 mb/d [6] and for this reason this industry is considered as the main source of pollution [4] .
In this research, air pollution was studied in the area between latitudes (34'56'' - 35'34'') and longitude (43'30'' - 43'34'') where a huge oil refinery exists. The area is within Salah Al-Dien Governorate (Figure 1). The main towns within this area are Al-Fatha, Al-Alam and Baiji with a population of more than 300000. It should be mentioned, however that [7] carried out a similar research on the same area where they analyzed heavy metals (Pb, Zn. and Cr). In this research (Cd, Co, and Ni) will be nalyzed.
2. Geology of the Area
The study area falls on the borderline between folded and non-folded zones [8] - [10] . Makhul and Hemrin asymmetrical anticlines form the eastern border of the area. The two anticlines are about 250 m in height. They trend North West-South East and plunge toward each other forming a saddle. This saddle is a topographic low where the Tigris River crosses these structures. Bolton [11] noted that the axes of Makhul and Hemrin anticlines are offset by a total of 7 kilometers forming en-echelon. It should be noted, however, that this offset is not abrupt but gradual where the two axes bend, from their parallel northwesterly trend, towards each other to meet at Fatha [10] .
The Oldest exposed rocks in the area are limestone of Jeribe Formation (Lower Miocene); it is exposed in the deep valleys of the anticlines. The Jeribe Formation is overlain by the Fatha Formation (formerly Lower Fars Formation -Lower Miocene) which makes up the bulk of the anticlines. The Lower Fars Formation makes up the bulk of the anticlines. The whole section of the formation is exposed on the southwestern flank of the anticlines with a maximum thickness of 380 meters [10] . It is composed of alternating beds of limestone, gypsum, marls
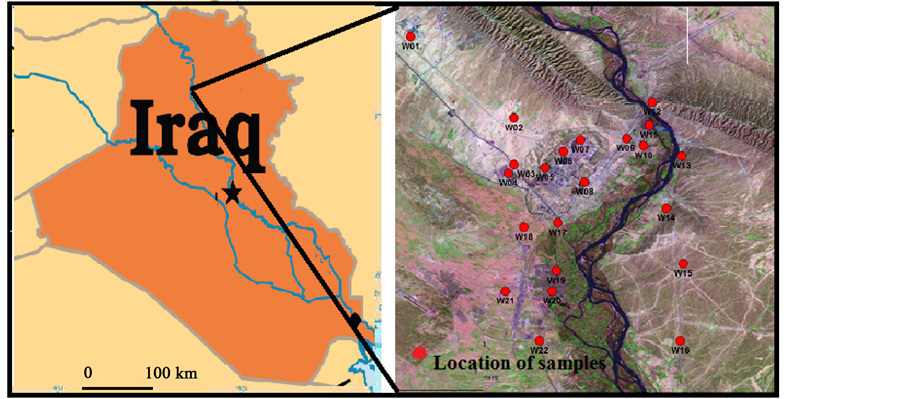
Figure 1. Study area and samples location sites.
and shales. Fatha Formation is over lined by Injana Formation (formerly Upper Fars Formation-Upper Miocene). The Upper Fars Formation is poorly exposed in the valleys of the southwestern flank of the range where the alluvial cover is removed, and it reaches a maximum exposed thickness of 439 meters. The top of the formation is not exposed in the area. It is composed of alternating beds of marls, sandstones and siltstone with two thin limestone beds near the base of the formation [10] . Mukdadiyah Formation (Pliocene) conglomerates are exposed in some areas near the Tigris River course. The rest of the studied area is plain covered by alluvial deposits [10] .
3. Data Collection and Analyses
Samples were collected from 22 locations (Figure 1 and Table 1) to analyze the TSP and some heavy metals concentration in air for two periods January and July 2013. The air samples (TSP) were collected using Low volume air sampler (Sniffer) equipment for twenty two different sites inside and outside the industrial area taking into consideration the prevailing wind direction that is an important factor in pollutants distribution (Figure 2).
The air samples were collected at a height of 1.65 meter above the ground with (liter/min) unit. These samples were analyzed in lab for TSP concentrations in unit microgram/m3 (μg/m3). Also, the same air samples were used to measure the concentrations of some heavy metals (Cadmium Cd, Cobalt Co, and Nickel Ni) in the Laboratory using Atomic Absorption Spectrometry equipment according to APHA, AWWA and WEF [12] procedure where the Method 3030 E, “Acid Digestion and Analysis by Flame Atomic Absorption Spectrometry was used”.

Table 1. Sample location.

Figure 2. Low volume air sampler (Sniffer).
4. Results and Discussion
The statistical results (Table 2) show that all constituents exhibit mean values that are higher than World Health Organization and Iraqi standards [2] [13] .
1) Total Suspended Particles (TSP): The environmental impacts of total suspended solids concentrations (TSP) on the residential areas near and around the industrial area were indicated. The mean of (TSP μg/m3) values in study area which has been measured to be 794.2 (min. 311.9, max. 1280.0) for January 2013, and 2807.5 (min. 1669.0, max. 3985.0) for July 2013.Although the (TSP) values are within the same range of [14] (TSP) results from the Kirkuk oil refinery (min. 230, max. 3555.6).
The (TSP) values in the studied area were higher than those cited in the guidelines of Iraqi National Standards [13] , and World Health Organization allowable limits [2] (Table 2).
Speed and the intensity of the dust storms during these months are the main reasons for the differences in readings of the two periods (Figure 3). It was noticed that the prevailing wind direction effected the distribution of TSP. In this context, it can be seen that TSP concentrations were increasing at the direction away from the industrial area. Similar results were noticed by [7] and they also noted that the maximum effect was about 5 km from the industrial area while the pollution extended up to 15 km from the source (Figure 4) [7] [15] . Neighbouring villages were also affected be dense pollution within 10 Km radius from the industrial area. The city of Baiji got its share from the pollution produced by the industrial area although it is 15Km away from the source (Figure 4) [13] .
2) Heavy Metals Analyses: The mean values of Cd, Co, and Ni in study area were 0.07 (min. 0.02, max. 0.10), 0.08 (min. 0.01, max. 0.27) and 0.09 (min. 0.01, max. 0.45) respectively for January 2013. For July, 2013 the values for Cd, Co, and Ni (μg/m3) were 0.07 (min. 0.01, max. 0.14), 0.10 (min. 0.02, max. 0.38) and 0.19 (min. 0.02, max. 0.63) respectively.
The comparison Heavy metals with guidelines showed that the Cd mean values exceeded the WHO allowable limits but under the Iraqi National limits for the two periods. While the Co and Ni mean values stayed under these limits for the two periods. The increasing of concentration in July can be attributed to the increase of fuel combustion operations at the industrial area as well as the effect of meteorological factors at this period.
3) GIS modelling for polluters impacts
Researchers describe the relationship between emissions, meteorology, atmospheric concentrations, deposition, and other factors concerning air pollution by numerical modelling [1] [3] -[5] . In this research, the Geographic Information Systems (GIS) was applied using Arc GIS 10.2 modelling version for measurements polluters in the air for the two sampling periods (January and July 2013). With ArcGIS Geostatistical Analyst, it can easily create a continuous surface, or map, from measured sample points like levels of pollution which is stored in a point feature layer or raster layer or by using polygon centroids. When used in conjunction with ArcMap, Geostatistical Analyst provides a comprehensive set of tools for creating surfaces that can be used to visualize, analyse, and understand spatial phenomena [16] .
The polluter concentration was measured at 22 site locations over the study area (Figure 1), but the polluters values for other (unmonitored) locations in the study area were also of interest. However, due to cost and practicality, the samples cannot be tacked from everywhere. Geostatistical Analyst provides tools that make optimal
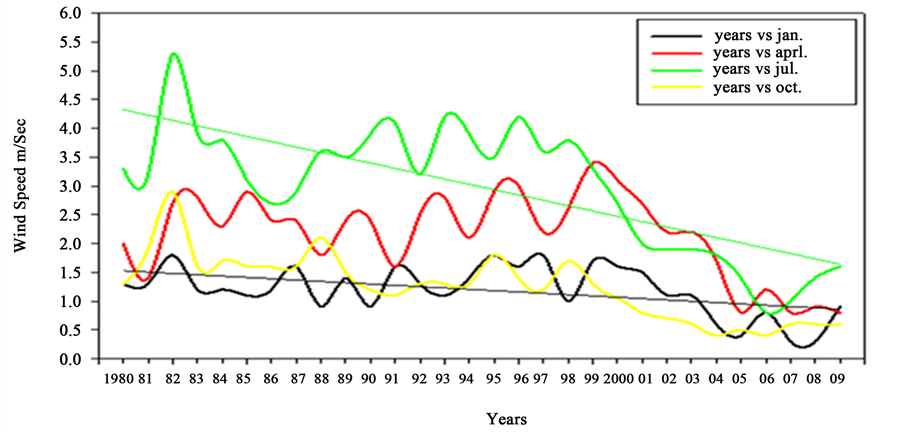
Figure 3. The relationship between the monthly average wind speed (m/sec) for January, April, July and October in Baiji meteorological station for period 1980-2010 [7] .
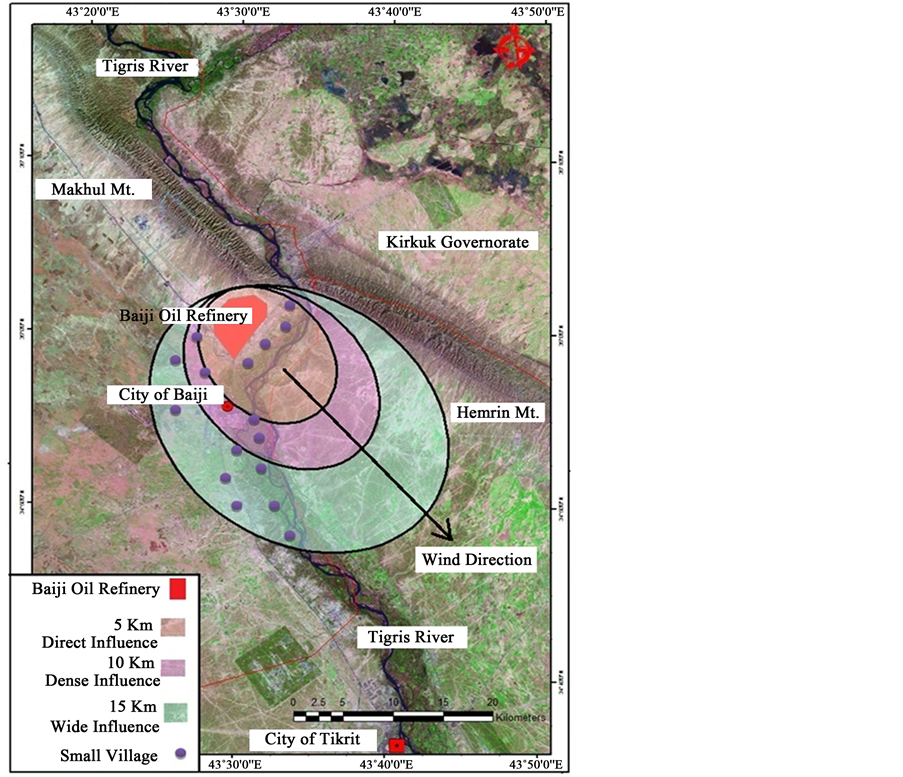
Figure 4. The pollution levels of the industrial area according to the wind direction [15] .
Table 2. The statistical calculation results for all constituents.
predictions possible by examining the relationships between all the sample points and producing a continuous surface of polluter’s concentration, standard errors (uncertainty) of predictions, and probabilities that critical values are exceeded.
a) Mapping the predictions of polluters concentration over study area
To produce a map that has a surface that incorporates spatial relationships among the sample points then geostatistical options are to be used to remove trend and then modelling spatial autocorrelation of sample values to create a more accurate prediction surface (prediction map) [16] .
Ordinary kriging interpolation method was used in this work for trend removal and anisotropy to create better predictions. Ordinary kriging is the simplest geostatistical model because of the number of assumptions required it is the lowest relative to other models. The statistical analyses of data gave a global trend. After refinement with the Trend Analysis tool, the result determined that a second-order polynomial seemed reasonable. The formula was used to produces a surface that is too smooth to have maximum accuracy. This trend was repre- sented by a mathematical formula and removed from the data.
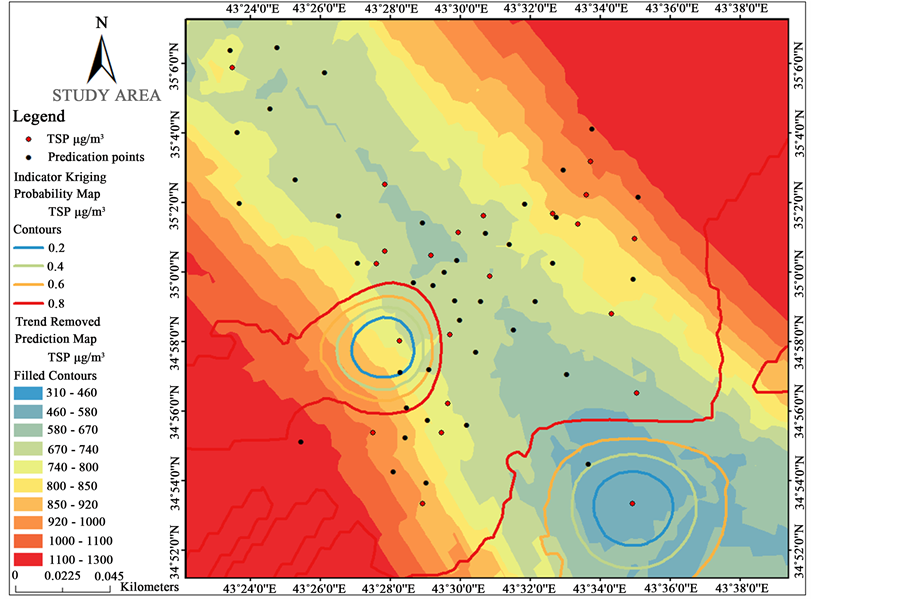
Once the trend is removed, the statistical analysis was performed on the residuals or the short-range variation component of the surface. The trend will automatically be added back before the final surface is created so that the predictions produce meaningful results. Figure 5(a) and Figure 5(b) and Figures 6(a)-(f) show the GIS maps with prediction (trend removal) layers for polluters in study area for the two periods. The prediction surfaces of these maps took into consideration the global trends in the data and were adjusted for the local directional influence which provides a better prediction of unknown values. The GIS maps show the prediction values as filled contour (zones) for all polluters. It can be noted that polluters concentration have global trend of north and northwest to south and southeast. Also, the polluter’s concentration change rapidly in the southwest- northeast direction and a more gradual change in the northwest-southeast direction. This is attributed to the prevailing wind direction in the study area.
b) Mapping the probability of polluters exceeding a critical threshold
In the decision-making process, care must be taken in using maps of predicted polluters for identifying unsafe areas. That means the determination of any locations where it value exceed the Standards (critical threshold) values of polluters when the samples were taken in the study area.
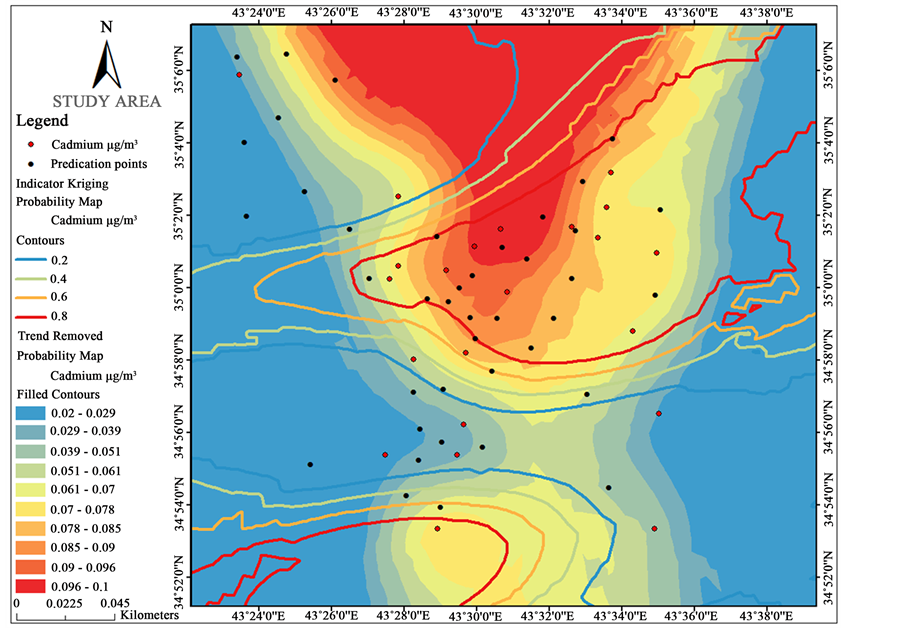
For present work, the WHO [2] standards were considered. To aid the decision-making process, the Geostatistical Analyst with indicator kriging model was used to map the probability that polluter’s values exceed the threshold value. The indicator kriging transformed the polluter’s values to a series of 0s and 1s according to whether the values of the data are below or above a threshold [16] . For example, if a threshold of Cd (0.05) was used, any value below this threshold will be assigned to a value of 0, whereas the values above the threshold will be assigned a value of 1. Indicator kriging calculated from the 0 - 1 dataset and go on for all polluters threshold.
Figure 5(a) and Figure 5(b) and Figures 6(a)-(f) show the probability map (Indicator Kriging layer) for polluters in the study area. There is no need to create the probability map for Cobalt (Co) concentration because it
 (a)
(a)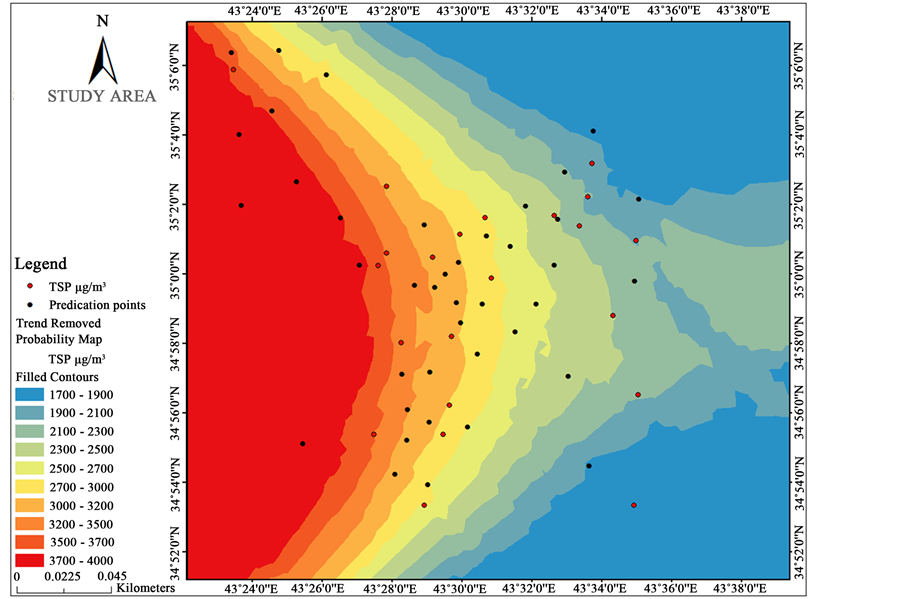 (b)
(b)
Figure 5. Prediction and Probability GIS maps for TSP concentration in study area. (a) TSP January concentration in study area; (b) TSP July concentration in study area.
 (a)
(a)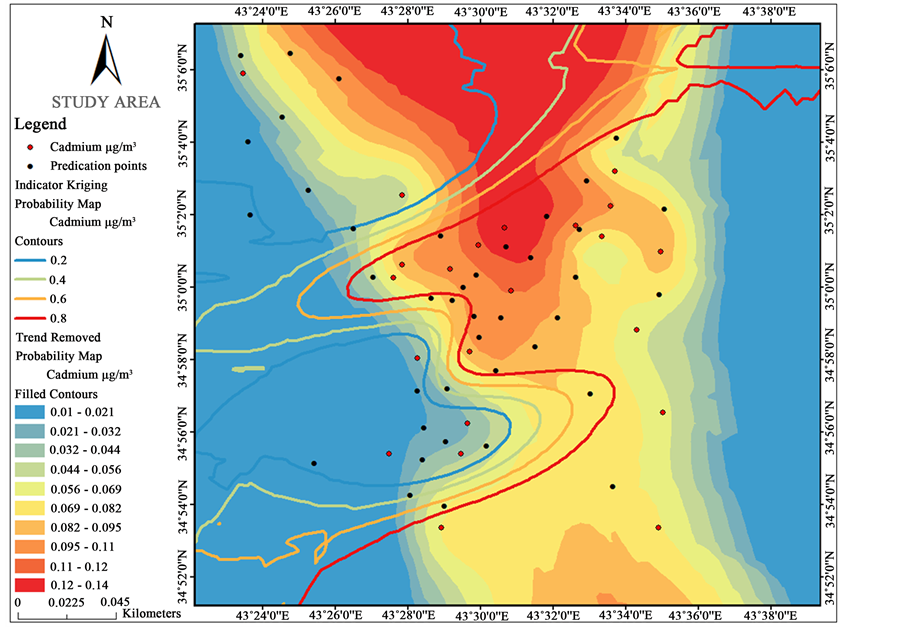 (b)
(b)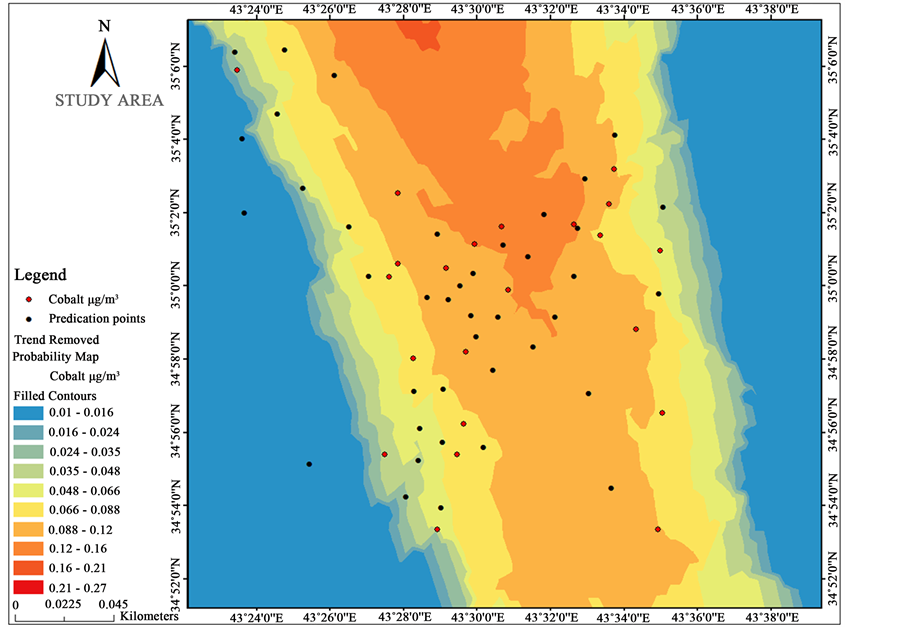 (c)
(c)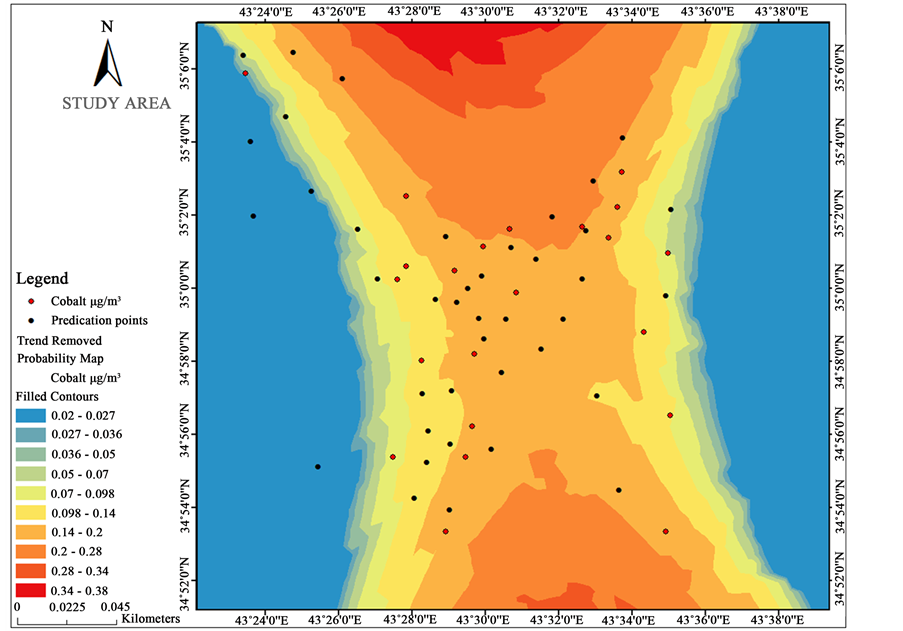 (d)
(d)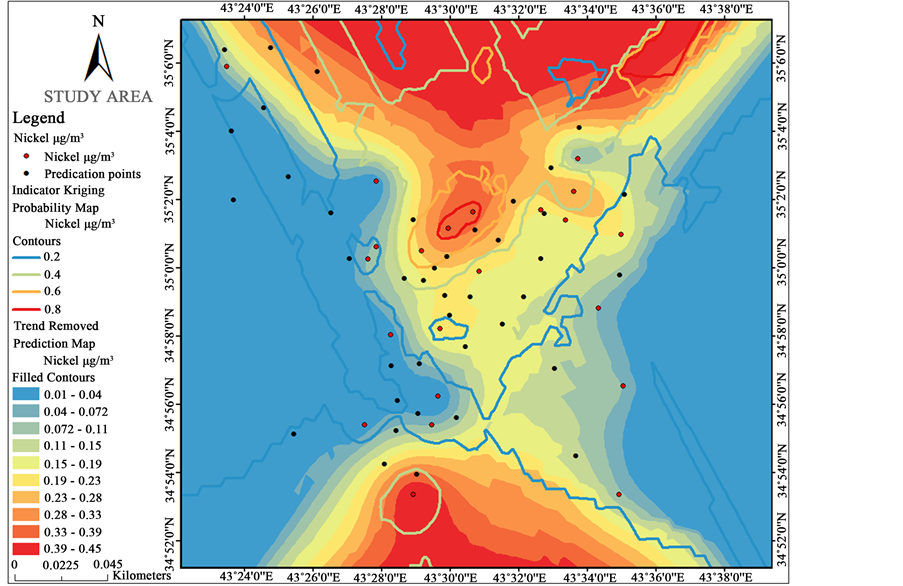 (e)
(e)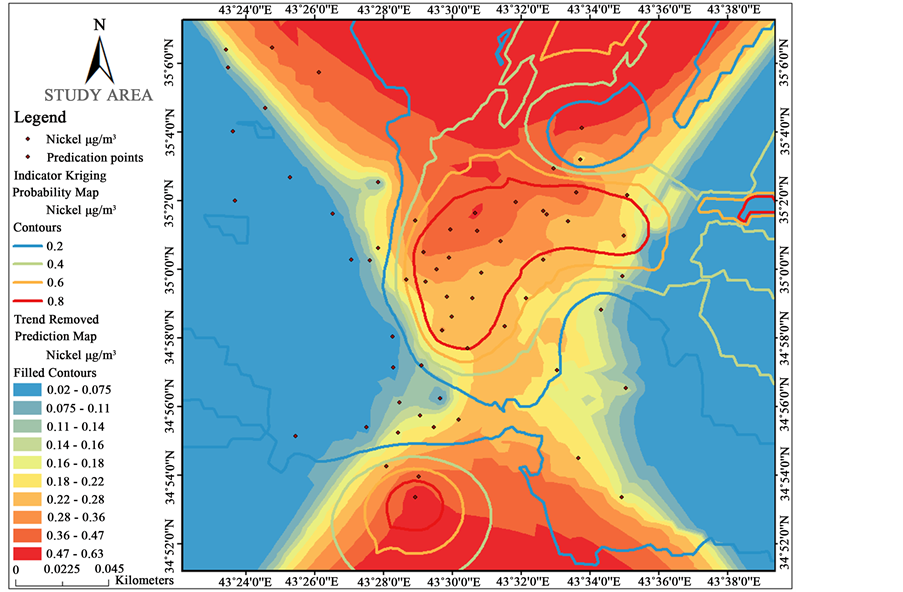 (f)
(f)
Figure 6. Prediction and Probability GIS maps (a-f) for heavy metals concentration in study area. (a) Cd January concentration in study area; (b) Cd July concentration in study area; (c) Co January concentration in study area; (d) Co July concentration in study area; (e) Ni January concentration in study area; (f) Ni July concentration in study area.
did not exceed the standard for two periods. Also, all TSP concentrations exceeded the standard value during July, and no probability map was created for this period. The maps display the indicator prediction values, interpreted as the probability to exceed the threshold value. The GIS maps show the probability values as contour for all polluters. These contours represent the area of exceeding threshold (standard) values with different probability values. That means each contour value represents the level of concentration value for a specific polluter.
The GIS maps now show areas of high and low predicted of polluter’s values and areas of high probability that the polluter’s concentrations exceeded the Air Quality Standard when the samples were taken. It is noteworthy to mention that [7] arrived to a very similar result.
5. Conclusions
The difference of TSP concentrations between the two periods reflects the effect of the wind direction, wind speed and the intensity of the dust storms during these months respectively.
1) The increase of heavy metals concentration during July can be attributed to the increase of fuel combustion operations at the location.
2) ArcGIS Geostatistical Analyst can save time and cost in similar analyses.
3) The GIS Predictions (trend removal) maps succeeded to predict the values for all polluters for the whole study area. Also, the GIS Probability maps indicate the probability of some polluters exceeding critical standards in the study area.
Cite this paper
Salwan S.Al-Hasnawi,Hussain M.Hussain,NadhirAl-Ansari,Sven Knutsson, (2016) The Effect of the Industrial Activities on Air Pollution at Baiji and Its Surrounding Areas, Iraq. Engineering,08,34-44. doi: 10.4236/eng.2016.81004
References
- 1. Matejicek, L. (2013) Spatial Modeling of Air Pollution in Urban Areas with GIS: A Case Study on Integrated Database Development. Advances in Geosciences, 4, 63-68.
http://dx.doi.org/10.5194/adgeo-4-63-2005 - 2. World Health Organization (WHO) (1996) Revised WHO Air Quality Guidelines for Europe.
- 3. Hashim, B.M. (2009) Measurement and Study Concentrations Some Air Pollutants in Baghdad City. M.Sc. Thesis, College of Science Al-Mustansiriyah Univ. in Atmospheric Sciences, 95 p.
- 4. Al-Saadi, G.M. (2012) Assessment of Air and Water Pollution Due to Operation South of Baghdad Power Plant. M.Sc. Thesis, Building and Construction Engineering Department, University of Technology, 147 p.
- 5. Leili, M., Naddafi, K., Nabizadeh, R. and Yunesian, M. (2008) The Study of TSP and PM10 Concentration and Their Heavy Metals Content in Central Area of Tehran, Iran. Air Quality Atoms Health, 1, 159-166.
http://dx.doi.org/10.1007/s11869-008-0021-z - 6. IEA (International Energy Agency) (2014) Fact Sheet for Oil Supply in Iraq.
http://www.iea.org/media/Factsheet_OilSupplyInIraq.pdf - 7. Aldabbas, M.A., Hussain, G.A. and Al-Jaberi, M.H.A. (2015) The Effect of Dust Storm and Industrial Area on Air Quality of Sallah Al-Diien-Iraq. Journal of Basrah Researches (Sciences), 41, 26-38.
- 8. Al-Naqib, K.M. (1967) Geology of the Southeastern Area of Iraq: U. S. Geo1. Survey Prof. Paper 560 G, 54 p.
- 9. Dunnington, H.V. (1958) Generation, Migration, Accumulation, and Dissipation of Oil in Northern Iraq. In: Weeks, L.G., Ed., Habitate of Oil, a Symposium, Association of Petroleum Geologists.
- 10. Al-Ansari, N. (1972) Geology of the Southern Part of Jabal Makhul. M.Sc. Thesis, University of Baghdad, 155 p.
- 11. Bolton, C.M.G. (1954) Geological Report on AI-Fathasulphur Occurrence: Mineral Survey of Iraq. Ministry of Development, Report No. 15 (Unpublished Report), 107-132.
- 12. APHA, AWWA and WEF (1998) Standard Methods for Examination of Water and Wastewater. 20th Edition, Washington DC.
- 13. MOE “Ministry of Environment of Iraq” (2008) Determinants of Local and Global Air Pollutants. Report and the Reality of the Situation, The Air Quality Department.
- 14. Ali, L.A. (2013) Environmental Impact Assessment of Kirkuk Oil Refinery. Unpublished Ph.D. Thesis, College of Science, University of Baghdad.
- 15. Al-Afraji, A.K. (2012) The Environmental Impacts of the Existing Refineries on the Surrounding Environment Baiji Refinery as Case Study. Unpublished M.Sc. Thesis, Institute of Urban and Regional Planning for Post Graduate Studies, University of Baghdad.
- 16. ESRI (2013) The Manual of ArcGIS 10.2.