Engineering
Vol.5 No.8(2013), Article ID:35528,9 pages DOI:10.4236/eng.2013.58078
A Study on the Quality Control of Concrete during the Slip Form Erection of Pylon
1Structural Engineering Research Division, Korea Institute of Construction Technology, Goyang, South Korea
2Global Technology Cooperation Center, Korea Institute of Construction Technology, Goyang, South Korea
Email: hiyoon@kict.re.kr, wjchin@kict.re.kr, lagoon@kict.re.kr, yjkim@kict.re.kr
Copyright © 2013 Hyejin Yoon et al. This is an open access article distributed under the Creative Commons Attribution License, which permits unrestricted use, distribution, and reproduction in any medium, provided the original work is properly cited.
Received June 2, 2013; revised July 2, 2013; accepted July 9, 2013
Keywords: Slip Form System; Construction of Concrete Pylons; GFRP Form
ABSTRACT
The construction market of super-high-rise buildings and long-span bridges has recognized unprecedented expansion owing to the development of high performance and high strength materials and the advances achieved in the design and construction technologies. In parallel to the lengthening and enlargement in scale of the structures, securing quality control technology of concrete while reducing the construction duration using improved construction methods emerges as a critical problem for concrete structures. In the erection of concrete pylons, slip forming represents the latest method offering the advantage of reducing drastically the construction duration compared to other methods by adopting automated slip-up of the forms and enabling 24-hour continuous placing. This study determines the slip-up time of the slip form by evaluating the early strength through the surface wave velocity and develops lightweight GFRP form in order to secure the quality of concrete during the slip form erection of pylons. A slip form system is fabricated and mockup test is conducted to verify the performances of the developed techniques through the construction of 10 m-high pylon with a hollow section.
2. Estimation of Early Setting Using Surface Wave Velocity
The slip-up of the slip form should be undertaken once concrete can stand by itself during the form removal. Moreover, the slip-up of the slip form should be conducted after a definite setting time so that the concrete poured in the slip form develops a strength satisfying the criterion required at the design stage but before excessive lifting force is needed to subdue the adhesion between the form and concrete. Accordingly, this study determines the slip-up time of the slip form based upon quantitative data enabling concrete to stand by itself and secure sufficient long-term strength at removal of the form.
The eventual self-supporting capacity of concrete can be evaluated by measuring the early setting time corresponding to a penetration resistance of 3.5 MPa when conducting penetration resistance test according to the rule specified by KS F 2436 [9]. Besides, in terms of the strength, Reichverger and Jaegermann (1980) reported from their experimental results that, when stripping was done with a concrete strength of approximately 0.2 - 0.3 MPa, concrete developed 100% of its strength at 28 days with small deformations and that surface treatment could be conducted easily to manage the construction quality [10]. However, the application of such criteria for the removal strength requires knowledge of the compressive strength data for all concretes placed continuously. This means that the compressive strength of concrete must be measured at each placing instant and renders it quasi impossible to determine the climbing time of the slip form system.
Accordingly, this study determines the slip-up time of the slip form by estimating the compressive strength from the surface wave velocity measured continuously during the construction by a device attached to the slip form. The early setting of concrete occurs through the hydration of cement by water. Since the strength of concrete develops by means of such hardening phenomenon, the early setting time and the initiation of the development of strength are closely related. In order to understand this relationship, specimens were fabricated and subjected to standard penetration resistance test and compressive strength test so as to measure the penetration resistance, compressive strength and surface wave velocity with respect to the duration of curing.
2.1. Measurement of Surface Wave Velocity of Concrete
This study examines the relationship between the early setting time and the surface wave velocity of concrete considering the correlation between the concrete strength development and early setting time and the fact that the velocity of the ultrasonic wave increases according to the progress of the hardening of concrete [11]. Ultrasonic waves can be generated by hammering the surface of the medium. Differently from the so-generated compressive wave (P-wave) and shear wave (S-wave), the surface wave propagates along the surface and is free from problems caused by the effects of the reflecting waves or mode conversion. Therefore, the ultrasonic wave can be effectively applied to structures in which the hardening characteristics of concrete at the surface are primordial such as in structures erected by slip forming. Since the surface wave represents approximately 67% of the propagating energy and is thus gathering the largest energy, the surface wave is detected using the continuous wavelet transform.
2.2. Test on Fresh Concrete
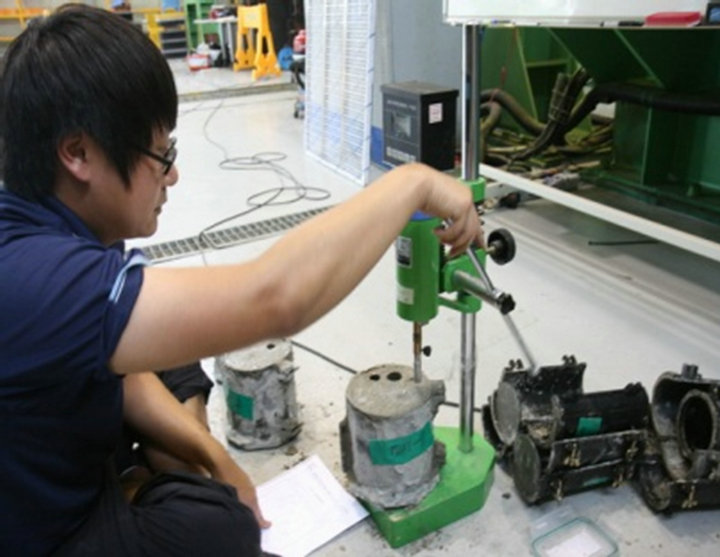
The relation among the surface wave velocity, penetration resistance and compressive strength was analyzed for concrete at early age. To that goal, specimens were fabricated with respect to the mix proportions listed in Table 1 and, measurement test of the surface wave velocity, penetration resistance test and compressive strength test were conducted with respect to the curing time (Figure 1). Five different curing temperatures (5˚C, 15˚C, 20˚C, 30˚C, 35˚C) were adopted to consider common placing conditions at the exception of the coldest and hottest seasons. The penetration resistance and compressive strength were measured at intervals of 1 hour and the
 (a)
(a)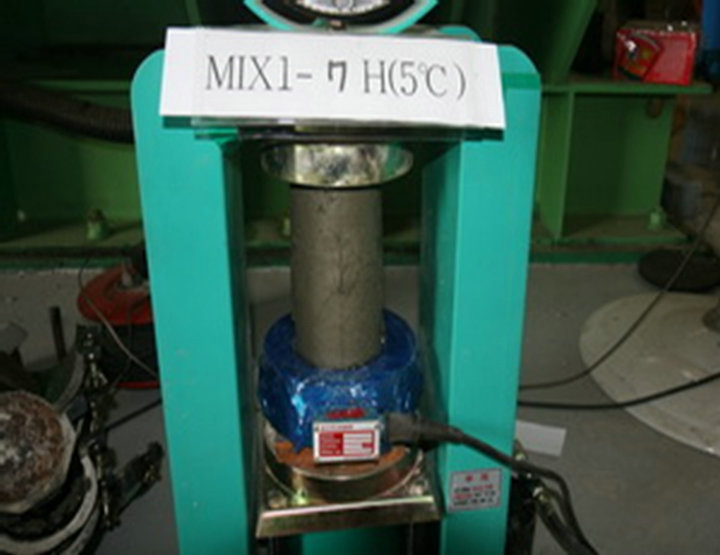 (b)
(b)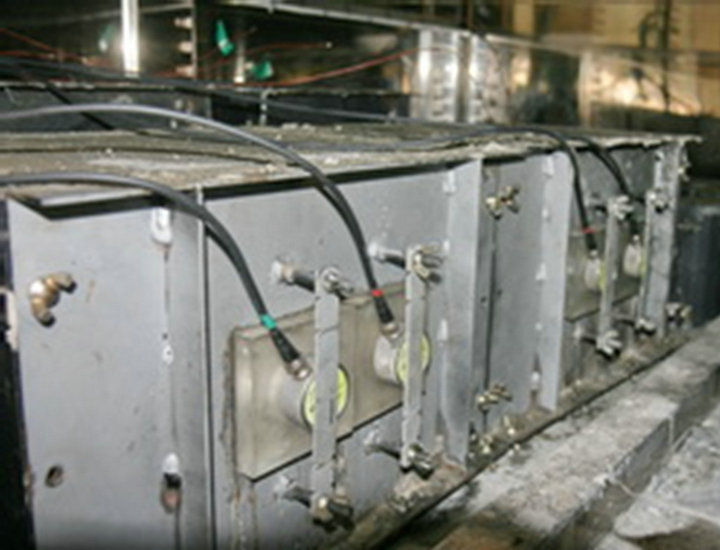 (c)
(c)
Figure 1. Tests on concrete at early age. (a) Penetration resistance test; (b) Compressive strength test; (c) Measurement test of surface wave velocity.
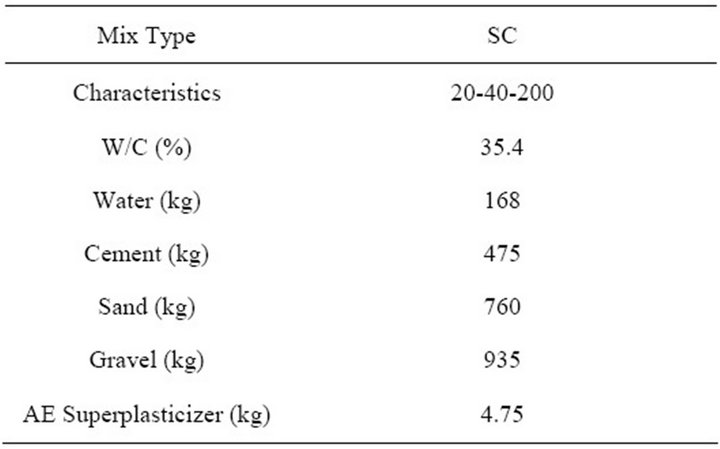
Table 1. Mix proportions of concrete.
surface wave velocity was measured continuously.
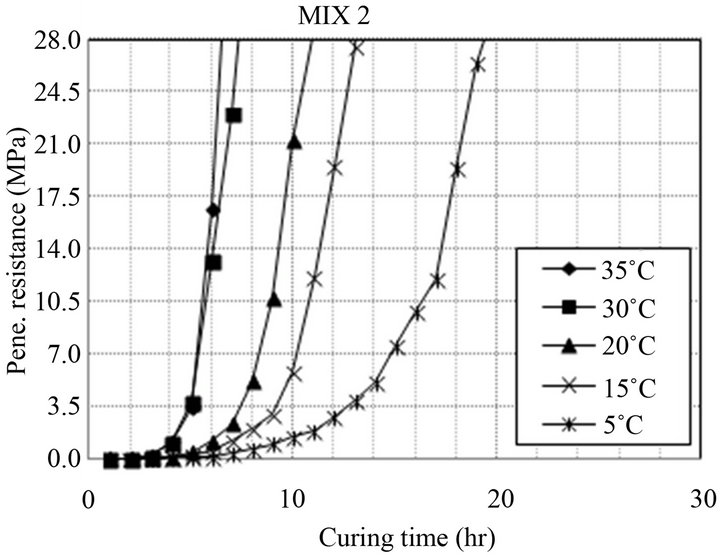
Figure 2 plots the measured penetration resistance,
 (a)
(a)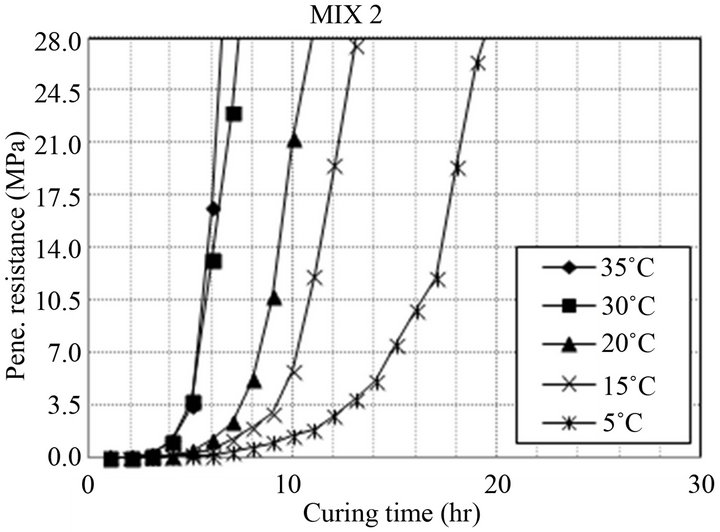 (b)
(b)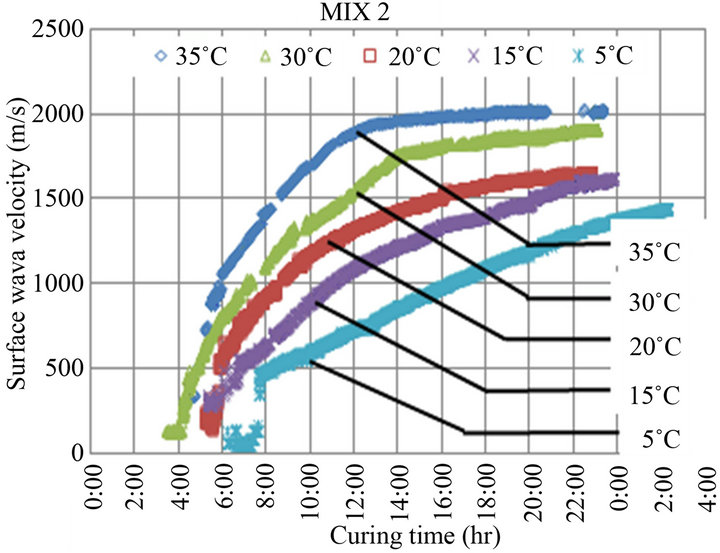 (c)
(c)
Figure 2. Variation of the characteristics of concrete with respect to the curing time. (a) Variation of penetration resistance; (b) Variation of compressive strength; (c) Variation of surface wave velocity.
compressive strength and surface wave velocity with respect to the curing time. The early setting time is defined as the time at which the penetration resistance reaches 3.5 MPa in compliance with KS F 2436. It can be observed that the early setting time occurs later with higher curing temperatures. In addition, the development of strength initiates later with lower curing temperatures and, longer time is needed to reach a definite surface wave velocity. Considering the fact that the hardening of concrete is caused by the hydration, there exists a very close relation between the penetration resistance and the compressive strength and, it can be affirmed that there is a clear relationship with the surface wave velocity.
Figure 3 plots the linear interpolations of the curing time required to reach the compressive strength of 0.2 MPa needed to develop the strength at 28 days proposed by Reichverger and Jaegermann and the curing time needed for the penetration resistance corresponding to the early setting to reach 3.5 MPa based on the penetration resistance and compressive strength measured every hour in Figures 2(a) and (b). In view of Figure 3, early setting occurred first followed by the development of the compressive strength of 0.2 MPa within the range of temperatures (5˚C - 35˚C) considered in the tests. The additional time required to reach the compressive strength of 0.2 MPa after early setting exhibits difference according to the curing temperature. Such difference in time can reach a maximum of 6 hours due to the slower occurrence of the hydration of cement by water at lower curing temperature, whereas this difference reduces with higher curing temperature. Early setting and the development of the compressive strength of 0.2 MPa occurred at practically identical time at 35˚C. Such quasi-coincidence can be explained by the faster hydration of cement by water at higher curing temperature. According to the results of Figure 3, since the difference in time is less than 1 hour at curing temperature higher than 30˚C, both
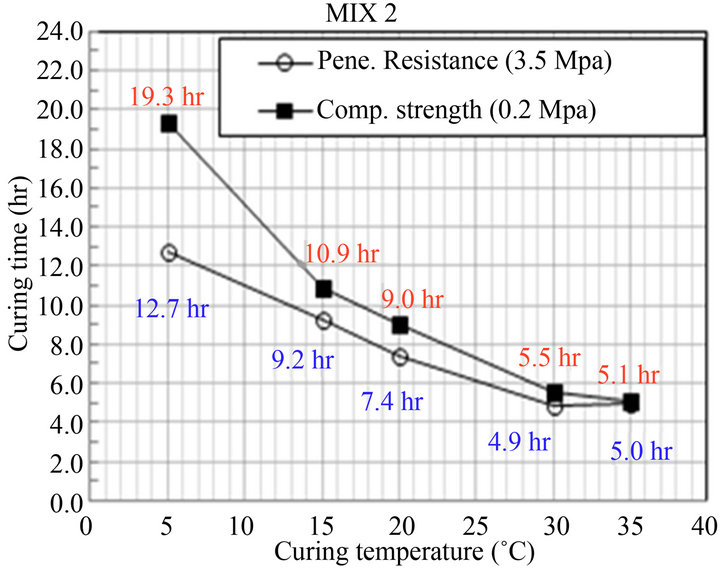
Figure 3. Comparison of criteria for the slip-up of slip form.
criteria can be applied indifferently. However, very long time is needed to develop the compressive strength of 0.2 MPa after early setting in case of low curing temperature. Therefore, significant difference in time may occur for the slip-up of the slip form according to the selected criterion.
When concrete becomes exposed following the climbing of the slip form, concrete should secure a penetration resistance of 0.35 MPa to stand by itself and maintain its shape. In terms of the strength, concrete should also secure a compressive strength of minimum 0.2 MPa as reported by Reichverger and Jaegermann (1980). Accordingly, this study sets the compressive strength of 0.2 MPa as criterion for the slip-up of the slip form so that concrete can secure self-supporting capacity and long-term strength when exposed by the lifting of the slip form.
Figure 4 plots surface wave velocity sampled at intervals of 1 hour and the corresponding compressive strength in order to examine the relationship between the surface wave velocity and compressive strength. The hourly sampling of the surface wave velocity from the data measured continuously is due to fact that the compressive strength test was conducted at intervals of 1 hour. In view of Figure 4, the surface wave velocity increases rapidly with higher compressive strength in the initial part of the curves prior to the compressive strength of 0.2 MPa after placing of concrete. After the development of a definite strength, the surface wave velocity does not increase significantly even when the compressive strength increases.
3. Application of Lightweight GFRP Panel
To date, the panel as the member maintaining the shape of the pylon in the slip form method used steel forms. However, these steel forms present the problems of being
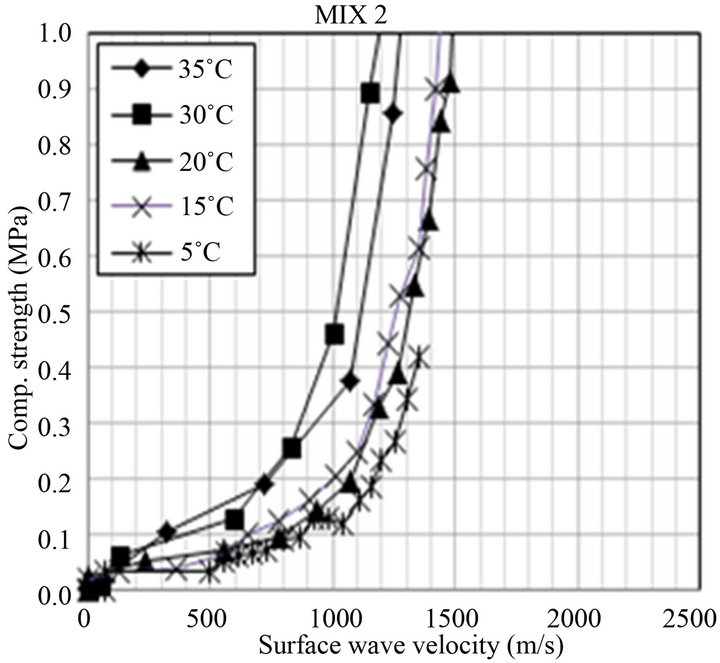
Figure 4. Surface wave velocity and compressive strength.
heavy and of being difficult to assemble. Moreover, quality control is necessary because of the corrosion of the conventional steel forms caused by the uninterrupted construction process, and continuous surface finishing by the workers is required due to the friction between the concrete section and the section of the slip form. In order to solve such disadvantages, this study developed lightweight panels featured by their ease of assembly. GFRP material was selected considering its durability and characteristics enabling to reduce the frictional force. The sodeveloped GFRP panel presents a modular structure to simplify the numerous connections needed to fasten the waler and link the modules in the conventional steel forms.
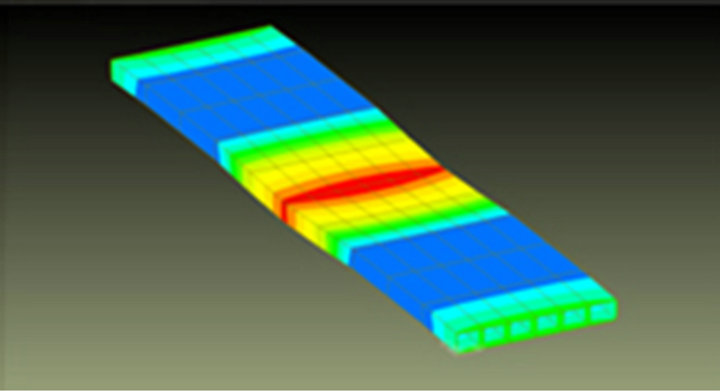
The shape of the panel was conceived as a box structure considering the ease of assembly and dismantlement as well as the insulation effect. Accordingly, 5 shapes were selected and examined by structural analysis (Figure 5). The corresponding maximum deflections were compared and resulted in the selection of 6-box structure with a thickness of 6 mm [12] owing to its smallest deflection (Table 2). Figure 6 illustrates the fabrication of the lightweight GFRP panel.
4. Mockup Test
4.1. Considered Pylon
The design of the slip form system was conducted for field verification of the developed technologies through mockup test. The considered pylon to be constructed was assumed as a 10 m-high pylon with rectangular and hollow section commonly adopted in cable-supported bridges. The dimensions of the pylon at the foot are 4.0 m × 4.0 m with thickness of 0.6 m. For the top elevated at 10.0 m height, the dimensions are 3.77 m × 3.6 m with thickness of 0.6 m on 3 faces and 0.5 m on one face. Figure 7 shows the dimensions of the pylon at the bottom and top.
4.2. Design of Slip Form System
The slip form is composed of yoke, form panel and waler, working platform, lifting device and spindles to adjust the perimeter of slip form assembly to match the sectional change (Figure 8). The pylon considered in this
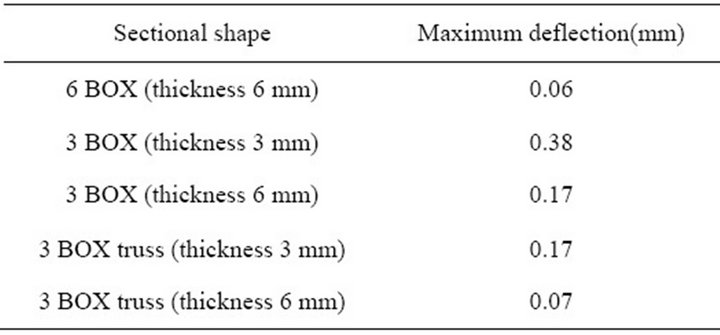
Table 2. Structural analysis results for the GFRP panel.
 (a)
(a)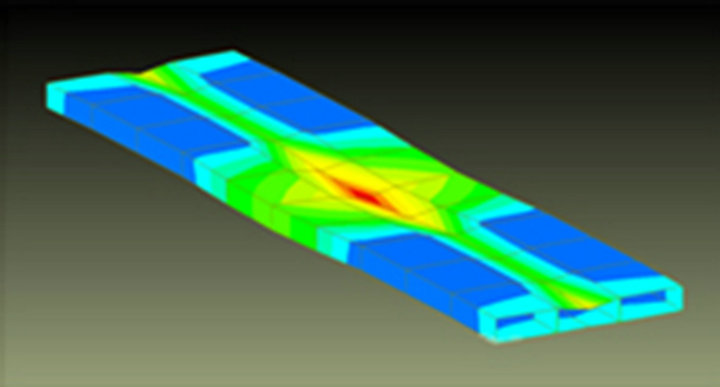 (b)
(b)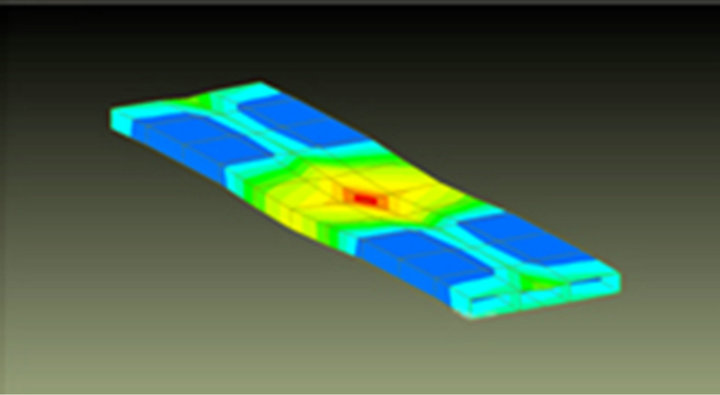 (c)
(c)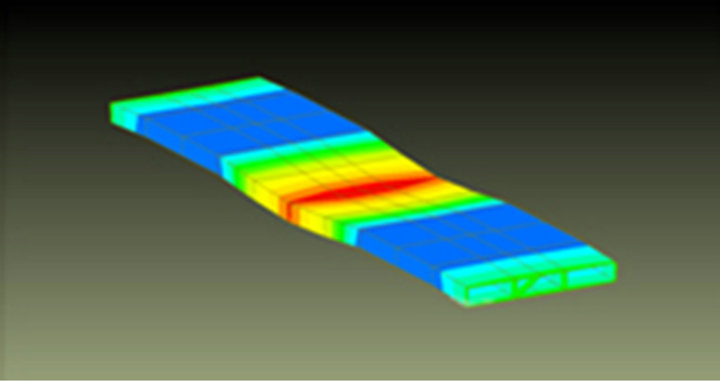 (d)
(d)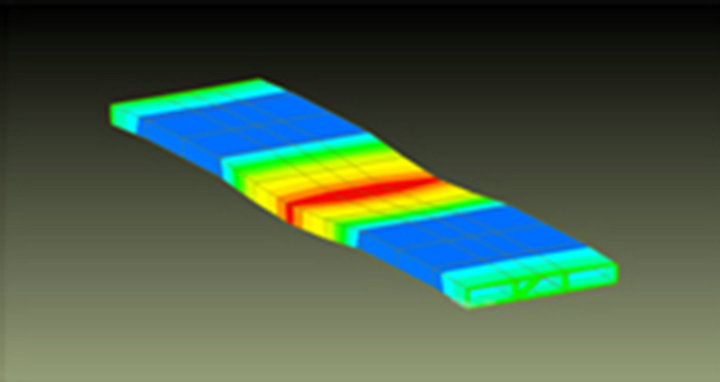 (e)
(e)
Figure 5. Determination of the section of the light weight form module by structural analysis. (a) 6 Box structure, thickness 6 mm; (b) 3 Box structure, thickness 3 mm; (c) 3 Box structure, thickness 6 mm; (d) Truss structure, thickness 3 mm; (e) Truss structure, thickness 6 mm.
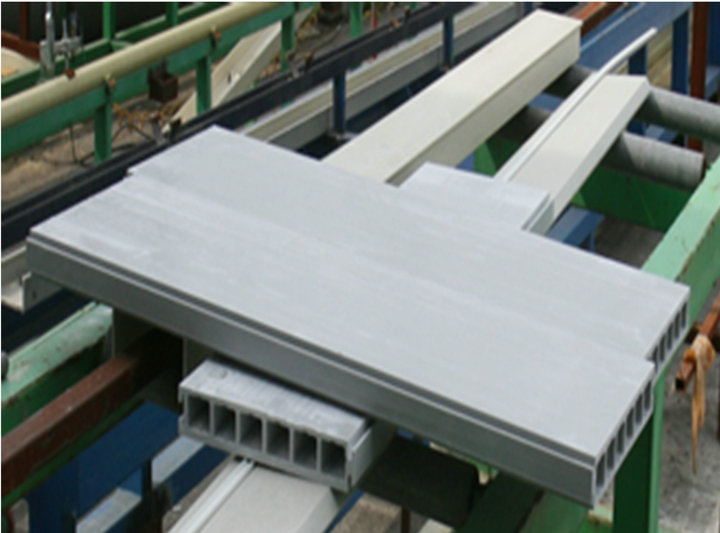
Figure 6. Fabrication of GFRP module.
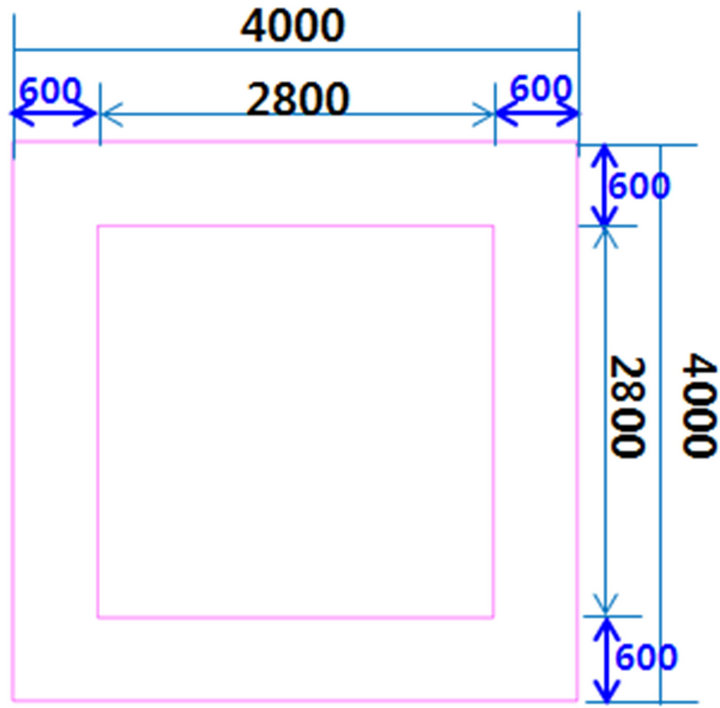 (a)
(a)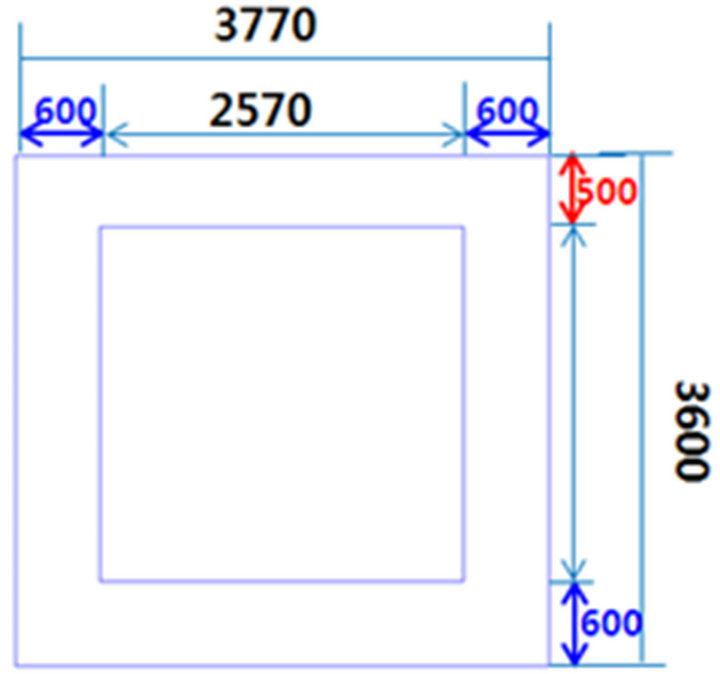 (b)
(b)
Figure 7. Cross sectional shape of considered concrete pylon. (a) Foot of pylon (EL. 0.0 m); (b) Top of pylon (EL. 10.0 m).
study presents a section and thickness varying with the height. Therefore, the slip form members were designed to accommodate the tapered section and varying thickness. Ten yokes are disposed considering the size of the pylon. The yokes are composed of the yoke legs constituting the vertical members, the yoke channels constituting the horizontal members and the top yoke channels. Form panel and waler are arranged to support the lateral pressure caused by the placing of concrete and to maintain the shape of concrete. The form panels present a height of 1.25 m and, GFRP panels and steel panels are applied concurrently. The internal forms apply the conventional steel panels. For the external forms, steel panels are used for the corners and GFRP panels are used for the other parts. The walers are disposed in two rows and spindles are installed at the bottom.
The spindles are adjusted to vary the sectional dimensions. The forms are designed so as to enable overlapping of the corner panels and ordinary panels. Guides are installed to allow the walers to get apart at the corners according to the reduction of the section. Spindles are installed on the horizontal yoke channels to modify the thickness of one pylon’s face and the spindles are adjusted with respect to the height. The working platform is composed of three levels: the top deck, the working deck and the hanging deck. The slip form is a structure combining monolithically the forms and the working plat-
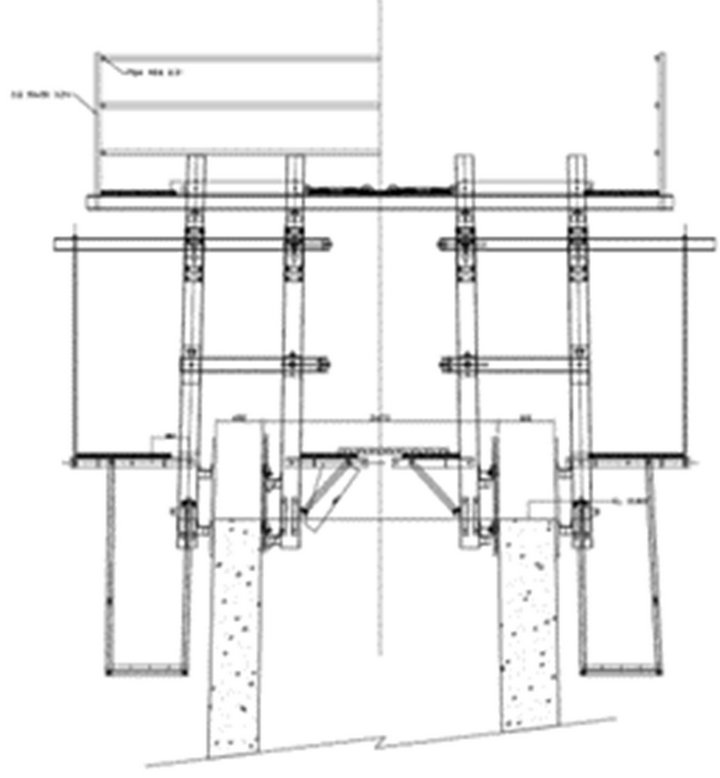
Figure 8. Composition of tapered slip form.
form. The working platform is connected to all the yoke legs and is designed to shrink according to the sectional variation of the pylon. Twelve hydraulic jacks with capacity of 60 kN are disposed considering the size of the pylon.
Virtual construction was performed through BIM (Building Information Modeling) based on the drawings of the slip form (Figure 9). The assembling method and installation sequence of the members were reflected considering the construction process. The position of each member was verified and the eventual interference between the members during the assembly or installation was examined.
4.3. Mockup Test
A slip form was fabricated based on the drawings designed for the field verification of the developed technologies, and mockup test was carried out to erect a 10 m-high pylon. As preliminary works for the installation of the slip form system, the reinforcement bars of the pylon were arranged and the foundation’s forms were installed to proceed to the placing of concrete of the foundation (Figure 10). The main members were installed after temporary assembly on the working platform. Steel panels and lightweight GFRP panels were combined to constitute the form panels (Figure 11). The devices for the measurement of the surface wave velocity were installed at the bottom of the GFRP panels as shown in Figure 12. In order to measure the surface wave velocity on every section, the devices were installed on the 4 faces. Figure 13 shows the slip form system after completed assembly. This system is equipped with a 3-level working platform. The lower level being used for the
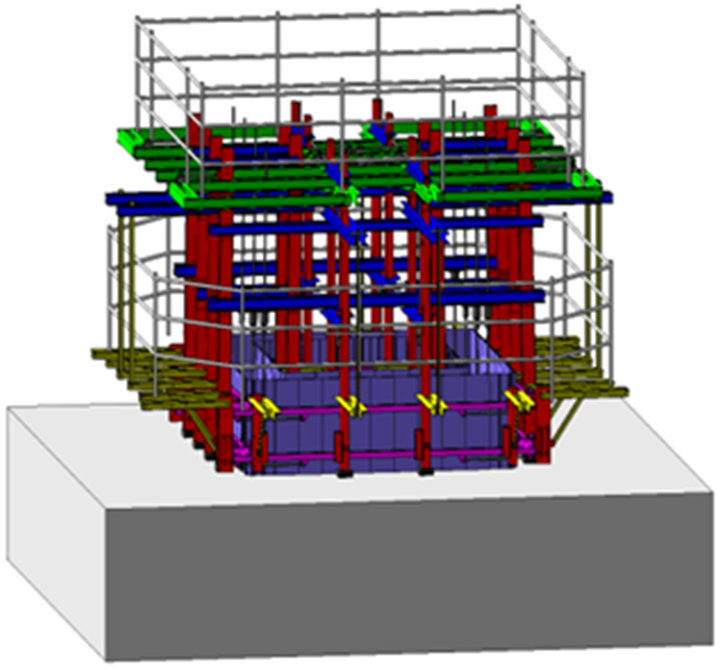
Figure 9. Virtual construction by BIM.
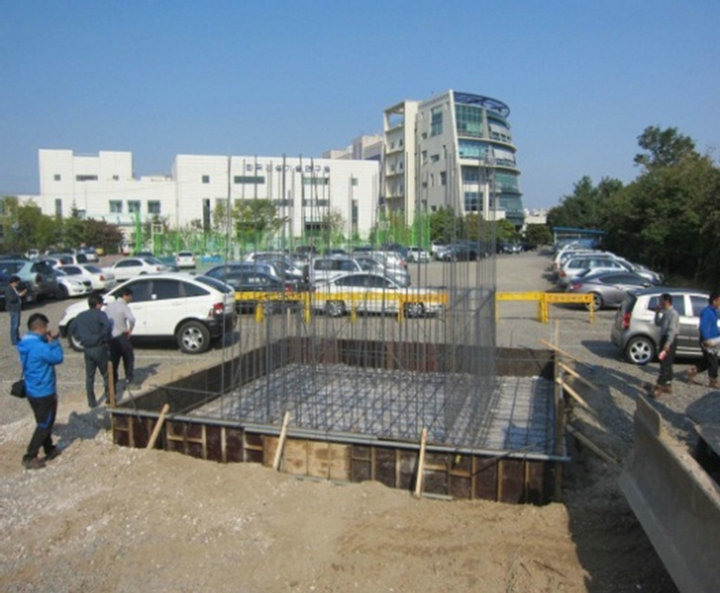
Figure 10. Arrangement of reinforcement and installation of foundation forms.
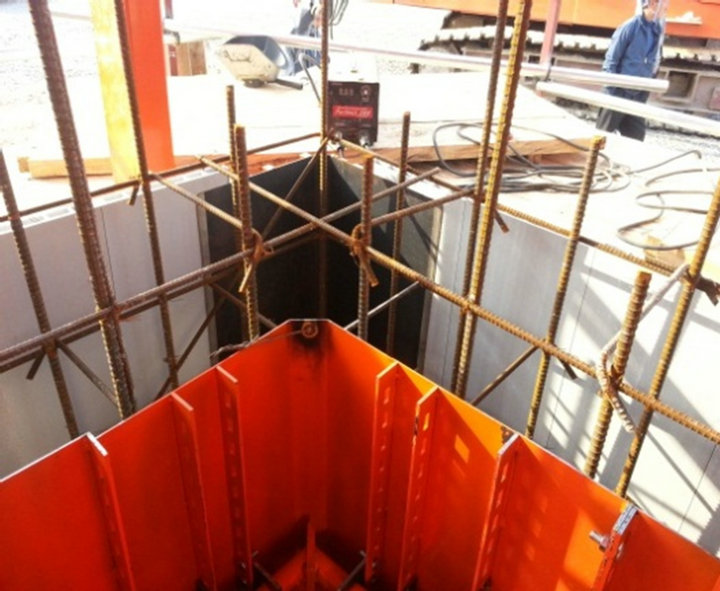
Figure 11. Form panels.
placing of concrete and slip-up, this level was installed after having secured sufficient height for its installation.
The concrete used for the erection of the pylon adopts mix proportions identical to those of Table 1. Concrete was poured by height of 25 cm every 2 hours. Figure 14 plots the time history of the surface wave velocity meas-
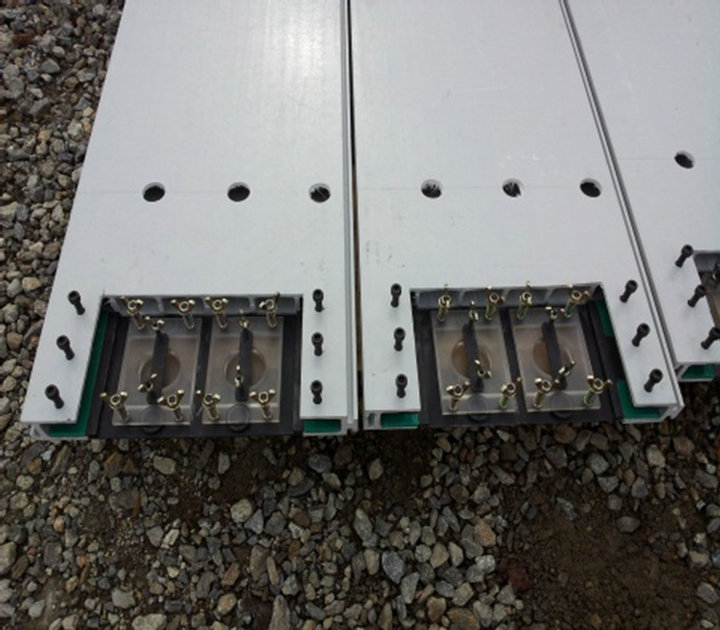
Figure 12. Surface wave velocity measurement device.
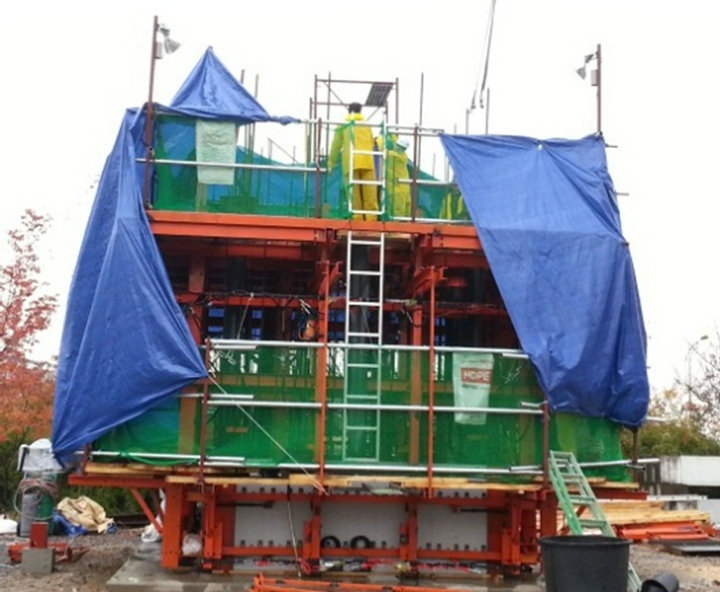
Figure 13. Installed slip form system.
ured by the devices attached at the bottom of the GFRP panels. The surface wave velocity for the slip-up was determined based on the data of Figure 4 as explained above. Considering the curing temperature (15˚C), the surface wave velocity chosen as criterion for the slip-up of the slip form is 1100 m/s. Slip-up was conducted by adjusting the climbing speed of the slip form to verify the quality of concrete according to the surface wave velocity applied for the slip-up. The parts highlighted by the arrows in Figure 14 indicate the times at which the surface wave velocity experiences changes and the corresponding slip-up times of the slip form system. It can be observed that the surface wave velocity decreases rapidly after having reached a definite value. This sudden decrease can be attributed to the climbing of the slip form, which led the surface wave velocity measurement device attached to the slip form to measure the surface wave velocity of concrete that did not experience early setting. Thereafter, the surface wave velocity regained values larger than 1100 m/s following the hardening of concrete and the surface wave velocity re-experienced decrease
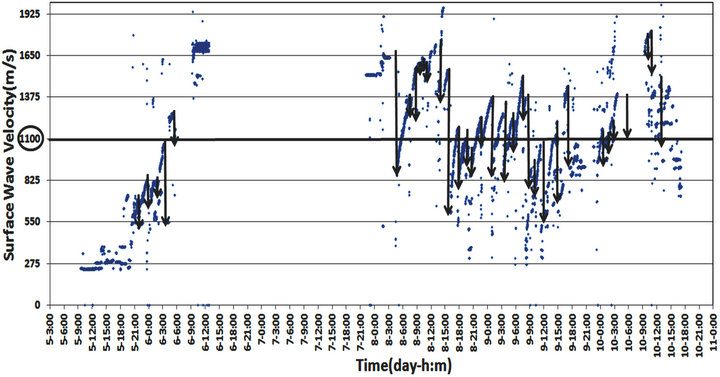
Figure 14. Variation of surface wave velocity.
with the progress of slip-up. Slip-up was executed mostly when the surface wave velocity exceeded 1100 m/s. Slipup was sometimes performed at surface wave velocity below 1100 m/s to verify the quality of concrete according to the variation of the surface wave velocity.
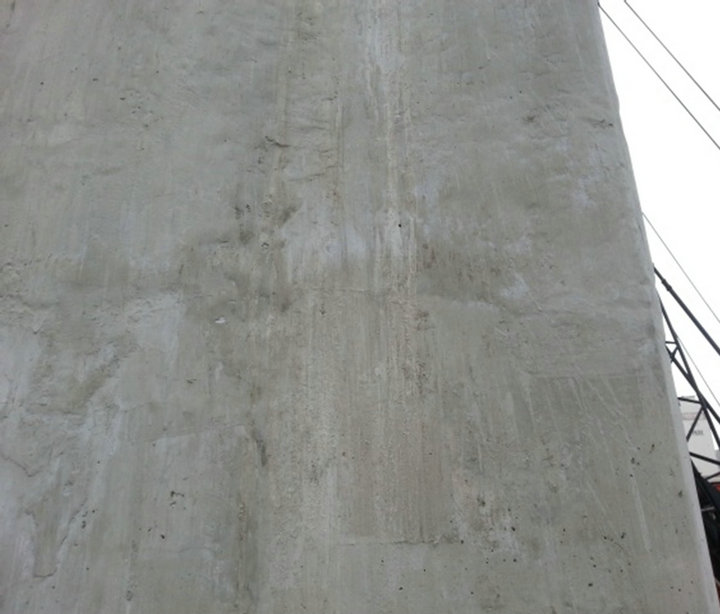
The photographs in Figures 15 present the surface of concrete corresponding to the climbing of the slip-form system before and after the surface wave velocity reached 1100 m/s. The surface of concrete in Figure 15(a) shows irregularities and shows traces of partial spalling whereas no particular problem is observed on the surface of concrete in Figure 15(b).
Figures 16 and 17 present the GPS and tiltmeter used for the shape control. The 10 m of the pylon was completed in 5 days after the placing of concrete (Figure 18).
5. Conclusions
This paper presented the technologies developed to secure the quality of concrete when slip forming is applied for the erection of pylons. To date, the slip-up of the slip form relied on the skilled experience of technicians. This study examined the method determining quantitatively the slip-up time of the slip form by estimating the early strength of concrete from the surface wave velocity measured by dedicated measurement devices attached at the bottom of the forms. In addition, lightweight GFRP panels were also developed to replace the traditional steel forms.
Mockup test was conducted to execute field verification of the developed techniques through the construction of 10 m-high pylon. The considered pylon exhibited rec-
 (a)
(a)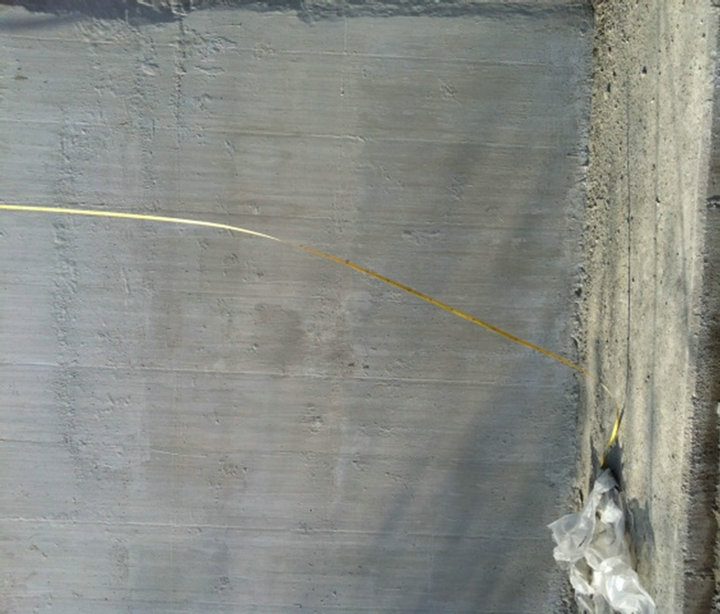 (b)
(b)
Figure 15. Surface of concrete. (a) Surface wave velocity < 1100 m/s; (b) Surface wave velocity > 1100 m/s.

Figure 16. GPS.
tangular hollow section as commonly adopted in cablesupported bridges and the developed GFRP panels were applied for the outer forms. The surface wave velocity
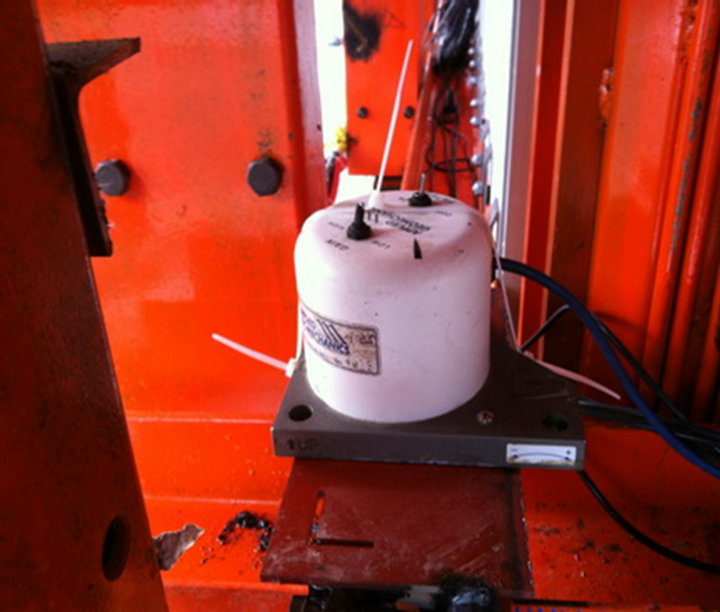
Figure 17. Tiltmeter.
 (a)
(a)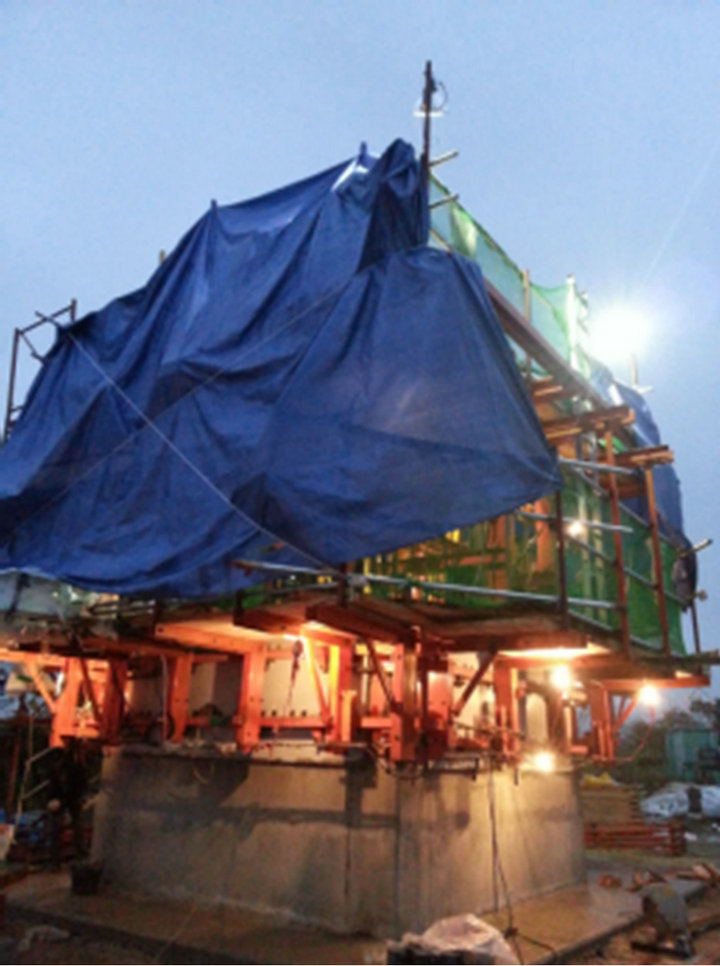 (b)
(b)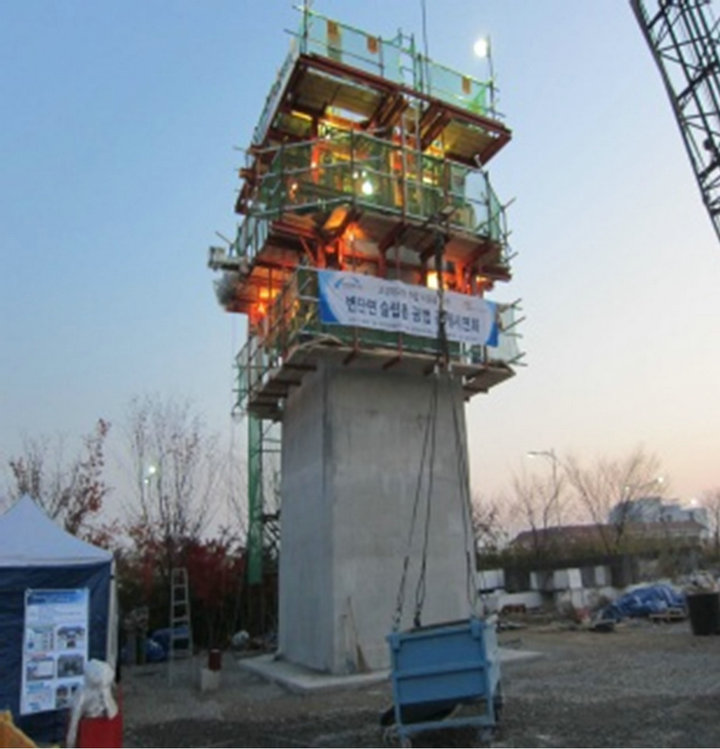 (c)
(c)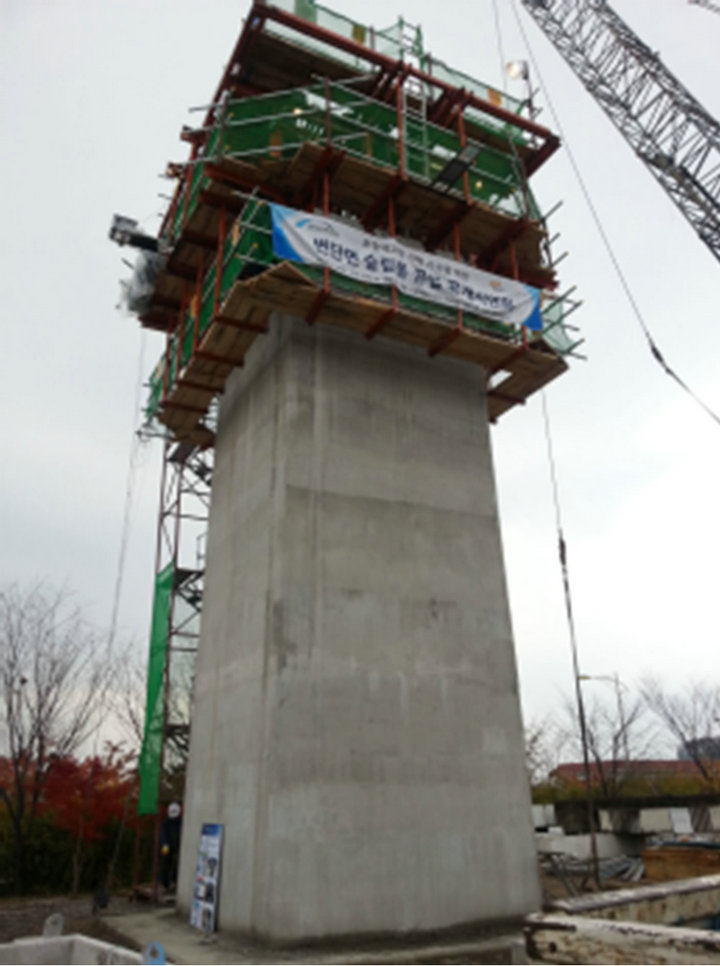 (d)
(d)
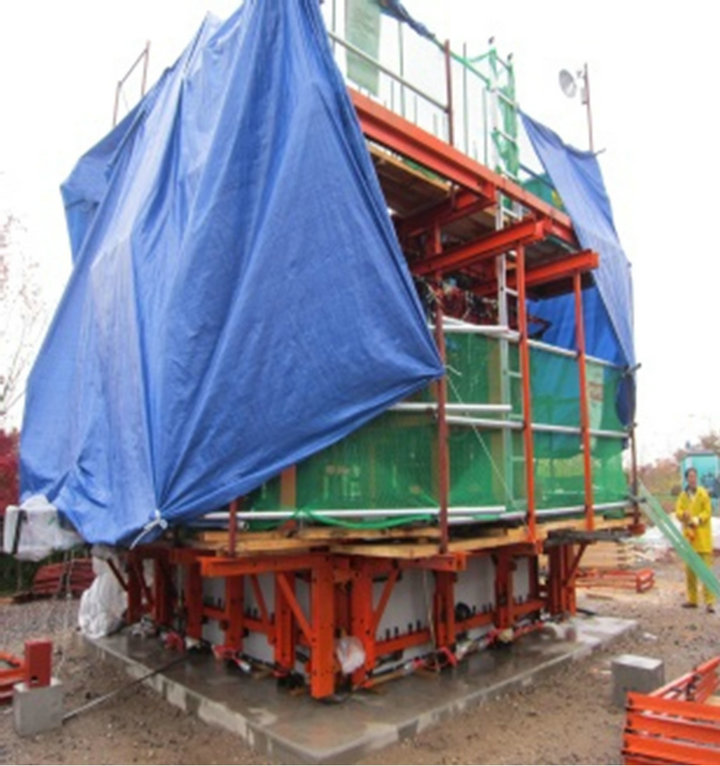
Figure 18. Mockup test of pylon. (a) Completed assembly of slip form; (b) 1st slip-up (1.5 m); (c) 3rd slip-up (5 m); (d) 5th slip-up (10 m).
was real-time monitored by means of devices attached at the bottom of the GFRP panels. The criterion for the slipup was determined to be the surface wave velocity of 1100 m/s considering the mix proportions and curing temperature of concrete. Slip-up was also conducted for different surface wave velocities to verify the difference in the quality of concrete with respect to the surface wave velocity. The 10 m-high pylon was successfully erected after 5 days of construction and enabled to demonstrate the efficiency of the developed slip form. Following, the developed tapered slip form was shown to be sufficiently applicable in the future for the erection of real pylons.
6. Acknowledgements
This paper was supported by the “Development of Accelerated Construction Technologies for High Pylons” project of the Super Long Span Bridge R&D Program. The authors express their gratitude for support.
REFERENCES
- Ministry of Construction and Transportation, “Standard Specification for Temporary Works,” Ministry of Construction and Transportation, 2006.
- Ministry of Land, Transport & Maritime Affairs, “Concrete Standard Specification,” Ministry of Land, Transport & Maritime Affairs, 2009.
- Ministry of Land, “Transport & Maritime Affairs,” Tunnel Standard Specification, Ministry of Land, Transport & Maritime Affairs, 2009.
- Korea Expressway Corporation, “Expressway Construction Guide Specification,” Korea Expressway Corporation, 2009.
- Korea Concrete Institute, “Manual of Concrete Practice,” Korea Concrete Institute, 2002.
- ACI 318-05, “Building Code Requirement for Structural Concrete and Commentary,” ACI 318, 2004
- ACI 347-04, “Guide to Formwork for Concrete,” ACI 347, 2005
- EM 1110-1-2009, “Engineering and Design Architectural Concrete,” EM, 1997.
- Korean Standards Association, “KS F 2436 Testing Method for Time of Setting of Concrete Mixture by Penetration Resistance,” 2007
- Z. Reichverger and C. Jaegermann, “Optimal Regime in Slip form Concreting,” Matériaux et Constructions, Vol. 18, No. 74, 1980, pp. 109-113. doi:10.1007/BF02473807
- H. Kim, Y. J. Kim, W. J. Chin and H. Yoon, “A Study on the Determination of Slip-Up Time for Slip-Form System using Surface Wave Velocity,” Journal of the Korean Society of Civil Engineers, Vol. 32, No. 5D, 2012, pp. 483- 492.
- H. Kim, “Mechanical Characteristics of GFRP Slip Form for in-Situ Application,” Ph.D. Thesis, Hanyang University, Seoul, 2012.