Engineering
Vol. 4 No. 7 (2012) , Article ID: 20545 , 4 pages DOI:10.4236/eng.2012.47047
Experimental Strain Investigation of Bolt Torque Effect in Mechanically Fastened Joints
Department of Engineering, Indiana University-Purdue University, Fort Wayne, USA
Email: younis@engr.ipfw.edu
Received March 10, 2012; revised May 2, 2012; accepted May 10, 2012
Keywords: Maximum Strains; Fastened Joint; Bolts Torque; Reflected Photoelasticity
ABSTRACT
In this study, a different issue of mechanical engineering interests is determined for threaded fastened joints. A series of photoelastic experiments were performed to determine the maximum strains for the holes in a tensile flat plate subjected to bolt-nut loads. Pertinent strain distributions were examined to determine the roll of the torques on the bolts in minimizing the strain; hence stress concentration. The experimental determination of maximum strains is needed as a way to validate future theoretical and numerical results, and provide a valuable aid to their application. The emphasis of this paper is on deformation. The results indicate that strains can decrease significantly with the increase of the bolt’s pre-load.
1. Introduction
1.1. SCF Background
It is becoming increasingly important to reduce the stress concentration factors (SCF) due to the presence of holes and other discontinuities in many design situations. As a result, many researchers have investigated the stress concentrations around holes in plates subjected to uniaxial tension [1]; the literature is bereft when describing the effect of mechanically fastened joints. Currently, the study of SCF around circular holes has reached a plateau. However, the quest for better, sophisticated, and stress relieved members continues almost exponentially. One method for reducing the stress concentration around a circular hole in a plate subjected to a uniaxial load is by introducing defense holes. A survey of the literature shows that this method has been the most studied. A number of techniques have been developed to reduce the stresses around holes. These include, for example, the analytical work of Tings, Chen, and Yang [2]; the numerical contributions by Meguid [3], and the experimental contributions [4]. Recently, numerical and experimental studies have been conducted to investigate the effect of reinforcements around circular cutouts on the stress concentration and buckling behavior of carbon/epoxy composite panel under in-plane shear load [5]. Liqing and Bingzheng [6] utilized the three dimensional finite element methods to solve the problem of the quarter-elliptical corner crack of the bolt-hole in mechanical joints subjected to remote tension. In 2011, Neuber’s theory was scrutinized, which equates the stress concentration factor in the periodic notch to the stress concentration factor in the single notch of like profile and lower depth [7]. A year later, the photoelastic method has been employed to determine SCF for square plates containing holes and inclined slots [8]. The photoelastic results confirmed the finite element predictions of Rees [9].
1.2. Bolted Joints
The bolted joint is a type of mechanical connection which is used commonly for the construction of many types of structures. In fact, bolted joints are important in most of the mechanical devices and machines used in modern society. Several authors have suggested both theoretical and experimental methods to determine member stiffness and the pressure distribution between the members of bolted joints. For example, Grosse and Mitchell [10] gave a general discussion of non-linearity in bolted joints due to the application of external loads as well as bolt thread and interfacial friction. Member stiffness and the stress distributions in the bolts and members of bolted joints have been calculated for various bolt sizes as well as thicknesses and materials of the members [11]. In 2000, Lehnhoff and Bunyard determined SCF for the threads and the bolt head fillet in a bolted connection [12]. They concluded that the results can provide important insight into the behavior of bolted connections. Barrett [13] shared his 34 years experience in fasteners and mechanical design by providing guidelines to reduce fastener’s stress risers.
Among his recommendations about threaded members, the threaded portion should have a minor diameter greater than the diameter of the unthreaded portion. This eliminates the SCF, as long as a generous transition radius is used between the two sections. A year later, the stress distribution in bolt-nut connectors was studied using an axisymmetric finite element model [14]. The design modifications included grooves and steps on the bolt and nut, and reducing the shank diameter of the bolt. Turvey and Wang’s [15] analysis showed that friction between the bolt shank and the hole as well as the small hole clearance are the principal factors which cause the zone of contact to increase with increasing tension; thus produce significant changes in the stress distributions at critical locations. The importance of the pre-tensioned force of bolts has been recognized by Gao and Kang in 2008 [16]. It was noted that the greater the force, the larger the region of stress redistribution around a roadway is affected.
1.3. Connections Mechanics
Common type of connections used for structural works are welded, riveted, bolted, and pin connections. Pinned connections are used to connect the members which are required to rotate relative to each other. A study of the pin and the plate material dissimilarity was done by Iyer [17]. A fiber steering technique was applied around the hole in carbon fiber reinforced plastics laminated composites to increase the bearing strength [18]. Okutan [19] carried out a numerical and experimental study to determine the effects of geometric parameters on failure. In 2005 [20], a three dimensional progressive damage model was developed by McCarthy et al. to show the significant effect of clearance on load distribution and damage mechanisms in the joint. In order to have a good evaluation of the stress distribution around the pin’s hole, design factors such as plate width, edge distance and clearance were varied during the analyses by Yavari et al. in 2009 [21]. Most recently, debonding and flexural behavior of beams strengthened by carbon fiber reinforced polymer (CFRP) plates were numerically investigated that was assisted by previously valuable experimental results [22]. Narmashiri et al. [23] presented a study on the effectiveness of using steel plates as well as bolts as end-anchors to address the CFRP problems. The results indicated that the anchored beams had higher load capacities and end-anchoring with closer bolt spacing was more effective. In 2011, a comparison between two and three dimensional modeling of strengthened steel Ibeams in static linear and non-linear analyses was presented in reference [24].
1.4. Problem Statement
The objective of this paper is to present the results of a study of the elastic field resulting from interacting circular holes with a bolt-fastener. Stress is a mathematical abstraction which cannot be measured. Strains, on the other hand, can be measured directly through well-established experimental procedures. The work aims at determining the strains around holes interacting with bolts at different bolts preload. This topic represents an important design issue because the introduction of assembly stresses results in reduction of SCF at the holes. Therefore, in the present program, the reflected photoelasticity method is utilized to determine maximum strain for tension of a plate with a circular hole displaced from the center by a distance L and approaching the fasteners as shown in Figure 1. The most significant advantage of choosing reflected photoelasticity, it is not necessary to model the realistic behavior of all elements involved in the study. Furthermore the experimental determination of strains is also needed as a way to validate future theoretical and numerical results, and provide a valuable aid to their application.
2. Theory
Reflected photoelasticity is based on the optical phenomenon of birefringence and the fringe order represents the difference in principal strains (maximum shear strain). The method is nondestructive and the coatings can be applied directly to the prototype. Thus, the need for models is eliminated.
The theory of transmitted photoelasticity (which requires modeling) is available in many literatures and indirectly has been extended to the reflection case. In this section, a first attempt to the theory of reflected photoelasticity is derived as pertains to this study as well as the instrumentations used.
2.1. Optical Mechanics
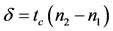
When a polarized beam propagates through a plastic coating of thickness tc, the light vector splits and two polarized beams are propagated in the plane. If the strain intensity along P1 and P2 are ε1 and ε2, the relative linear retardation between these two beams is [25]:
 (1)
(1)
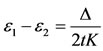
It is generally more convenient to express the relative retardation in radians. Thus, the relative angular phase shift D between the two components as they emerge from
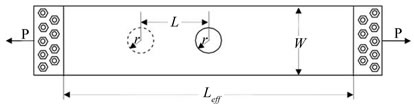
Figure 1. Specimen parameters.
the coating is given by:
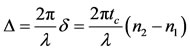 (2)
(2)
Maxwell’s law established that the changes in the indices of refraction are linearly proportional to the stresses in a linearly elastic material. The relationships for this in plane-stress study can be expressed in equation form as:
n1 – n0 = c1σ1 + c2σ2 (3a)
n2 – n0 = c1σ2 + c2σ1 (3b)
The method of photoelasticity makes use of relative changes in index of refraction which can be written by eliminating n0 from the above equation as:
n2 – n1 = c(σ1 – σ2) (4)
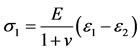
where c is the relative stress optic coefficient of the photoelastic coating [26]. In this study, readings are made at free boundaries of circular holes. Therefore, the maximum stress represents the stress tangent to the free surface because the stress perpendicular to the edge is zero. Thus
n2 – n1 = cσ1 (5)
The relative retardation D accumulated along the principal plane direction can be obtained by substituting Equation (5) into Equation (2) to obtain:
 (6)
(6)
The well established strain calibration method used in this study is outlined in reference [27] due to its high accuracy. In this instance it is preferable to work in terms of strain instead of stress and thus the SCF is beyond the scope of this paper. The maximum normal stress can be determined from:
 (7)
(7)
Substituting Equation (7) into (6) yields:
 (8)
(8)
 (9)
(9)
2.2. Reflected Photoelasticity
A polariscope is an instrument that measures the relative retardations resulting from a polarized light reflects from the photostress coating. The simplest arrangement consists of polarizer, coating, and analyzer as shown in Figure 2. The plane-polarized light beam emerging from the polarizer can be represented by:
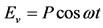 (10)
(10)
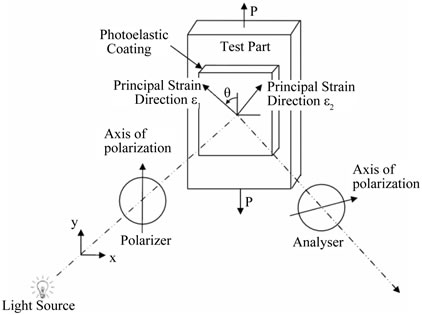
Figure 2. Loaded photoelastic coating in a plane polariscope.
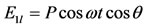
The stressed coating exhibits the optical properties of a wave plate. Therefore, the plane-polarized light vector is resolved into two components with vibrations parallel to the principal strains that their difference at the edge of hole will be measured in this research program.
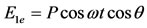 (11a)
(11a)
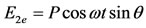 (11b)
(11b)
In reflecting from the coating the components suffer retardation Δ of Equation (6). The condition of the light is:
 (12a)
(12a)
 (12b)
(12b)
Since the vertical components are internally absorbed in the analyzer, the horizontal components of the waves will interfere to produce an emerging ray Ex:
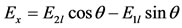 (13)
(13)
Substituting of Equation (12) into Equation (13) yields
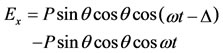 (14)
(14)
Expanding cos(ωt–∆) we may write the emerging from analyzer light vector in the form
 (15)
(15)
Since the direction of the principal strains at the edge of the hole is known, the subject of isoclinic fringes will not be discussed here. When a stressed photostress coating is placed in the field of circular polariscope, the optical effects differ from those obtained in a plane polariscope. However, adding optical filters (quarter-wave) in the path of propagating light produces circularly polarized light and the image observed is no longer influenced by the principal plane. Since the axes of the quarter-wave plate are oriented at 45˚ with respect to the axis of the polarizer, the light vector emerging from the analyzer of a circular polariscope is:
 (16)
(16)
Utilizing the fact that light intensity is proportional to the square of the amplitude of the light wave, the intensity of light emerging shown in Figure 3 will be:
 (17)
(17)
This result indicates that the intensity of the light beam emerging from the circular reflection polariscope is function only of the principal strain difference because the angle θ does not appear in the expression for the amplitude of the reflected wave. Equation shows that extincttion (I = 0) will occur when Δ/2 = Nπ where N is 1, 2, 3, etc. From Equation (8), the principal strain difference (maximum shear strain) is obtained by:
 (18)
(18)
The principal strains are the ones in the coating and metal surface. The fringe value f (contains all constants) specifies the strain-optic sensitivity of the coating taking into account the thickness of the coating, the nature of the light source and the fact that the light transverses the coating twice.
3. Experiments
3.1. Design of Experiment
In this section, important elements of the experimental
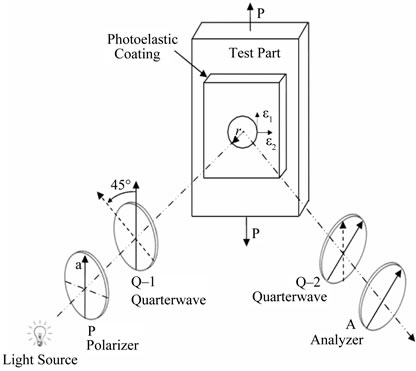
Figure 3. Loaded photoelastic coating in a circular polariscope.
design are outlined through discussion of the method of measurement, the uncertainty in expected results, and the choice of specimens. The experiment design protocol used was as outlined by Holman [28]. The type of experiment is testing according to accepted method because there are accepted procedures for determining maximum shear strain utilizing optical methods. The method of photoelasticity was used because it inherently provides information in the vicinity of stress raisers as well as it is a full-field solution for strain analysis testing. The photoelastic fringe pattern is also rich with information and insights for the design engineer. The method allows testing of the actual product or structure under actual working loads at room temperature. In this study, the method was chosen so that the effects of fastened joint on the strain can be determined without assumptions.
The measured quantities needed to calculate maximum strain were: mechanical properties of the material, specimen’s dimensions, and photoelastic parameters. The determination of the properties (modulus of elasticity and Poisson’s ratio) and the measurement of the dimensions (width, thickness, and hole diameter) can be achieved easily with very high accuracy. Uncertainty in the anticipated fringe patterns and values necessitated the determination of an estimate of the range of the strains around the hole. This was essential in selecting the photoelastic coating. Assuming a linear strain field resulting from the joint strain ϵj, the initial estimate of the maximum strain ϵ1 was calculated as:
ϵ1 = ϵw/o – ϵj (19)
ϵw/o is the strain at the hole neglecting the joint effect. The joint strain was estimated from:
ϵj = ϵb + ϵc (20)
ϵb and ϵc are the bearing and contact strains, respectively. The above calculations indicated that a mediumhigh sensitivity coating of a thickness range 2.8 - 3.3 mm was needed. The preliminary calculations of the bolt’s stress and contact stress between the fastener joints and the test plates resulted in the design of the testing plate with the dimensions shown in Figure 4. The uncertainty in the interaction between the different stress fields led to initially design the bolts arrangements in a single row. Initial fringe patterns indicated that bending of the plate could happen. Thus, the arrangement of the bolts was modified to the one shown in Figure 4.
3.2. Error Analysis
Instrumentation systems have in common an intrinsic characteristic which inevitably limits their accuracy in varying ways and degrees, and reflected photoelasticity is not an exception. This characteristic is the tendency to respond to other variables in the environment in addition
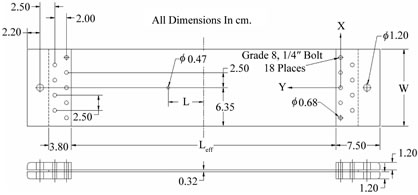
Figure 4. Detailed geometry of bolted connection.
to the variables under investigation. Since many variables contribute to the maximum shearing strain around the hole in this study, the effect of the ratio of the hole size to the plate’s width is beyond the scope of this paper. However, to significantly reduce the interaction between the plate’s width and the hole’s size, the ratio r/W was chosen based on the recommendation of reference [29]. The inherent errors related to the strain measurements at room temperature in this study are:
1) Pseudo Birefringence: The appearance of residual birefringence is inevitable under certain circumstances. The possible pseudo birefringence in this study is due to the contouring process used to create the coating around the hole. The coating must match and be perpendicular to the boundary of the plate; especially it is important around any discontinuity. Therefore, the holes were drilled through the coating and the plate. The author’s experience indicates that this procedure provides better matching of the edges of the coating and the boundary of the test part at the hole than to precut a hole in the plastic before bonding. The absence of residual birefringence supports the simple proposed technique. If residual birefringence existed, it can be eliminated by applying a small compressive load and the zero load level is taken as the point at which the pseudo birefringence disappears.
2) Reinforcement effects: This includes the Poisson’s ratio mismatch for coating and aluminum specimens, rigidity increase, and strain variation through thickness [30]. Considering the forces on coated and uncoated elements, one can obtain the theoretical correction factor as:
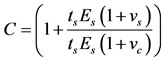 (21)
(21)
The corrections to photoelastic coating fringe order measurements outlined in reference [31] were followed in this experimental strain analysis study.
3.3. Test Specimens Details
Many aluminum specimens with different lengths, widths, and hole locations were considered in this investigation. Two sets of specimens, each consisting of ten plates, were studied. The effective length (Leff), width, and thickness of the machined specimens for the first set (Sone) were 49.6 cm, 12.8 cm, and 0.32 cm respectively. There was a 0.47 cm diameter hole bored through each plate at different locations. The effect of the edges on the stresses around the hole was kept small by holding the ratio of r/W to less than 0.0375. For the second set (Stwo), the plates were 34.2 cm long, 11.43 cm wide and 0.32 cm thick and the hole diameter was 0.32 cm. Nine SAE grade eight type bolts and nuts on each end were used. The torque on all the screws was kept the same at each applied torque. After the plate’s surface was prepared, a 3.0 ± 0.05 mm thick PS-1A photoelastic sheet was bonded to the surface of the plate. The combination of the thickness and the type of coating chosen was to obtain a low fringe value or more sensitive coating.
Two specimens from each set were coated entirely and the remaining eight were coated approximately 60% - 75% of the free surface. This allowed the use of the same sheet of photoelastic material, hence reducing the variables in the experiments. When the test part extended beyond the edge of the photoelastic coating, the edges were beveled at 45 degrees to eliminate any undesired stress concentrations at the edges.
4. Discussion of the Results
Testing procedures were performed to evaluate the significance of the parameters influencing the data and to facilitate an engineering assessment of the results obtained.
4.1. Strain Field
Utilizing the photoelastic images, the development of Saint-Venant’s stress region was presented in 2010 [32]. Therefore, the photoelastic coating was marked with a point every 5 mm horizontally and vertically close to the joint and 10 to 20 mm away from the threaded joint. The plates without holes were subjected to axial tensile loads while the bolt’s preload was kept constant, finger tied. During the difference in principal strains (maximum shear strain) acquisition, the fringe patterns were studied to identify the effects of the fasteners and fastener joints. Approximately, symmetry of the fringe patterns about the vertical centerline of the specimens and the horizontal centerline was noticed utilizing the entirely coated two plates.
Next, the bolt’s preload was varied. It is not practical to give a detailed strain distribution for each load in this paper, but the results in Figure 5 of Sone plates are presented as a typical example. The maximum shear strain is for a tensile load of 22,000 N and the torque on each bolt is 6.8 N.m. Theoretically, for a plate loaded in tension, the strains over the entire plate should be uniform. It is
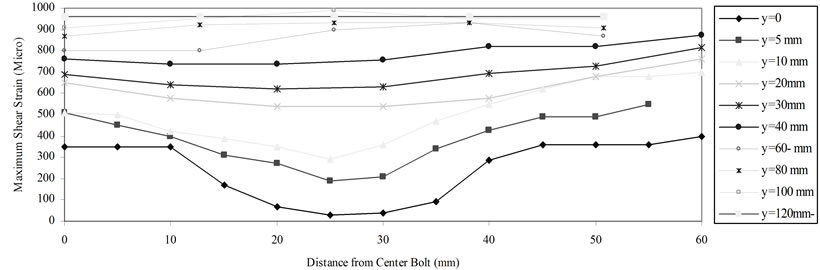
Figure 5. Strain in the plate without hole.
clear that the strains close to the plate’s center are constant and in agreement with the theoretical ones. However, the difference in principal strains (hence the stresses) varies rapidly in the vicinity of the threaded joint. This deviation is due to the bolted fasteners. Interestingly, the plate’s strains near the center bolt are approximately zero. This low strain zone will house part of the holes in four specimens. Bearing stresses are developed on surfaces of contact where the shank or threaded parts of bolts are pressed against the sides of the hole through which they press. Since the distribution of these forces for even a single bolt is complicated, an average bearing stress is often used in the literature for design purposes.
This stress is usually computed by dividing the force transmitted across the surface of contact by the projected area A = dbt where db is the bolt diameter. Clearly, Figure 5 shows that the customary assumption that the bearing stresses are uniformly distributed is not always accurate in many practical applications. It was noted during the strain development acquisition phase that the fasteners and fastener joints affect Stwo plates more than that of the Sone. This is because Stwo plates are shorter, thus less material to absorb the bearing and contact forces.
4.2. Effect of Hole’s Location
Holes were bored at different locations and the distribution of the tangential strain about the boundary of the holes was studied. Each specimen was incrementally loaded at various levels with the maximum stress being kept below the yield strength. The torque was varied from 0 to 8.5 N.m in the experiments. In general, it was noticed that the strain distribution is linear and increases as the hole approaches the center except for the lowest applied load of 4500 N. This deviation was attributed to the fact that the deformation was very small and the coating’s strain sensitivity is low at this loading level. The reduction of strain concept is further enhanced in Figure 6. The Sone images are for a same size hole that are both loaded at 5720 N.
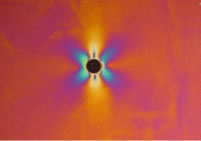
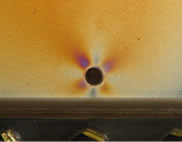
Figure 6. Maximum strain comparison (same load and size).
The variations of peak strains with the loads showed the same general trends in the specimens. The effect of the geometric parameter (L/r) on the maximum shear strain around the hole is shown in Figure 7. This distribution is for Sone specimens with a load of 14,500 N and a torque of 2.7 N.m. It is clear that both the maximum tensile and compressive strains decreased as the hole was off-center. However, the strain increased as the hole approached the edge of the plate where it was held by the bolted fastener but still below the ones associated with the holes close to the center. This was due to the fact that the area between the edges of the hole and bolted plates was very small; to increase the stress at the same time, the other plates increase the stiffness, which reduces the stresses. Next, strain analysis in the vicinity of the holes for the Stwo specimens was performed. Generally, the trends of the results are the same for both groups. The results indicate that it is advantageous to use the compressive nature of the bolted joints to reduce the strain (stress) around a circular hole.
4.3. Effect of Torque
Bolt-nut connectors play an important role in the safety and reliability of structural systems. In this section, the torque in bolt-nut connectors is studied to determine the extent to which it reduces strains and thus stress concentrations. Figures 8-11 are examples of how the maximum shear strain varies as a function of the bolt’s torque in Stwo specimens.
It is noted that the torque effect is minimal when the
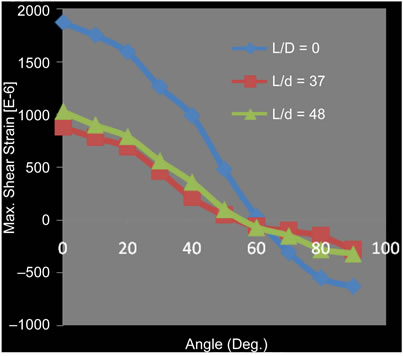
Figure 7. Distribution of strain along hole circumference.
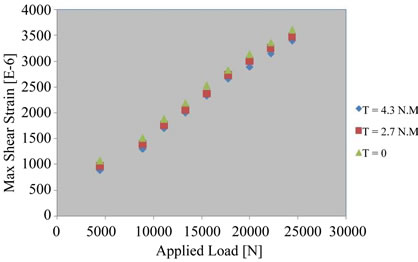
Figure 8. Effect of torque on strain for L/r = 30.
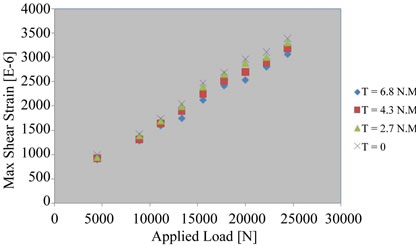
Figure 9. Effect of torque on strain for L/r = 35.
hole is away from the bolts. Figure 8 shows the effect of various torques on the maximum strain around the hole for L/r = 30 in which the strain decreases with increasing torque up to T = 4.3 N.m. The effect of higher torque can be observed as L/d increases to 35 as shown in Figure 9. It can be seen that the strain consistently decreases with an increase of the torque. This demonstrates that higher torques increase the compressive bearing stress which is
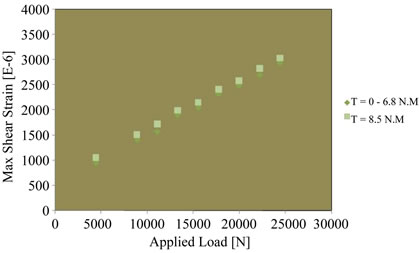
Figure 10. Effect of torque on strain for L/d = 42.5.
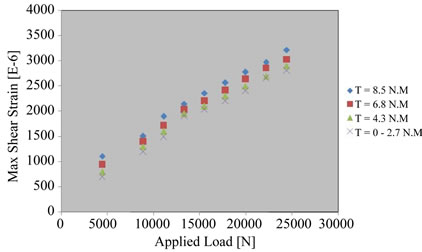
Figure 11. Strain distribution very close to the fastener (L/r = 50).
in the same direction as the applied load.
This analysis takes into account the bolt-hole clearance as well as the friction at the contact surfaces between the bolt shank and the inserting hole. This friction is the principal factor that causes the zone of the bearing area distribution. Regarding the strain dependence on higher torque, it was observed that the effect of T = 8.5 N.m became apparent as L/d increased.
Figure 10 illustrates the effect of torques on strain as the hole approaches the joint, L/r = 42.5. Although the strain continues to decrease, the difference between the previous torques significantly diminished as the strains are so nearly the same that they are overlapped.
Furthermore, the influence of the contact stress on the results is significant. It can be found from Figure 11, L/r = 50, the effect of the compressive stress on the fastener joints has introduced the three-dimensional stress as evident by changing the trend of the maximum shear strain. The strain increases as a result of both the hole approaching the fastener and the increase in torque.
It is important to remember that the ratio of the hole diameter-to-the width of the plate was constant. Interaction between the different strain fields could result in different regions. It is evident from figures that the maximum shear strain around the hole decreased as the hole moved toward the fastened joint, but increased as the hole approached the edge of the plate where it was held by the threaded fixture. At the center of the plate, only the applied tensile axial stress is affecting the strains (stresses) around the hole. The maximum shear strain decreased as the hole was off-center due to the presence of the compressive bearing stress that is superimposed the axial stress. As an example, for a torque of 4.3 N.m, the maximum shear strain affected by the bearing stress (L/r = 48) is 53% less than that of the central hole.
5. Conclusions
The reflected photoelasticity method is utilized to study the reduction of strains in a mechanically fastened joint. The complication of realistic deformation modeling is eliminated because the coatings can be applied directly to the prototype. Several specimens are manufactured to predict the strain near a hole at different locations. The study takes into account the preload on the fasteners and fastener joints. All stresses (axial, bearing, contact, and bolts) aspects are investigated for each specimen to show how these stresses interact in rather complicated manner. The following observations have been made in the course of conducting this study:
1) The strain increases almost linearly and smoothly as the load increases for each specimen even when the torque exceeds the recommended preload for reused connection. An engineer must decide on the advantage of a preload in reducing strain (hence SCF) around a hole and the fatigue life of the bolt.
2) The influence of the bolt’s torque is significant in the resulting strain. Low torques imply greater strain in the region where L/r is between 30 and 40. However, larger torques increases strain in the close proximity of a mechanical fastened joint. In spite of this increase, the maximum shear strain is still below the ones close to the center of the plate.
3) The interaction between axial, bearing, bolts, and contact stresses is dependent on the hole’s location.
4) Friction between the bolt shank and the hole is the principal factor which causes the zone of contact that affect the strain around a hole in the plate.
5) Drilling a hole near a fastener is a practical solution in reducing stresses around holes. A combination of a hole location and a bolt preload can reduce the strain by more than 50%. The results provide insight into reducing SCF as a result of threaded assembly stresses.
Finally, the results of this research should be applicable to many plate design problems where the plate is held by a bolted joint.
REFERENCES
- N. T. Younis, “Bolt Preload Effects on Stresses around Circular Holes,” Proceedings of the 7th Jordanian International Mechanical Engineering Conference, Amman, Jordan, 2010.
- K. T. Chen, K. Ting and W. S. Yang, “Analysis of Stress Concentration Due to Irregular Ligaments in an Infinite Domain Containing a Row of Circular Holes,” Mechanics of Structures and Machines, Vol. 28, No. 1, 2000, pp. 65-84. doi:10.1081/SME-100100612
- S. A. Meguid and S. X. Gong, “Stress Concentration around Interacting Circular Holes: A Comparison between Theory and Experiments,” Engineering Fracture Mechanics, Vol. 44, No. 2, 2003, pp. 247-256. doi:10.1016/0013-7944(93)90049-X
- N. T. Younis, “Assembly Stress for the Reduction of Stress Concentration,” Mechanics Research Communications, Vol. 33, No. 6, 2006, pp. 837-845. doi:10.1016/j.mechrescom.2006.03.007
- S. J. Guo, “Stress Concentration and Buckling Behavior of Shear Loaded Composite Panels with Reinforced Cutouts,” Composite Structures, Vol. 80, No. 1, 2007, pp. 1-9. doi:10.1016/j.compstruct.2006.02.034
- W. Liqing and G. Bingzheng, “Numerical Computation of Stress Intensity Factors for Bolt-Hole Corner Crack in Mechanical Joints,” Chinese Journal of Aeronautics, Vol. 21, No. 5, 2008, pp. 411-416. doi:10.1016/S1000-9361(08)60053-9
- E. Dragoni and D. Castagenetti, “Concentration of Shear Stresses in Shallow Periodic Notches,” The Journal of Strain Analysis for Engineering Design, Vol. 46, No. 6, 2011, pp. 397-404. doi:10.1177/0309324711412152
- D. Rees and B. Taylor, “Stress Concentrations for Slotted Plates in Bi-Axial Stress,” Engineering, Vol. 4, No. 2, 2012, pp. 69-75. doi:10.4236/eng.2012.42009
- D. W. A. Rees, “Mechanics of Solids and Structures,” Imperial College Press, World Scientific, 2000.
- I. R. Grosse and L. D. Mitchell, “Nonlinear Axial Stiffness Characteristics of Axisymmetric Bolted Joints,” ASME Journal of Mechanical Design, Vol. 112, No. 3, 1990, pp. 442-449. doi:10.1115/1.2912628
- T. F. Lehnhoff, K. Ko and M. L. McKay, “Member Stiffness and Contact Pressure Distribution of Bolted Joints,” Journal of Mechanical Design, Vol. 116, No. 2, 1994, pp. 550-557. doi:10.1115/1.2919413
- T. F. Lehnhoff and B. A. Bunyard, “Bolt Thread and Head Fillet Stress Concentration Factors,” Journal of Pressure Vessel Technology, Vol. 122, No. 2, 2000, pp. 180-185. doi:10.1115/1.556168
- R. T. Barrett, “Stress Concentration Factors for Fasteners and Fastener Joints,” American Fastener Journal, Vol. 22, 2005, pp. 60-61.
- S. Venkatesan and G. L. Kinzel, “Reduction of Stress Concentration in Bolt-Nut Connectors,” Journal of Mechanical Design, Vol. 128, No. 6, 2006, pp. 1337-1342. doi:10.1115/1.2336254
- G. J. Turvey and P. Wang, “An FE Analysis of the Stresses in Pultruded GRP Single-Bolt Tension Joints and Their Implications for Joint Design,” Computers and Structures, Vol. 86, No. 9, 2008, pp. 1014-1021. doi:10.1016/j.compstruc.2007.04.026
- F. Gao and H. Kang, “Effect of Pre-Tensioned Rock Bolts on Stress Redistribution around a Roadway,” Journal of China University of Mining and Technology, Vol. 18, No. 4, 2008, pp. 509-515. doi:10.1016/S1006-1266(08)60285-0
- K. Iyer, “Solutions for Contact in Pinned Connections,” International Journal of Solids Structure, Vol. 38, No. 50-51, 2001, pp. 9133-9148. doi:10.1016/S0020-7683(01)00054-3
- R. Li, D. Kellyand and A. Crosky, “A Strength Improvement by Fiber Steering around a Pin Loaded Hole,” Composite Structure, Vol. 57, No. 1-4, 2002, pp. 377-383. doi:10.1016/S0263-8223(02)00105-8
- B. Okutan, “The Effect of Geometric Parameters on the Failure Strength for Pin-Loaded Multi-Directional FiberGlass Reinforced Epoxy Laminate,” Composites, Vol. 33, No. 8, 2002, pp. 567-578. doi:10.1016/S1359-8368(02)00054-9
- C. T. McCarthy, M. A. McCarthy and V. P. Lawlor, “Progressive Damage Analysis of Multi-Bolt Composite Joints with Variable Hole Clearance,” Composites, Vol. 36, No. 4, 2005, pp. 290-305. doi:10.1016/j.compositesb.2004.11.003
- V. Yavari, I. Rajabi, F. Daneshavar and M. H. Kadivar, “On the Stress Distribution around the Hole in Mechanically Fastened Joints,” Mechanics Research Communications, Vol. 36, No. 4, 2009, pp. 373-380. doi:10.1016/j.mechrescom.2008.10.005
- M. H. Seleem, I. A. Sharaky and H. E. Sallam, “Flexural Behavior of Steel Beams Strengthened by Carbon Fiber Reinforced Polymer Plates-Three Dimensional Finite Element Simulation,” Materials and Design, Vol. 31, No. 3, 2010, pp. 1317-1324. doi:10.1016/j.matdes.2009.09.010
- K. Narmashiri, M. Z. Jumaat and N. H. Sulong, “Investigation on End Anchoring of CFRP Strengthened Steel I-Beams,” International Journal of the Physical Sciences, Vol. 5, No. 9, 2010, pp. 1360-1371.
- K. Narmashiri and M. Z. Jumaat, “Reinforced Steel I-Beams: A Comparison Between 2D and 3D Simulation,” Simulation Modeling Practice and Theory, Vol. 19, No. 1, 2011, pp. 564-585. doi:10.1016/j.simpat.2010.08.012
- J. W. Dally and W. F. Riley, “Experimental Stress Analysis,” Third Edition, McGraw Hill, 1991.
- N. T. Younis and L. W. Zachary, “A New Technique for the Determination of Stress-Optical Constants Using the Shadow Spot Method,” Experimental Mechanics, Vol. 29, No. 1, 1989, pp. 75-79. doi:10.1007/BF02327785
- Vishay Measurements Group Inc., “Calibration of Photoelastic Coatings,” Technical Note TN-701, 1977.
- J. P. Holman, “Experimental Methods for Engineers,” McGraw Hill, 2001.
- N. T. Younis, “Designing an Optical Force Transducer,” Optical Engineering, Vol. 42, No. 1, 2003, pp. 151-158. doi:10.1117/1.1526472
- I. Alfirevic, F. Matejicek and Z. Vnucec, “Numerical Examination of the Strain Gradient Effect on Accuracy of Birefringent Coating Method,” Transactions on FAMENA, Vol. 24, 2000, pp. 11-20.
- Vishay Measurements Group Inc., “Corrections to Photoelastic Coatings Fringe-Order Measurements,” Technical Note TN-706, 2005.
- N. T. Younis, “Visualized Photoelastic Images for Stress Concentration Instruction” The 2010 Annual ASEE Conference, Louisville.
Nomenclature
c, s: Coating, specimen
P1, P2: Direction of principal strains
ϵ1, ϵ2: In-plane principal strains
tc, ts: Photoelastic coating thickness, specimen thickness
n1, n2: Principal indices of refraction which coincide with the principal directions
no: Index of refraction of material; in unstressed state
λ: Wave length
c1, c2: Stress optical coefficient
σ1, σ2: In-plane principal stresses at a point
E, ν: Young’s modulus, Poisson’s ratio
ω: Angular frequency
θ: Angle between axis of polarization and incident light vector
N: Fringe order