Engineering
Vol. 4 No. 5 (2012) , Article ID: 19307 , 10 pages DOI:10.4236/eng.2012.45034
Analysis, Modeling and Simulation of a Poly-Bag Manufacturing System
1Department Mechanical Engineering, University of Moratuwa, Kaubedda, Sri Lanka
2Department of Textile and Clothing Technology, University of Moratuwa, Kaubedda, Sri Lanka
Email: gopura@mech.mrt.ac.lk, jaya@uom.lk
Received February 7, 2012; revised February 17, 2012; accepted March 25, 2012
Keywords: Poly-Bag; Manufacturing System; Monte Carlo Sampling; System Simulation
ABSTRACT
The cost of raw material of poly-bags increases and fluctuates with an unpredictable trend. Further, legal restrictions imposed on some types of polythene products adversely affects for the demand. In this context, entrepreneurs engaging in poly-bag manufacturing face major challenges. With the purview of optimizing the poly-bag manufacturing process, authors attempted to analyze, model and simulate the poly-bag manufacturing process in the light of posed challenges. This paper presents preliminary analysis, modeling and simulation strategies of a poly-bag manufacturing system. In addition, a risk prioritization method is proposed in the preliminary analysis and also a simulation tool is developed.
1. Introduction
The raw material prices of poly-bags increase continuously with a high degree of fluctuation. Hence, the forecasting of material prices with adequate accuracy is a really challenge. Since the level of price fluctuation is so severe, sometimes it is lucrative to purchase raw materials in massive quantities during the low price periods and store them for the future use. The backward integration is quite difficult to achieve with the amount of raw material purchases, and difficulty in predicting the raw material prices with adequate accuracy make the situation worse. In addition, legal restrictions imposed on some types of polythene products have a serious adverse effect on the demand for the products. Therefore, any constructive contribution in the poly-bag manufacturing value chain has a great impact to its productivity. When switching from one product to another, parameters in poly-bag manufacturing system have to be varied and it is associated with a considerable set up time as well as a substantial amount of raw material waste. The fluctuation of raw material prices has caused serious problems in current inventory control practice and it is a great barrier to adapt popular lean manufacturing techniques in the production system. In order to face the posed challenges successfully, a poly-bag manufacturing system needs to have an in depth analysis of the production process, so that solutions can be recommend in the light of posed challenges.
Various categories of polyethylene [i.e., high density polyethylene (HDPE), low density polyethylene (LDPE)and linear low density polyethylene (LLDPE)] and polypropylene (PP) are basically used as raw materials for the poly-bag manufacturing [1]. The main process is the film blowing [1,2]. It was followed by subsequent processes namely cutting, sealing, printing, quality checking (QC), and packing. The majority of the research in the area of poly-bag manufacturing has been concerned in a single process: the film blowing [3-5]. In the film blowing, a significant work has been carried out to show interaction of the polymer rheology with the process [4]. Relatively, little work has been done in modeling and simulation of poly-bag manufacturing system. However, few researchers have been tried out to simulate manufacturing processes [6-8]. Brown and his colleagues [6] implemented performance modeling capability (simulation, capacity analysis, and cost analysis) at factories of Siemens Semiconductor for both wafer fabrication and back-end operations. Graul et al., 2003 [7] presented a concept and a framework to capture and maintain the multiple descriptions and its applicability in modeling and simulation of manufacturing systems. They explained a knowledgebased approach to support the integration of multiple descriptions with collected data from legacy status for the use in the design and generation of valid simulation models. Starting with a short analysis of the current situation in the field of factory simulation and an overview of current tendencies in the manufacturing area, Schumann [8] introduced a method to integrate High Level Architecture (HLA) and existing simulation tools. They presented the simulation tool SLX [9] and the visualization tool Skopeo [10], which were both utilized to perform a prototype federation of a manufacturing plant.
In this study, initially a typical poly-bag manufacturing system is analyzed [11] to identify strengths, weaknesses, opportunities, and threats of the system. Further, risks and bottlenecks analysis were carried out in the preliminary stage to identify the risks and bottlenecks of the selected poly-bag manufacturing system. A risk prioritization method is also proposed in the risk analysis. The risks are prioritized based on their effects for the system. Then a mathematical model of the poly-bag manufacturing system is developed with reasonable assumptions to obtain the optimum throughput time of a given type of a poly-bag under available plant capabilities and to minimize the material wastage under current production setup. The system is simulated using the mathematical model developed. The production schedule for maximum productivity is generated for the input customer orders. For simulation, a graphical user interface (GUI) driven simulation tool is developed using MATLAB 7.2 software [12].
First two figures give you a brief outline of the polybag manufacturing process before proceeding to the core of the research work. Figure 1 shows the simplified film blowing process [1,2]. In film blowing, single screw extruder melts the polymer and pumps it into a tubular die and air is blown into the center of the extruded tube causing an expansion in the radial direction. Radial and downstream extension stops at freeze line due to crystallization. Nip rolls collect the film and seal the top of the bubble to maintain inside pressure. Figure 2 gives the simplified production process flow diagram of a poly-bag manufacturing system [11] and it has four key subsequent processes: film extrusion, printing, cutting and sealing, QC and packing. The films produced in the film blowing is printed and inspected. Then poly-bag making is carried out by cutting and sealing of the films. Quality checking and inspection end the poly-bag manufacturing process.
Next section of the paper presents the preliminary analysis. Section 3 describes the mathematical model development and Section 4 presents the system simulation. Section 5 demonstrates the simulation results followed by a discussion.
2. Preliminary Analysis
The network diagram of the selected poly-bag manufacturing system is shown in Figure 3 and it depicts the actual production channels of the selected typical polybag manufacturing company. The selected poly-bag manufacturing system is a multi-channel and multi-phase system with buffer storages in work in progress (WIP) at three places: after extrusion of film, after printing, and prior to quality checking.
Although the film extrusion process is a continuous process, there is no online feeding mechanism to the printing machine and therefore, the film manufactured is accumulated on the film store until it is fed to the printing machines depending on the urgency of orders and the availability of printing machines. In case of frequently changing orders of small quantities, printing process is a bottleneck in the poly-bag manufacturing process.
At the beginning, a SWOT analysis [13] was carried out to discover the strengths, weaknesses, opportunities, and threats faced by the system. In addition, a risk analysis and a bottleneck analysis were carried out to identify the risks faced and bottlenecks impeding in the poly-bag manufacturing system [14]. The results of the analysis were used to propose suggestions to improve the polybag manufacturing system and to identify the characteristics of the system model to be developed for the simulation. In the analysis, the layout of the factory and the bag manufacturing process were visually inspected and the required data (demand, production, timing, etc.) were gathered. Few discussions were taken place with top management, factory manager, and few experienced labours.
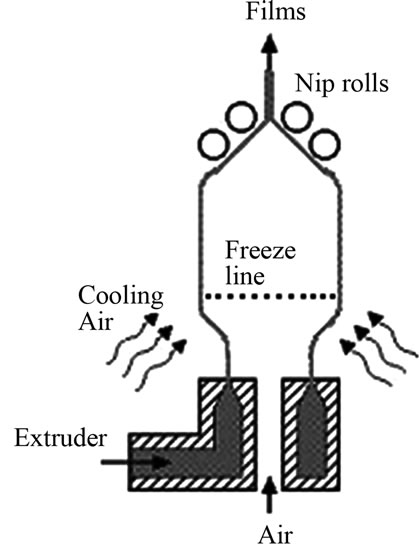
Figure 1. Simplified film blowing process.
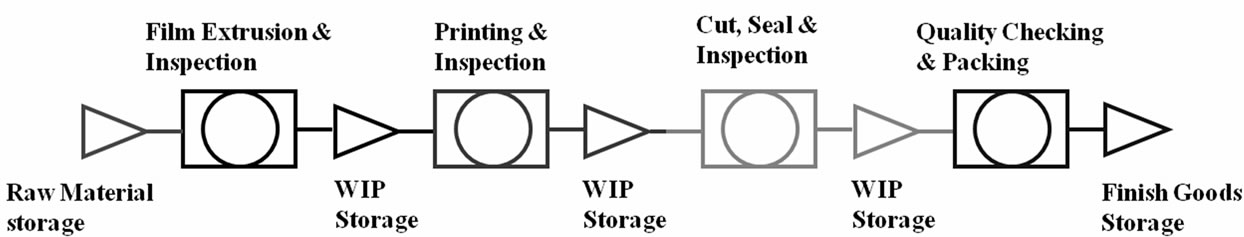
Figure 2. Simplified production process flow diagram.
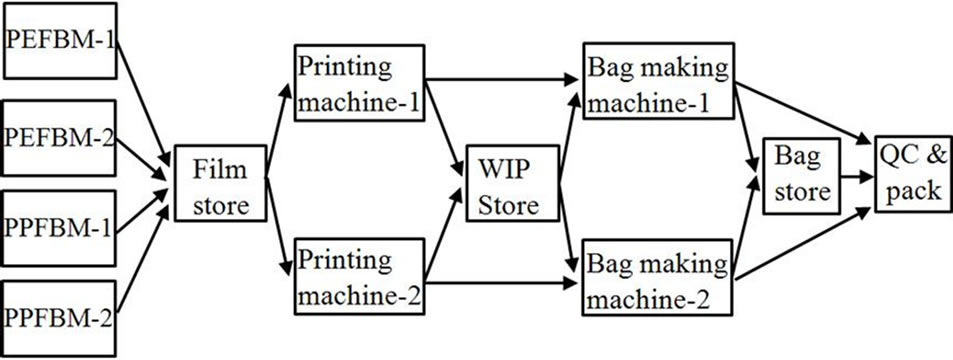
Figure 3. Network diagram of manufacturing system. PEFBM and PPFBM indicate Polyethylene Film Blowing Machine and Polypropylene Film Blowing Machine, respectively.
2.1. SWOT Analysis
The SWOT analysis was carried out and SWOT chart was drawn to indicate the strengths, weaknesses, opportunities and threats of the poly-bag manufacturing system. In the SWOT analysis, the strengths such as forward integration with member companies, availability of regular buyer base, relatively consistent number of buyers, well trained highly motivated staff, regular skill development, training and development programs, workshops, and international quality systems certification of ISO 9002 were identified. The main identified weaknesses of the system were higher wastage, improper line balancing, lack of inventory control, idling of production line, lack of record maintenance, relatively low productivity, and higher lead time. Opportunities and threats are from external origins. The opportunities for the system were identified as technical advancement of poly-bag manufacturing process, technology development of degradable poly-bags products, and boom in apparel manufacturing process creating a high demand for accessorized polybag industry.
The threats from external environment to the system were legal restrictions implemented for some types of poly-bag products, environmental issues, fluctuation of raw material prices, and lower prices offered by the competitors (price competition). In addition, some technical problems such as thickness controlling of films and higher machine setting time (mainly in printing section) were the other challenges faced by the poly-bag manufacturing system. The final SWOT chart developed is shown in Figure 4. The chart shows the strengths, weaknesses, opportunities, and threats and their origins.
2.2. Risk Analysis
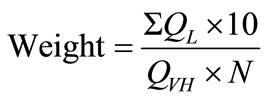
A risk analysis method was developed to identify the risks faced by the system. The problems that limit the manufacturing and business activities of the system were the risk of the system. If there was nothing to be done to reduce a bottleneck, the reasons of that bottleneck also become a risk. By investigating the problems that limit the activities of the system and unsolvable bottlenecksthe risks of the system could be identified. In the risk analysis, the risks affecting the manufacturing and the business of the system were identified and they were prioritized according to their impact on the system. Then weights were given from scale of 10 according to the priority of risks. The risk bar-chat was drawn from the weight values of risks to indicate the effect of risks. In the risk prioritization, the qualitative effect of each risk for the production and the business of the system were calculated under few criteria: productivity, performance, output, and profit. Since most of the data obtained were qualitative, a five-point “Likert scale” was used to find quantitative value of each criterion. The five-point “Likert scale” used is shown in Figure 5. Then the weighted averages of the quantitative values were calculated using the following equation.
 (1)
(1)
where QL, QVH, N are the quantitative value from “Likert scale”, the quantitative value of “Very High” in “Likert scale” and the numbers of criteria, respectively.
The identified risks for the system can be listed in descending order of priorities, from the highest priority as, a) increasing material prices; b) legal restrictions implemented for some types of poly-bags; c) environmental issues; d) price competition; e) increase of alterative product; and f) customers switching to alternatives.
Their estimated weight values were 7, 5.5, 5, 4.5, 4.5 and 3.5, respectively. Table 1 shows the quantitative values of risks. The results of risk analysis are shown in risk bar-chart of Figure 6. The chart shows the weight values and the risk priority of identified risks. a: increasing material prices, b: legal restrictions, c: environmental issues, d: price competition, e: increase of alternative products, f: customers switching to alternatives.
2.3. Bottleneck Analysis
In the bottleneck analysis [15], all the bottlenecks of the process that the system experienced were supposed to be found. All the places of the process where the actions are
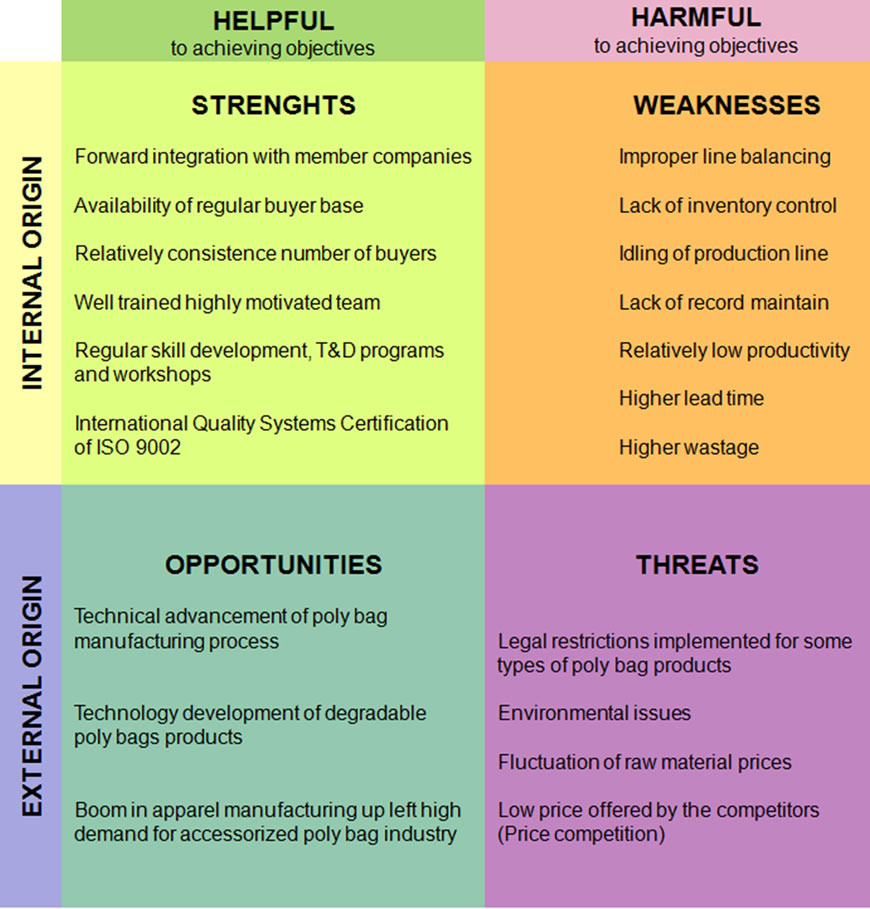
Figure 4. SWOT Chart.
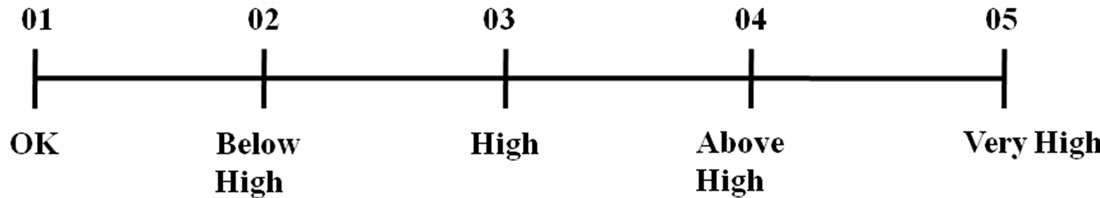
Figure 5. Five-point “Likert scale”.
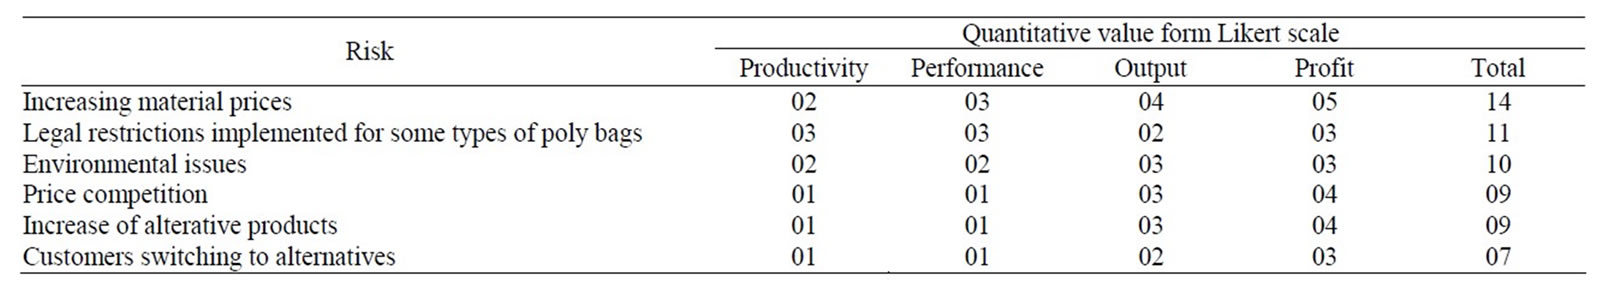
Table 1. Average quantitative values for each criterion.
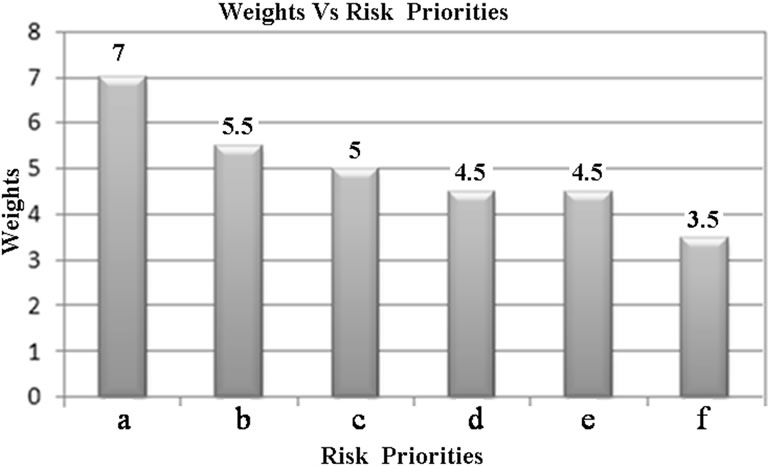
Figure 6. Risk bar-chart.
taken place were inspected and the tell-tail signs of bottlenecks such as poor response time, too long queue, insufficient resources, too slow actions, low capacity of machines etc. were examined. Then the reasons of telltails signs were further investigated. The reasons found from the investigation were the bottlenecks of the process. In the bottleneck analysis, the identified reasons for the bottlenecks were delay in quality checking, improper line balancing of two production lines, lack of inventory control especially in WIP, idling of production lines, and improper process layout.
The capacity/time vs. processing event chart was drawn for production of poly-bags to identify major bottleneck events. The capacity/time vs. processing event chart for a production of a particular polythene bag is shown in Figure 7 as an example. The chart shows the capacity/time for main processing events. Processing events are 1: film extrusion, 2: printing, 3: quality checking, 4: handling & packing. The size of selected bag was 52 cm x 15 cm with 150 units gauge. It has one colour print. The chart shows the production capacity per unit time of major processing events. From the chart, it was identified that the QC gives the lowest capacity/time. i.e., QC is the major bottleneck of the selected poly-bag manufacturing system.
3. Development of the Mathematical Model
Simulation of the system was carried out to study the system and further identify the problem of the system. For the simulation, a mathematical model was developed through a careful study of the manufacturing system. The objectives of modeling and simulation were the optimization of the production time for a given type of a polybag under available plant capabilities and to minimize the material wastage under current production setup. In addition, the production is scheduled for the system to achieve the maximum productivity. In a multi-phase production system, the total time to produce a given item is the summation of the time required at individual phase and the time duration required in switching between the phases if applicable. In the poly-bag manufacturing system, total time to produce a given type of a poly-bag is the summation of times of film extrusion, film storage, printing, WIP storage, bag making, QC, and setup at each operation. Since the setup time is for a large number of bags, unit setup time can be neglected as compared to the time concedes for other operations. Sub-model of each event of manufacturing will be described in next subsections. In the development of sub-models, time to produce a unit length was used as the basis to accommodate different sizes of bags conveniently into the model. The final sub section is dedicated to the generation of an
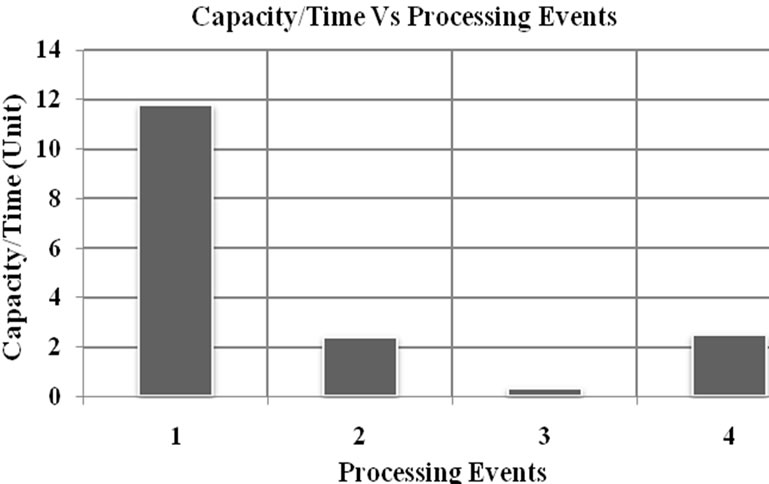
Figure 7. Capacity chart.
optimum production schedule. The objective of scheduling is to achieve the maximum productivity or find a schedule that minimizes the make-span of the jobs. Therefore, the optimum production scheduling becomes a problem of job shop scheduling. Considering the lead time and number of machines, small instant job shopping scheduling is selected for the scheduling problem.
3.1. Film Extrusion
Process of film extrusion can be modeled as;
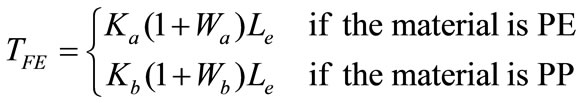 (2)
(2)
where TFE, Ka, Kb are the time to extrude the required length of a given type of bag, the film extrusion time per length of type A machine and type B machine, respectively. Le, Wa, Wb are the film length of a given bag, the parameters representing the percentage wastes due to power failures and setting up of the film extrusion for a given product on type A machine and type B machine, respectively. These figures may vary with the frequency of power failure and the frequency of style variations. However, typical average values for medium volume production have been used for the simulation. Type A machine uses the polyethylene whereas type B machines uses the polypropylene for film extrusion. The time delay before printing is imperative and it can be given by;
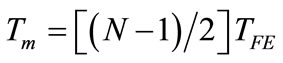 (3)
(3)
where N is the number of bag lengths accumulated on a roller. Further, a delay at film store (Tbp) which can be set to zero in minimum time production, is also included in the model. However, delay time just before making bags (Tbbm) as well as the storage time of bags and delay time before quality checking (Tbqc) can be made zero under optimal production with proper line balancing.
3.2. Printing
Sub-model for printing is can be gives as follows.
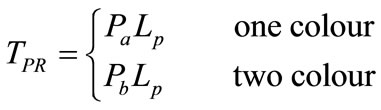 (4)
(4)
where TPR, Pa, and Pb are the time to print the required length of a given type of bag, the printing time per length on one colour machine and two colour machine, respectively. Printing time per unit length will vary depending on the nature of the print, number of colours, and the roller size of which perimeter equals to the printing length. Lp is the print length of a given bag.
3.3. Bag Making
Bag making process consists of two operations namely the sealing and cutting. The printed film is fed to a bag making machine continuously and momentarily stops it at the correct position with the aid of optical sensors for simultaneous sealing and cutting operations. The bag making time can be calculated as follows.
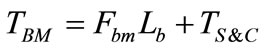 (5)
(5)
where TBM is time taken to make the bag in the bag making section for a given product. Fbm, Lb, TS&C are the average feeding rate of the machine including acceleration and deceleration sessions, length or width of the bag which is subjected to feeding, and cutting and sealing time of the machine respectively. Cutting and sealing time is almost a constant for a particular gauge of a film. Only at setting up of a bag making machine, few bags are subjected to quality checking for sealing strength and this operation stops once the bag making machine is set to the required strength. Only few bags are wasted in this setting up process of a large volume of production and time taken for this process can be neglected.
3.4. Quality Checking
With a time study, it was revealed that QC time of the bag is proportional to the area. Additionally, extra time is required when a defective bag is to be removed from the bundle. It is also proportional to the area of the bag since the difficulty in handling increases as the size of the bag increases. The average time for quality checking can be written as;
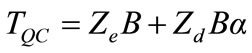 (6)
(6)
where TQC is the time for quality checking of a given product. Ze, Zd, B, α are the time needed to check a unit area of a bag for quality, additional time required to carry out the removing operation for a defective item of unit area, the area of a given bag, and the rejection ratio. The bags survived at quality checking are subsequently undergone packing operation. The values of Ze and Zd were found out from a time study.
3.5. Handling and Packing
Actual handling time of a poly-bag in packing operation has a non-linear relationship with the area of the bag and it depends on some other factors such as the static charges, material, and the thickness of bags. Since Sri Lanka is a tropical country with a higher humidity level, the effect of static charges can be neglected. Further, for a particular type of poly-bag, material and thickness of the bag are constant. For simplicity, counting time in handling and packing is assumed to be proportional to the area of the bag. Packing and unpacking time (TH) which are constants, are included in handling time. Further recording of quality on the given sheets also needs a constant time (TR).
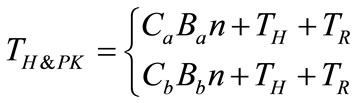 (7)
(7)
where TH&PK is the handling and packing time for a given product. Ca, Cb, and n are the constants of proportionality in handling and packing times of polythene and polypropylene bags, and number of bag per pack respectively. TH, TR are handling time and report time per bag respectively.
In case of considering the minimum time to manufacture a poly-bag, storage times in between two operations should be equal to zero.
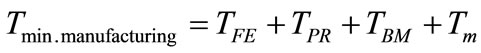 (8)
(8)
When manufacturing 100 poly-bag items, α numbers of bags are found to be defective. Therefore, in order to survive 100 poly-bags after quality checking, it is required to manufacture 10000/(100 – α) poly-bags. Since effective bags after QC are packed and therefore handling and packing time is only applicable to effective items. Further, delay times in the process do not get affected by the number of items in short run since it is a multi-phase feeding system. Therefore, effective through put time requirement to pack an effective item is given by
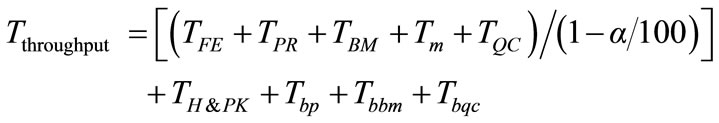 (9)
(9)
In case of considering minimum throughput time, storage times in between two operations should be set to zero. Therefore the minimum time can be expressed as follows.
 (10)
(10)
The rate of film extrusion, printing, and bag making are assumed to be constant for a given product on a particular type of machine. It was assumed that there is no idling time for printing and bag making machines since WIP is adequately available in stocks, initial storage of bags can entirely fulfill the demand of QC section in all the time, QC is carried out by the skilled labours and has an almost constant rejection ratio for the production, and impact of absenteeism is negligible.
3.6. Production Scheduling
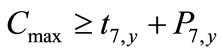
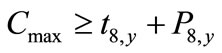
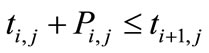
Each job is characterized by a fixed order of operations, each of which is to be processed on a specific machine for a specified duration. Each machine can process at most one job at a time and once a job initiates processing on a given machine, it must complete processing uninterrupted. The objective of scheduling is to achieve maximum productivity. In other words, it is required to find a schedule that minimizes the make-span of the jobs with reasonable assumptions. Therefore, the optimum production scheduling becomes the problem of job shop scheduling. Since the system under investigation has normally 5, 6 days of lead time and number of machines used for production is below 15, the optimum production scheduling can be considered as a small instant job shopping scheduling problem. In addition, it receives few orders per day. Rather than satisfying with a good solution, it is prudent to go for an optimum scheduling under prevailing circumstances. Therefore, mixed integer programming solution method was applied. Here, it is assumed that there are N jobs and M machines, and each job follows a predetermined route, operation (i,j): processing of job j on machine i, processing time is Pi,j, jobs do not recirculate, and ti,j is start time of job j on machine i, i = 1, 2, ∙∙∙, m and j = 1, 2, ∙∙∙, n. Ultimate aim is to minimize mixed space shop finish time, Cmax using the mixed integer programming formulation.
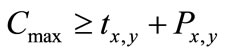 (11)
(11)
 (12)
(12)
 (13)
(13)
where y is the last job received and 7, 8 are the cutting machines which end the process.
 i, j for all existing job (14)
 (15)
(15)
 (16)
(16)
where ti,j ≥ 0, xijk EUR {0,1}.
4. System Simulation
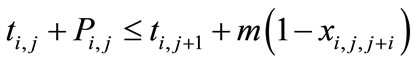
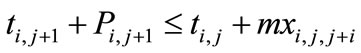
The mathematical model described in Equations (9) and (10) can be used to find the optimum throughput time of a given type of a poly-bag under available plant capabilities and to minimize the material wastage under current production setup. The simulation of the system can be basically divided into two categories namely system simulation and Monte Carlo simulation. System simulation is employed in deterministic processes and the performance of the system depends on parameters of the systems and the operational algorithms used. Selection of the best operational strategy and the optimal tuning of the system parameters can be done by means of system simulation. If the operations of the system mimic stochastic nature such as arrival of customer orders that are beyond the control of the system, and such system outputs can be obtained with Monte Carlo simulation. Randomness in the simulation process is achieved by the generation of random numbers and random observations are generated through inverse transformation method with an appropriate probability distribution. In generation of corresponding probability distribution, Monte Carlo sampling process is used. The production system under investigation is a hybrid system of deterministic nature and stochastic nature. Therefore, both simulation techniques were jointly used in obtaining the simulated results.
All the time durations at each production stage, QC, packing, and delay of film blowing on the machine can be calculated based on the real factory data. However, Tbp, Tbbm, and Tbqc depend on the urgency of the order, production quantity, similar productions in processing, and operational decisions of the management. Therefore, it mimics uncertainty and the process is of stochastic nature. Hence Monte Carlo sampling process can be devised in stochastic simulation model. The real data obtained for time-before-printing, time-before-bag-making, and time-before-QC are used to calculate the probabilities from random observations using inverse transformation method. Since the delay time is a continuous variable, data are divided into several classes in applying inverse transformation method in the above three cases.
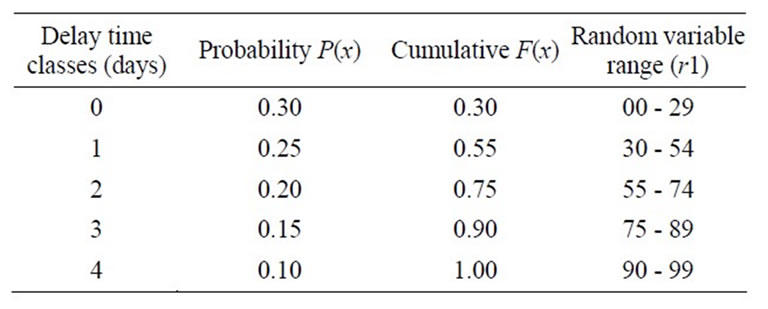
Table 2. Delay time before printing (Tbp).
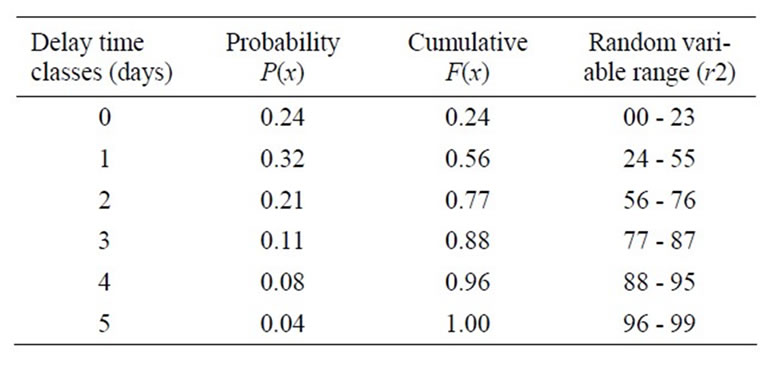
Table 3. Delay time before QC (Tbqc).
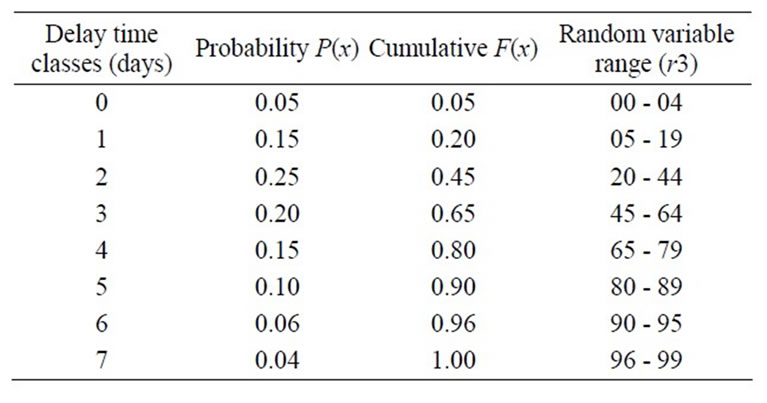
Table 4. Delay time before bag making (Tbbm).
Probabilistic tables obtained for various delay times are given in Tables 2-4.
5. Simulation Results and Discussion
Computer simulation was carried out using MATLAB 7.2 software package. Table 5 shows the specifications of selected poly-bags for simulation trials. In addition to these specifications, required quantities, date of receive, and the deadlines for the production are also noted on the customer orders given in Table 6. These details are used as the input for simulation trials.
Table 7 tabulates results of Monte Carlo simulation for the products A, B, C, and D. The time requirement at each process and total time are calculated for the selected products and listed in Table 8. All simulation times except bag making time (TBM) in Table 8 are in minutes. Bag making time (TBM) in Table 8 is in seconds. Simulated processing times (TFE, TPR, TQC and TH&PK) given in the Table 8 for each product are graphically shown in Figure 8. Minimum manufacturing time for each product is given in Figure 9. The generated production schedule for the customer orders of Table 6 is given in Table 9.
The menu hierarchy of the developed simulation tool, PolySim is shown in Figure 10. The simulation tool is driven by GUI and it can be used to input, edit, and process all the necessary data for the simulation. It gives the simulation output in numerically and graphically. In addition, it can generate the optimum production schedule for a given time horizon. The simulation tool includes four menu items in the menu bar: input, output, simulation, and help as shown in Figure 11. In the input menu four sub-menus are available: Load parameter, edit parameter, customer order, and exit. Load parameter and edit updating the input parameter of the simulation. Customer orders can be checked and updated from the customer orders sub-menu. In the simulation menu three sub-menus are available (namely, System Simulation, Monte Carlo Simulation, and Production Schedule) to perform system simulation and Monte Carlo simulation and to generate optimum production schedule. Output menu includes four sub-menus to display the results of system simulation, Monte Carlo simulation, Monte Carlo and system simulation, and production schedule. Help menu consists of PolySim Help and About PolySim sub-menus to provide help and also the details of the simulation tool. Snap shots of Load Parameter window and Results-Monte Carlo simulation are shown in Figure 12 and Figure 13 respectively. The GUI in Figure 12 is used to input or retrieve machine, product, and production parameters whereas the GUI in Figure 13 shows the results of Monte Carlo simulation in numerically and graphically.
6. Conclusions
This paper presented an analysis, a modeling and a simulation method of a poly-bag manufacturing system. In the preliminary analysis, a risk analysis and a bottleneck analysis were carried out to identify the risks and the bottlenecks of the selected poly-bag manufacturing system. In the risk analysis, risk prioritization method was proposed. A graphical user interface driven simulation tool was also developed for the simulation. In the
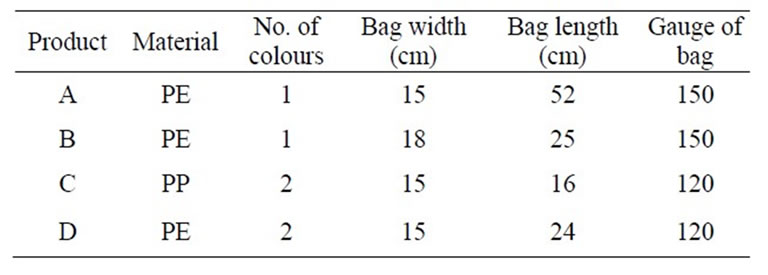
Table 5. Product specifications.
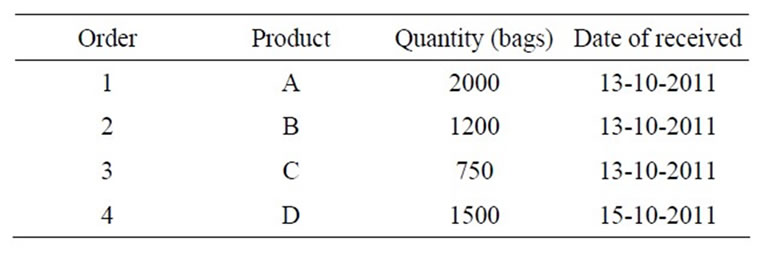
Table 6. Details of customer orders.
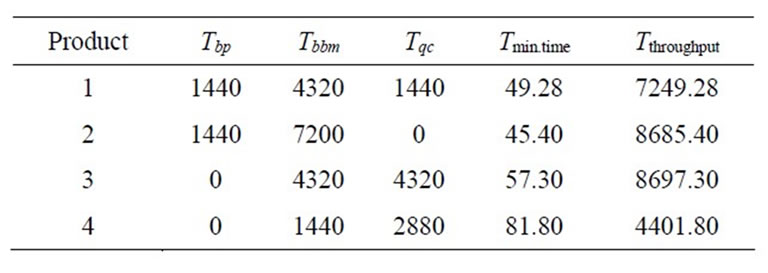
Table 7. Monte Carlo simulation outputs.
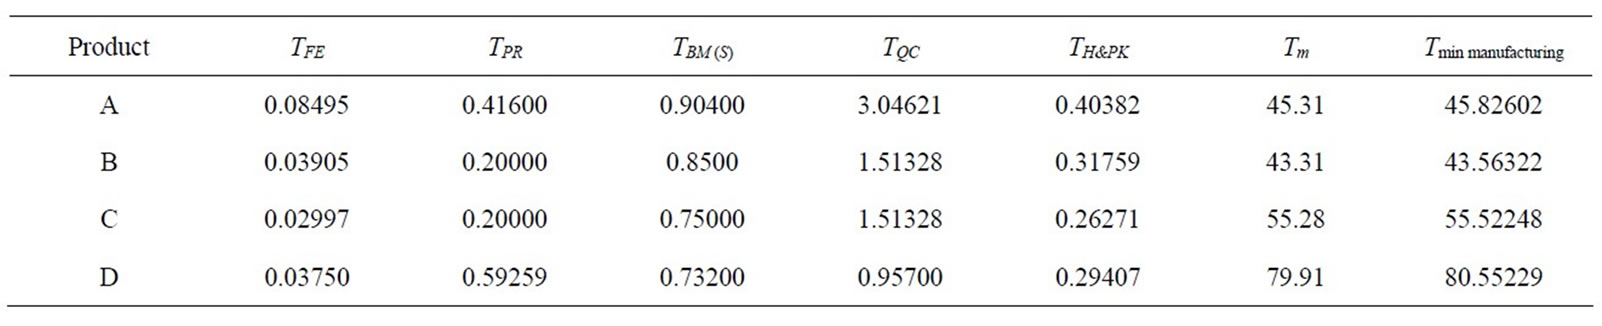
Table 8. Simulated processing times and minimum manufacturing time.
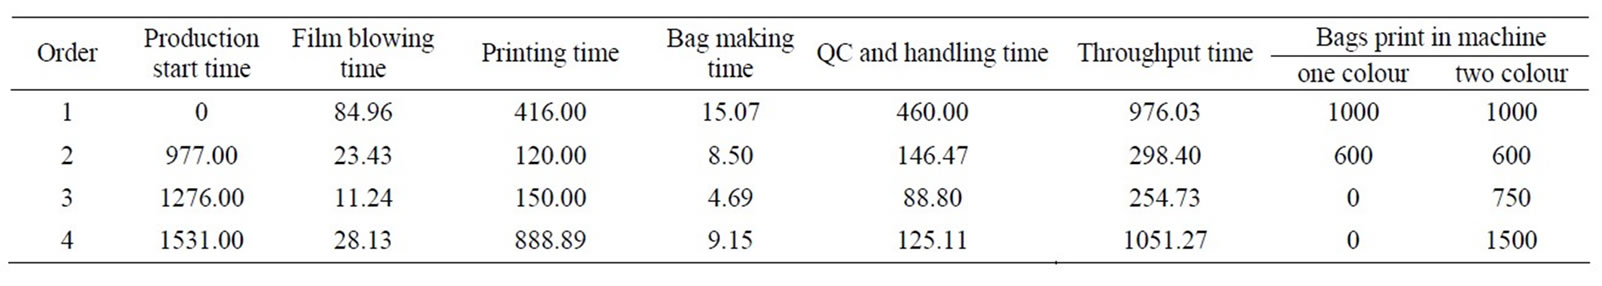
Table 9. Production schedule (all times are in minutes).
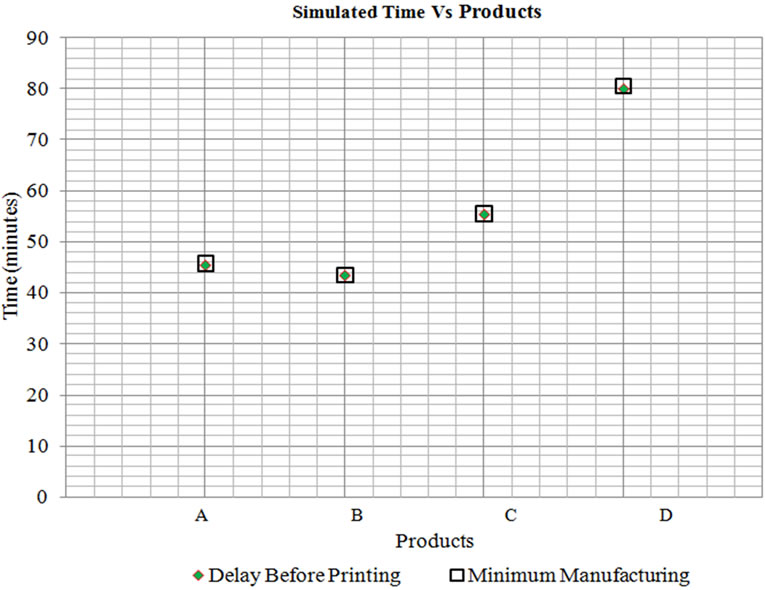
Figure 8. Simulated processing times.
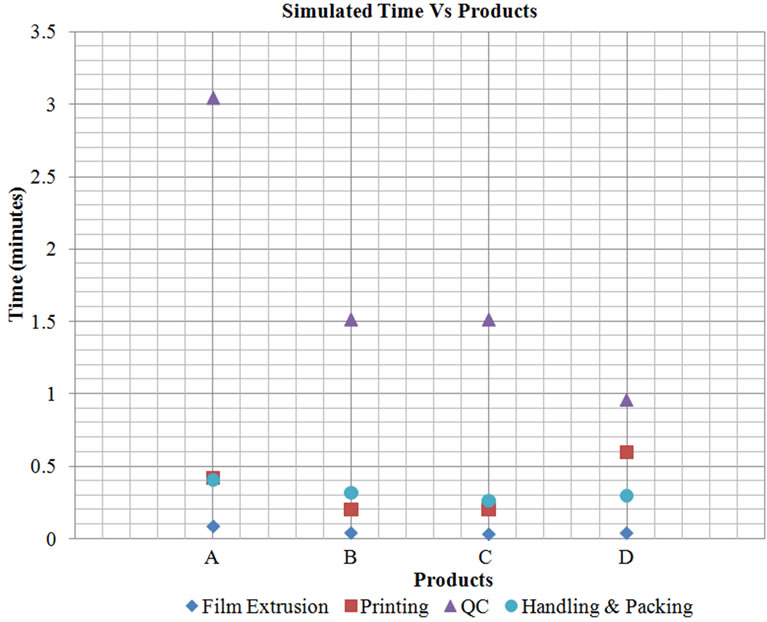
Figure 9. Minimum manufacturing time.
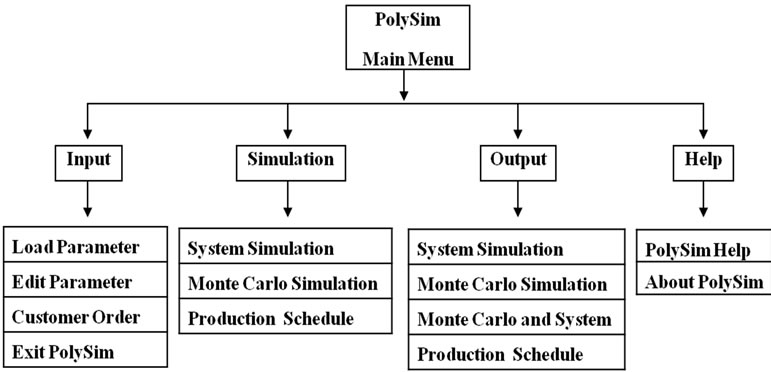
Figure 10. Menu hierarchy of the simulation tool.
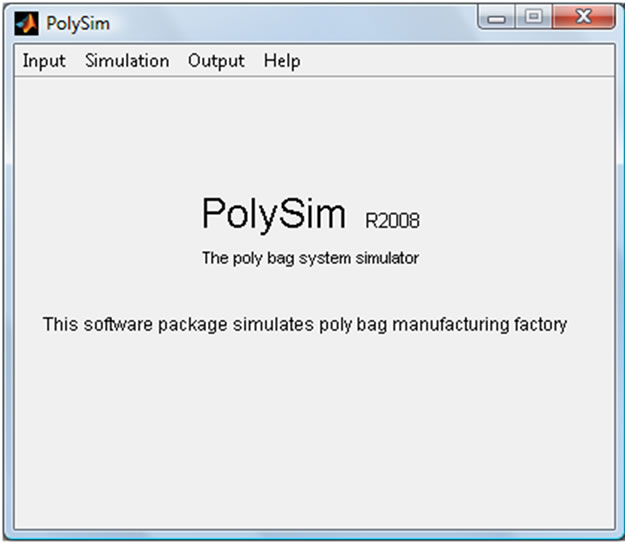
Figure 11. Snap shot of main window of simulation tool.
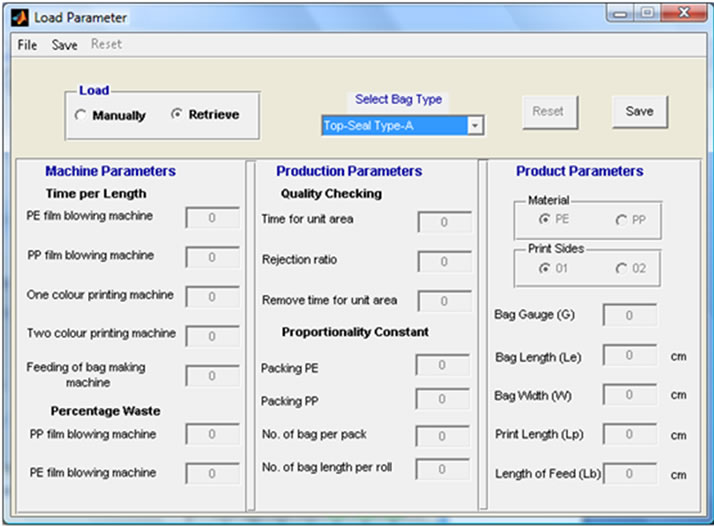
Figure 12. Snap shot of “Load Parameter” window.
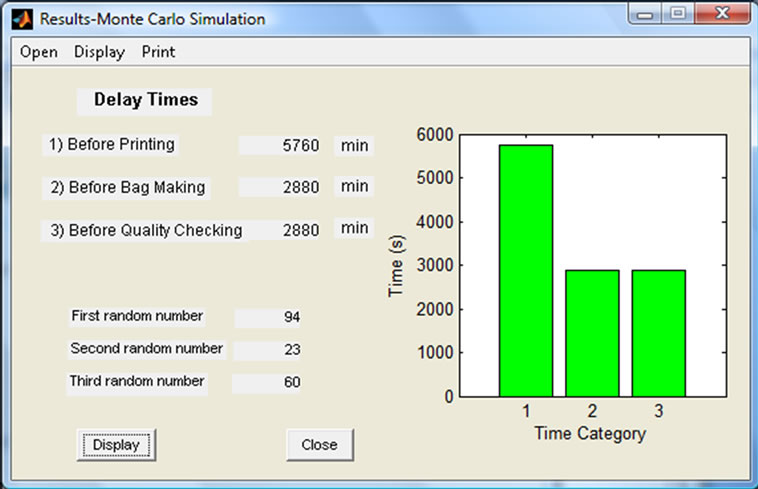
Figure 13. Snap shot of “Results-Monte Carlo Simulation” window.
simulation, system simulation and Monte Carlo simulation were performed to find the optimum throughput time of a given type of a poly-bag under available plant capabilities and to minimize the material wastage under current production setup. In addition, a method of calculating optimum production schedule of the system was incorporated in the simulation tool.
From the simulation results, it is identified that the maximum contribution for minimum throughput time is from the film accumulation time on the roller. That is varying about 90% - 97% according to the product. Instead of that generally, QC time, handling and packing time, and printing time contribute about 2% - 6%, 0.30% - 0.8%, and 0.3% - 2%, respectively for the minimum throughput time in almost all of products that were used for the simulation trials. Further, it can be seen that the contribution of each process time for the minimum throughput time varies according to the product type. The contributions of the printing time, film blowing time, and bag making time for the minimum manufacturing time are about 79% - 94%, 3% - 16%, and 2% - 6%, respectively.
According to the results of the preliminary analysis and the simulation following recommendation are given. Proper production planning can be carried out to eliminate the line balancing and idling problems. Proper inventory controlling and recording method should be applied to improve the inventory control to face the challenges in periodic fluctuations in material prices though the randomness component of the material price fluctuation cannot be predicted. In the simulation, it could be identified that the contribution of each time component for the total time varies according to the product. The proper resource allocation in accordance with the product type causes to increase the productivity. QC, which is not a direct value added process, conceded a considerably large amount of production time. Therefore, a work study should be carried out in QC process and a suitable training program should be carried out for the staff of the QC division accordingly.
Following points will be interesting topics for future study in this area: incorporating a pricing system and optimizing the profit of the company rather than the production times, develop a material price forecasting system and generating the optimum inventory control schedule for a given time horizon, adaptation of wastage recycling into the simulation tool to calculate the level of corona treatment such that the total cost for the production can be kept at a minimum.
7. Acknowledgements
The authors would greatly appreciate the support of Thermo Plastics (Pvt) Ltd, Hemantha Munasinghe, Dharma Bandula, and Asiri Amarasene on this research.
REFERENCES
- http://plastics.turkavkaz.ru/processes/extrusion/blown-film-extrusion/
- I. Thomas and E. D. Butler, “Film Extrusion Manual: Process, Materials, Properties,” 2nd Edition, TAPPI Press, Georgia, 2005.
- X. L. Luo and R. I. Tanner, “A Computer Study of Film Blowing,” Polymer Engineering Science, Vol. 25, No. 10, 2005, pp. 620-629.
- I. A. Muslet and M. R. Kamal, “Computer Simulation of the Film Blowing Process Incorporating Crystallization and Viscoelasticity,” Journal of Rheology, Vol. 48, No. 3, 2004, pp. 525-534. doi:10.1122/1.1718500
- V. Sidiropoulos, J. J. Tian and J. Vlachopoulos, “Computer Simulation of Film Blowing,” Journal of Plastic Film and Sheeting, Vol. 12, No. 2, 1996. pp. 107-129.
- S. Brown, F. Chance, J. W. Fowler and J. Robinson, “A Centralized Approach to Factory Simulation,” Future Fab International, 1997.
- M. Graul, F. Boydstun, M. Harris, R. Mayer and O. Bagaturova, “Integrated Framework for Modeling and Simulation of Complex Production Systems,” Knowledge Based Systems, Inc., Texas, 2003.
- M. Schumann, E. Bluemel, T. Schulze, S. Strassburger and K. C. Ritter, “Using HLA for Factory Simulation,” Fall Simulation Interoperability Workshop, 1998.
- J. O. Henriksen, “An Introduction to SLX,” WSC’95 Proceedings of the 27th conference on Winter Simulation, 1997, pp. 559-566.
- K. C. Ritter, “Skopeo-Animation,” Accessed on 5 September 2011. http://simos2.cs.uni-magdeburg.de/skopeo/
- http://www.thermosl.com
- http://www.mathworks.com/products/
- G. Houben, K. Lenie and K. Vanhoof, “A KnowledgeBased SWOT-Analysis System as an Instrument for Strategic Planning in Small and Medium Sized Enterprises,” Decision Support Systems, Vol. 26, No. 2, 1999, pp. 125- 135. doi:10.1016/S0167-9236(99)00024-X
- R. A. R. C. Gopura and T. S. S. Jayawardene, “A Study on a Poly-Bag Manufacturing System: Preliminary Analysis and Simulation,” Proceedings of International Conference on Industrial and Information Systems, 28-31 December 2009, pp. 546-551.
- J. Wang, “Process Bottleneck Analysis and Production Scheduling of Process Industry,” Ph.D. Dissertation, Tsinghua University, Beijing, 2008.