Engineering
Vol. 4 No. 2 (2012) , Article ID: 17419 , 10 pages DOI:10.4236/eng.2012.42012
Case Study: Hydraulic Model Experiment to Analyze the Hydraulic Features for Installing Floating Islands
Department of Water Resources Research & Environment Research, Korea Institute of Construction Technology, Ilsan, Korea
Email: {kikimorah, jgkang02, hongil93, yeo917}@kict.re.kr
Received November 13, 2011; revised December 13, 2011; accepted December 20, 2011
Keywords: Water-Friendly Space; Floating Islands; Stability of River Channel; Hydraulic Features
ABSTRACT
The viewpoint of a river is changing as people regard the river as water-friendly space where they can enjoy and share the space beyond the simple purpose of flood control alongside the improving social level. The floating islands installation was planned featuring three islands. The river’s flow and channel stability could be changed when new structures are built in a river. Hence an analysis of the hydraulic characteristic changes should need. The hydraulic model experiment in this study sought to review the impacts of the floating islands installation on the safety of flood control and stability of river channel. This study analyzed the hydraulic features affecting the surrounding stability when installing floating islands and proposed stable floating islands layout in terms of hydraulics based on the experiment results.
1. Introduction
The viewpoint of a river is changing as people regard the river as water-friendly space where they can enjoy and share the space beyond the simple purpose of flood control alongside the improving social level. Floating islands installation was carried out according to the plan to shape the cultural space along the river, i.e., to provide water culture and leisure space. Floating islands were planned featuring three islands. The hydraulic model experiment (HME) in this study aimed at reviewing the impact of floating islands installation on the safety of flood control and stability of river channel. The main review items were flow duration, velocity, and shear stress.
The experiment target area is the downstream area of Han River located at the center of Seoul. The project section is an approximately 3.5 km-long straight line downstream between Hannam Bridge and Dongjak Bridge. The section marked with the red dotted line in Figure 1 is the project target section, and the blue dotted line-marked section, the section of main interest with some changes in the target section.
The target area’s flood frequency is high due to the high altitude of the water front of Han River and owing to damage by floods occurring at least 3 times annually. This area was used as grassland and green land-centered area because of the frequent floods. The basic plan of the target area within Han River consists of educational facilities construction including ecosystem natural learning arena and complex cultural space shaping as an event plaza and view plaza through riverside improvement. The basic plan is established to shape the ecosystem river bank and for nature-friendly or water-friendly river bank protection in terms of the change of bank protection. Moreover, in the Banpo zone, a plan to create cultural space has been established through the floating islands installation. Consisting of 3 islands in Figure 2, the planned floating islands shall be installed on the left of the straight downstream section of Banpo Bridge as water cultural and leisure space in a 9200 m2 area. Here, two issues are flood control stability and hydraulic movement. First is topographical change on the left riverside of Han River in the target area including change in low
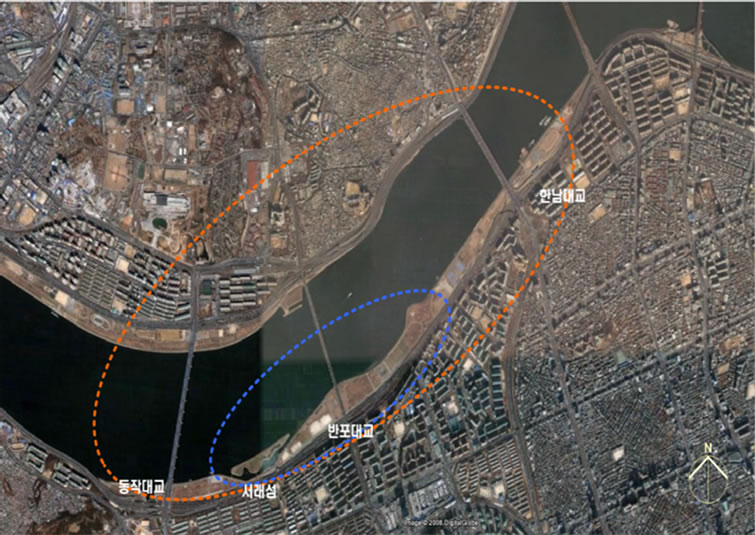
Figure 1. Project target section (red dotted line) and section of main interest (blue dotted line).
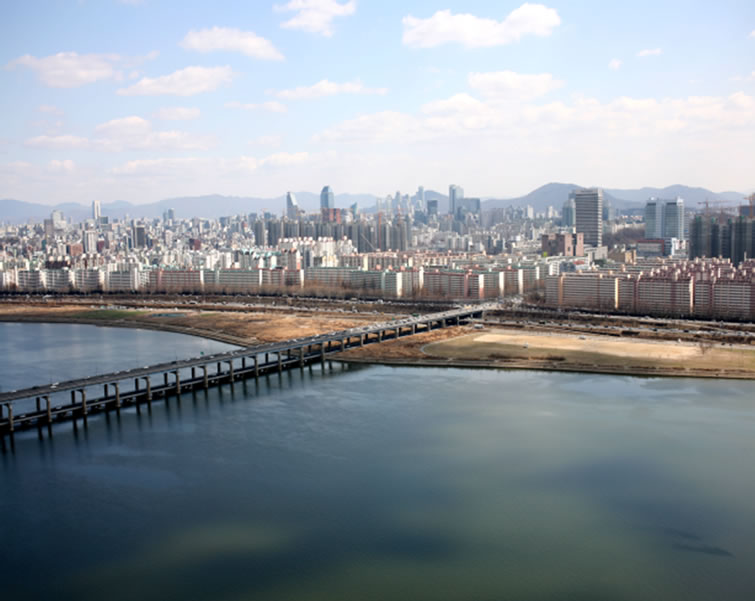
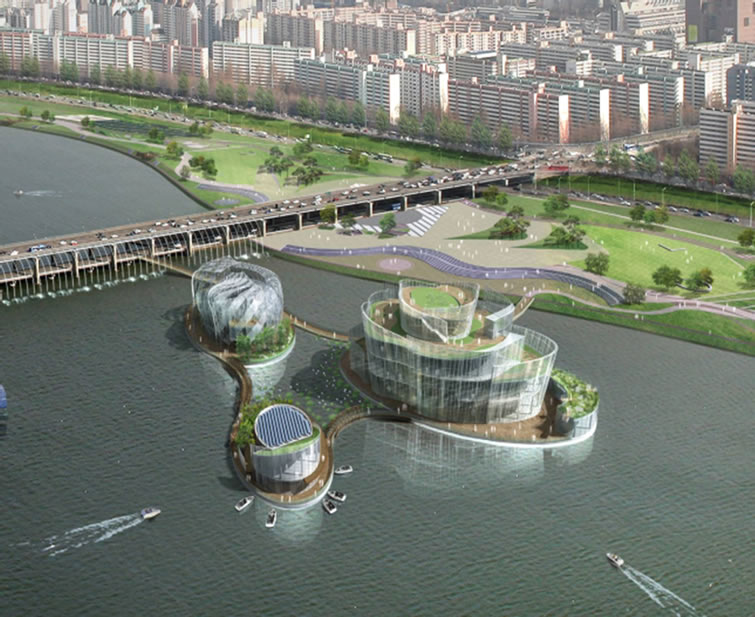
Figure 2. View before and after the installation of floating islands.
water channel cross section according to change of bank protection shape. The impacts of such topographical change on flood water level and current field should be reviewed. Second is floating islands installation. A review of the impacts of the floating islands installation on flood water level and riverbed change should be conducted, including a review of the surrounding flow duration when installing the floating islands to check whether a disadvantageous hydraulic phenomenon occurs. This paper presents a design proposal that can minimize hydraulic change within the river channel based on floating islands installation.
2. Theory and Scale
The hydraulic model experiment (HME) was carried out to find hydraulic solutions to phenomena limited to specific areas including the construction of hydraulic structure and river improvement. As such, HME has various purposes according to project features, and it should consequently be carried out with clear purposes. Likewise, a variety of plans including experiment size in line with the purposes need to be established. The model and actual-sized prototype in the HME should meet three similitudes: geometric similitude, kinematic similitude, and dynamic similitude [1]. In the geometric similitude, the length ratio needs to be constant at the corresponding point of the actual-sized prototype and model. In the kinematic similitude, the ratio of velocity and acceleration needs to be constant at the corresponding point of the actual-sized prototype and model. In the dynamic similitude, the ratio of strength needs to be constant at the corresponding point of the actual-sized prototype and model. The element that becomes a criterion in the law of geometric similitude is expressed as Lr = Lp/Lm (L: length, with r, p, and m representing the scale ratio, actual-sized prototype, and model, respectively). The velocity and acceleration ratio is expressed as ar = Ur/Tr = Lr/ . Here, time ratio is expressed as Tr, Tr = Tp/Tm.
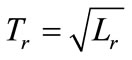
The dynamic similitude is the law matching the ratio of external forces that add to or reduce the flow of fluid and inertia force of fluid. Here, the main external forces are gravity, viscosity, surface tension, and pressure. When carrying out HME, similitude is decided by a main external force. In this study, the main external force was gravity because of the open river channel condition; thus, the Froude similitude as the ratio of gravity and inertia force was used. The main physical elements are presented as follows:
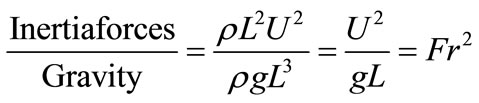 ,
,
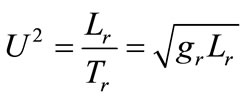 ,
, 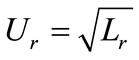 ,
, 
The scale of the hydraulic model is decided by comprehensively reviewing the reproduction ability of the actual-sized prototype, lab’s discharge supply capability, experiment model production space, and ease of measurement. Generally, the length is much greater compared with the depth in a river model. Therefore, a large river tends to have wide river channel compared with depth despite the smaller length. As such, distorted scale is inevitable when carrying out large river HME. In this experiment, the change of flood water level according to the conditions was one of the most important items. For this reason, the scale was determined in the maximum size allowed by the impact experiment supply discharge and experiment site conditions while securing maximum depth and minimizing distortion considering the accuracy of water level measurement. The model used in this experiment has 1/120 horizontal scale, 1/50 vertical scale, and 2.4 distortion. The conversion ratios of the hydraulic volume of HME are presented in Table 1.
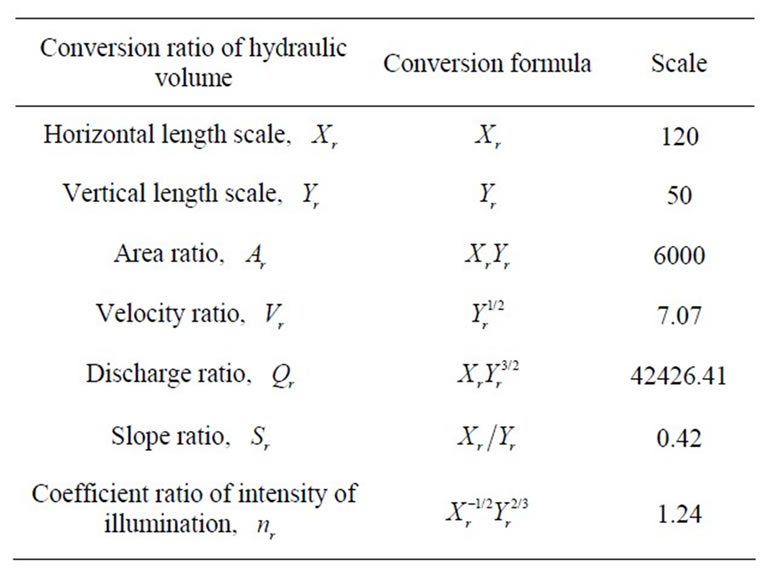
Table 1. Scales and conversion ratios of fixed bed hydraulic model experiment.
3. Model Production and Measurement Method
3.1. Model Production
For the model production, the model standard points were set by performing model measurement using a total station after completing the arrangement work on the model installation space. Along the set model standard points, the outer wall was set up using blocks, and the exterior was finished with mortar. In this manner, topographical installation work was executed. For the model section, the topographical plate model was manufactured by measurement line by cutting plywood according to the riverbed section type including bank, low water channel, and terrace land of the river after printing out as real photo through the conversion of riverbed cross section acquired from actual river measurement into a model scale. Concerning the produced topographical plates, filling work was done by paving with sand after placing by measurement line through model measurement. The fixed bed model was produced by forming paved filling materials using cement mortar along the reproduced riverbed section on the plywood after flushing with water. The produced topographical plates were installed in the precise locations by measuring with the total station. By referring to the ground plan and topographical map in Figure 3, the sections were precisely connected to reproduce the same topographical shape as the real one as much as possible. To minimize the discharge water level of the model, the water level control floodgate downstream was produced and installed as a blind type in the horizontal direction. The bridges in the model were produced with acrylic in line with the scale in terms of the shapes confirmed through onsite study along with bridge plans. The models of the three floating islands used for this experiment were made with styrofoam and these were installed to maintain 2 m draft in Figure 4. This ex-
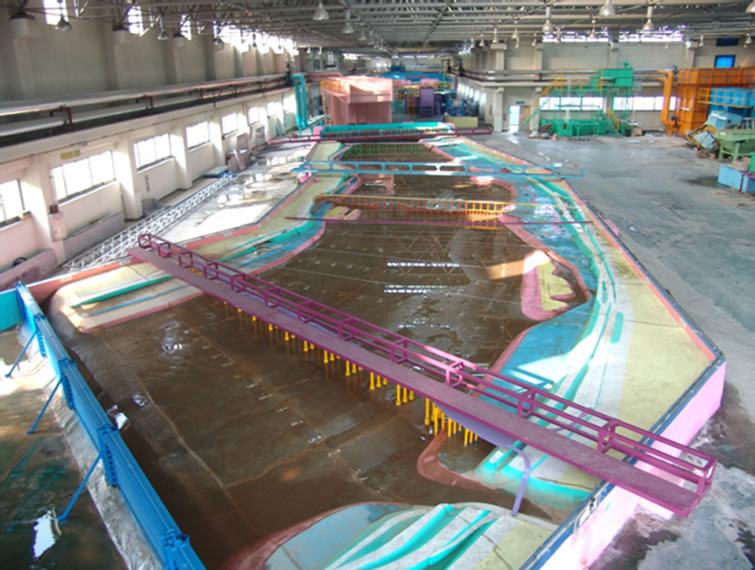
Figure 3. Target area model.
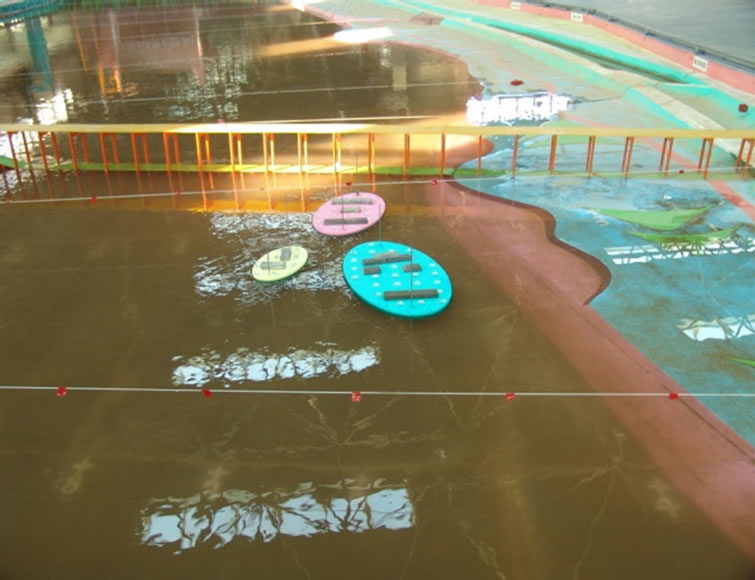
Figure 4. Floating islands installation.
periment needed large discharge. Thus, more than the maximum discharge supply of 0.9 m3/s was guaranteed using three pumps. The supplied discharge was measured using the highly reliable weir mode and was calculated according to a discharge formula and the discharge calibration curve. A weir tank (3 m wide) was used as discharge supply tank.
3.2. Measurement Method
For the measurement of the starting point’s water level and depth, a digital water level gauge (PH-355, KENEK) with 0.1 mm measurement accuracy was used. For the measurement of velocity, 1D propeller velocity gauge (VO-1000, KENEK) was used with regard to the entire HME target area’s measurement line. In the installation section of the floating islands, a 3D electronic velocity gauge (VM-1001, KENEK) that can acquire data of 100 Hz per second was used. To identify the flow impacts around the floating islands, velocity was measured using LSPIV (Large-Scale Particle Image Velocimetry) for surface flow. For the measurement of flow duration, observation was done using red pigment to identify precisely the flow duration in the river; the main parts were observed through sketch, photographing, and videotaping.
LSPIV in Figure 5 is used to measure the velocity of each particle by measuring the particles’ displacement in the images after comparing two images shot with interval in time. The advantage of LSPIV is that it can be applied to large indoor experiment or site with just simple devices and software for image processing and analysis [2, 3]. LSPIV shoots the target area using a video camera and focuses on processing the images using a software program. LSPIV is a similar method of the conventional particle image velocimetry (PIV) technique [4,5]. There are two major differences between PIV and LSPIV. First, LSPIV measures generally larger fields of view than conventional PIV. Second, LSPIV needs inexpensive equipment of illumination and recording device to analyze surface flow [6]. And this technique does not have restrictions in laser examination and camera arrangement essential to the existing PIV. As a disadvantage of LSPIV, however, it is difficult to acquire 2D or 3D current field information in water because there is no laser examination procedure. In some cases, LSPIV acquires distorted images; thus, correlation analysis should be performed after the correction work of the shot images. For this reason, accuracy drops compared to the existing PIV. Despite such demerit, the reason LSPIV attracts interest is that the measurement of the entire current field is possible at much lower expenses and with less efforts and within a short time compared with the existing use of equipment and manpower in large-scale experiments or site survey.
4. Hydraulic Model Experiment
4.1. Experiment Conditions
The purpose of HME of floating islands is to conduct an experiment in the fixed bed model, review the safety of flood control through flood water level, velocity, and flow duration measurement in the Banpo zone, analyze the change impacts, and reflect the experiment results on the project plan in the Banpo zone. As shown in Table 2, four experiment conditions were demonstrated, i.e., two cases each before and after the installation of the floating islands. Flood conditions by frequency were presented in the basic river improvement plan. The discharge condition of flood on the riverside around the BanpoBridge was the value calculated through the 1D numerical value model Hec-Ras for the flood water level on the riverside around the BanpoBridge area. The measurement of water level and velocity was carried out at 14 measurement lines and 237 measurement points within the 3.5 km section (Table 2). The measurement lines and points were shown in Figures 6 and 7.
4.2. Analyses of Hydraulic Characteristics Features before and after the Floating Islands Installation
HME of floating islands seeks to identify the safety of flood control on the design proposal of the floating islands. Actually, 7066 m3/s was applied as riverside flood water discharge in the Banpo zone along with frequency of 200 years after reproducing the floating islands with models.
Before and after the installation of the floating islands, the average water level difference by measurement line

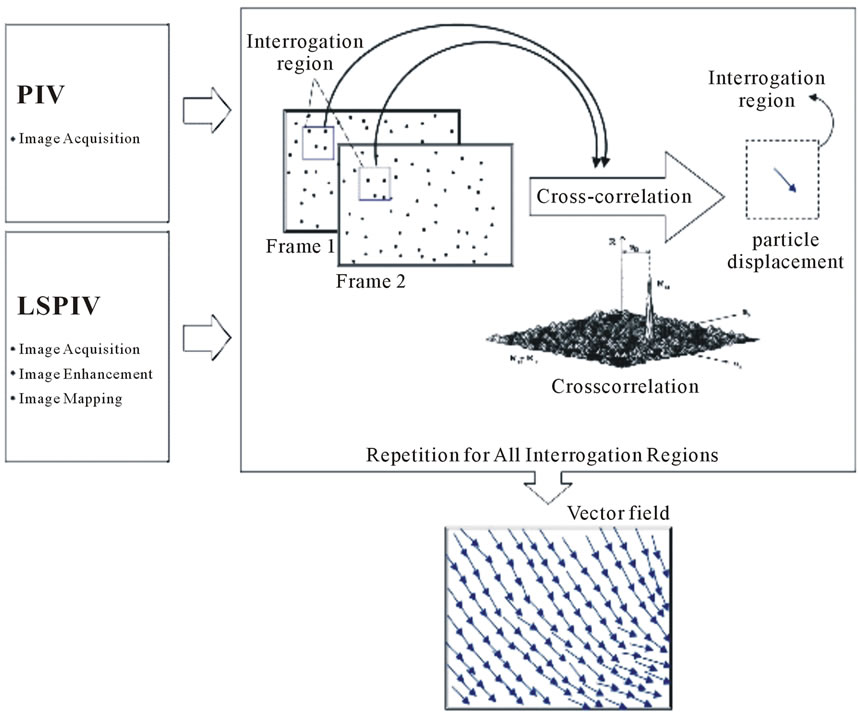
Figure 5. Analysis process using LSPIV.
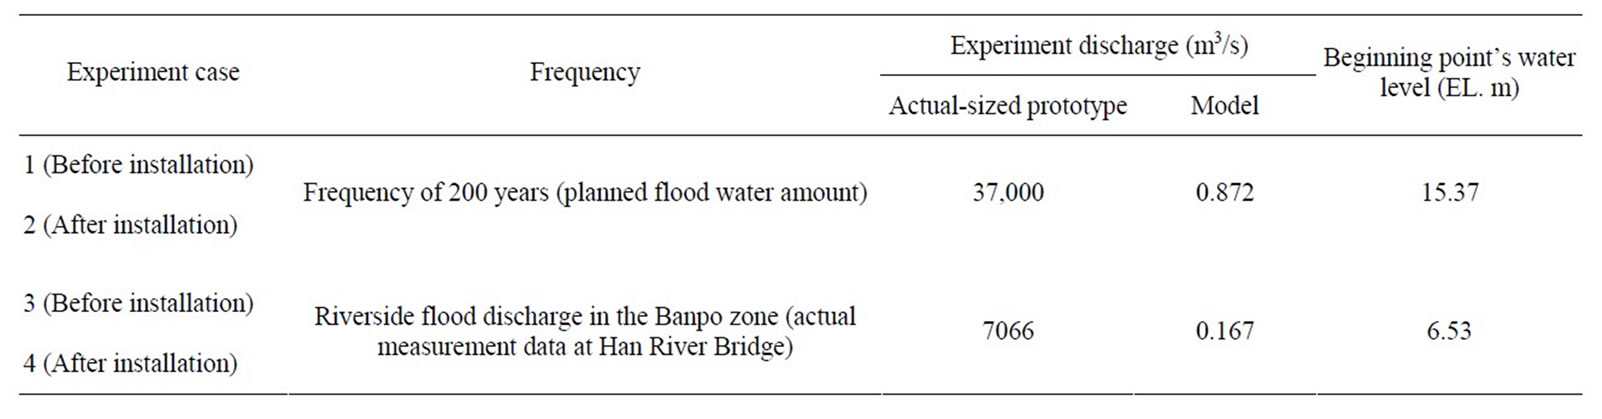
Table 2. Experiment conditions.
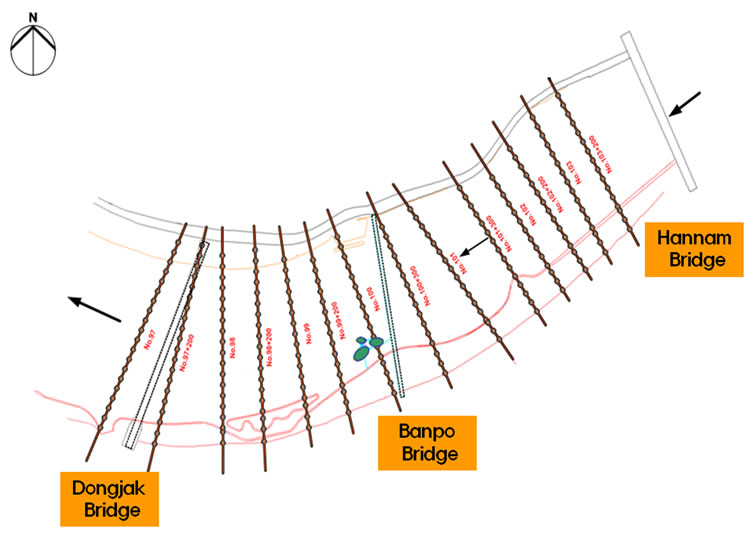
Figure 6. Measurement point location chart of hydraulic model experiment.
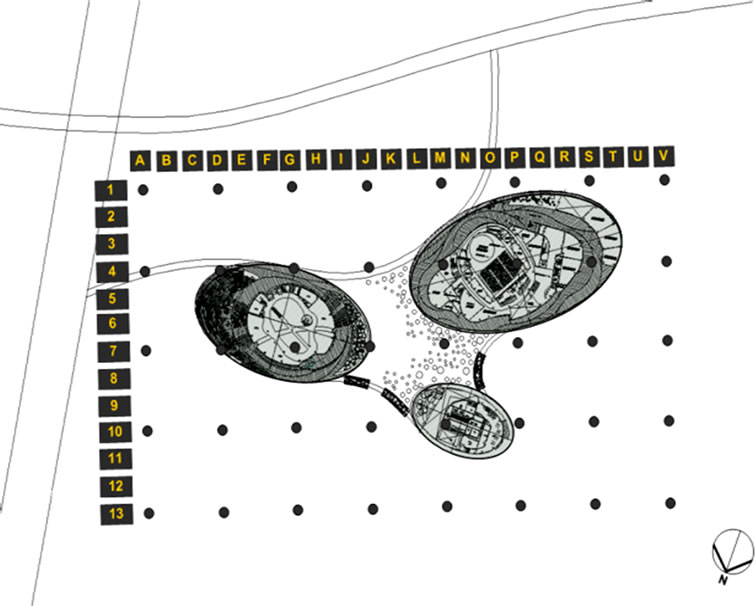
Figure 7. Velocity measurement location chart around the floating islands.
was a maximum of 0.01 m and a minimum of –0.01 m in the case of frequency of 200 years. As a result, the change of flood water level was minimal in Figure 8. To review the actual impacts on the safety of flood control, a review of flood water level on the left and right sides of the river was conducted. The upstream section of Banpo Bridge is a relatively straight line section; thus, no clear
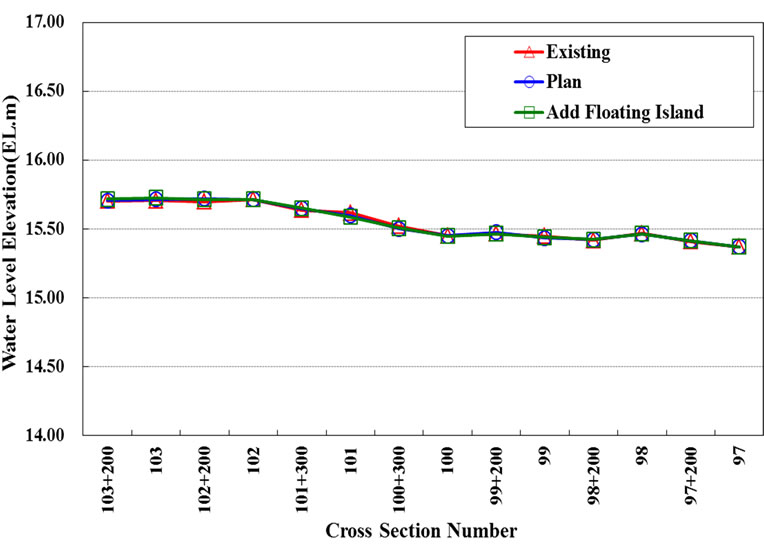
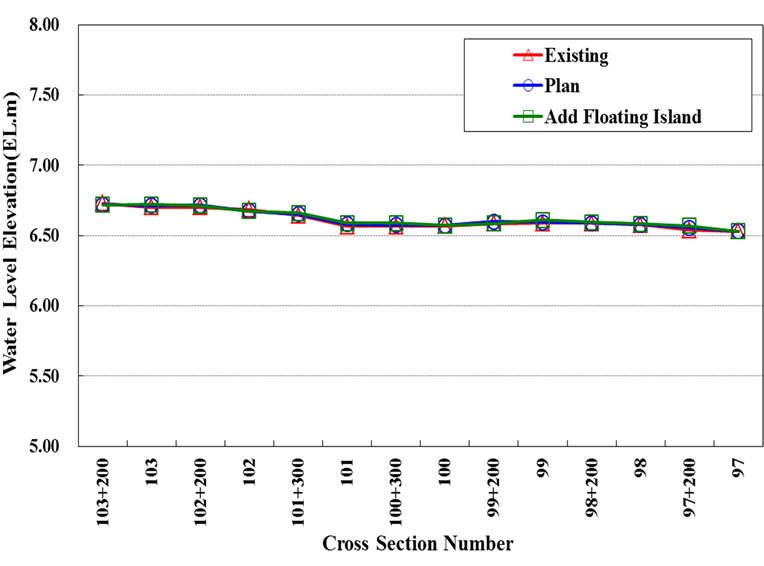
Figure 8. Comparison of water level between the current and planned cross sections and floating islands (Frequency of 200 years and bankfull discharge).
water level difference was exhibited on the left and right riversides, but the water level on the left of the river was higher than the right because of the curve part and whirlpool formation around Seorae Island downstream around Banpo Bridge. Although there are points wherein the water level goes up locally on the left side of the river, it is just local phenomenon arising from the whirlpool, hardly affecting flood control safety; hence the minimal change scope of flood water level. In addition, there seems to be no problem in flood control stability.
The cross sectional average velocity before and after floating islands installation was measured to be a maximum of 0.06 m/s and a minimum of –0.11 m/s; average riverside flood discharge was a maximum of 0.10 m/s and a minimum of –0.01 m/s, with minimal differences in Figure 9. In the case of frequency of 200 years in the section of measurement points 5 - 9 at measurement line no. 100 where the floating islands were installed, cross sectional average velocity was a maximum of 0.02 m/s and a minimum of –0.12 m/s, and riverside flood discharge was a maximum of 0.01 m/s and a minimum of –0.01 m/s. Although the impacts on the river channel were minimal, local flow change surrounding the floating islands was observed.
Figures 10 and 11 show the flow duration through images acquired by the LSPIV experiment. Some drift was observed following the installation of floating islands; the installation was confirmed not to affect the surrounding flow, however. In case floating islands were installed, the flow duration had no change around the upstream area of BanpoBridge, but the phenomenon
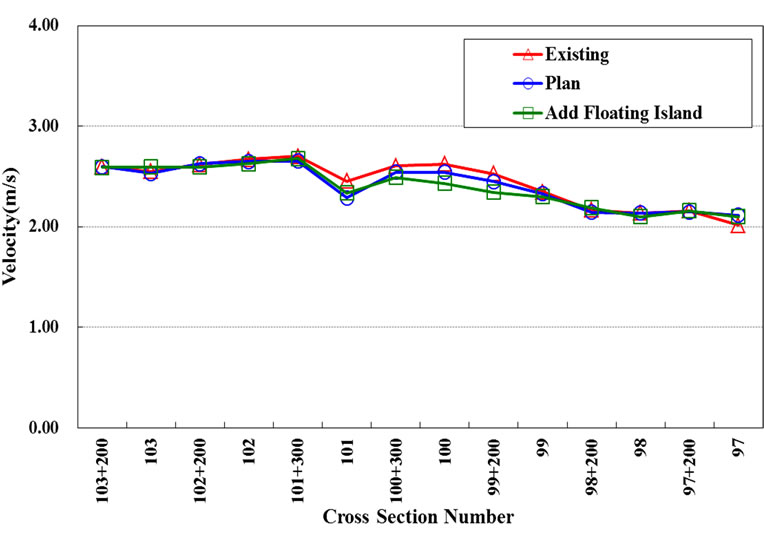
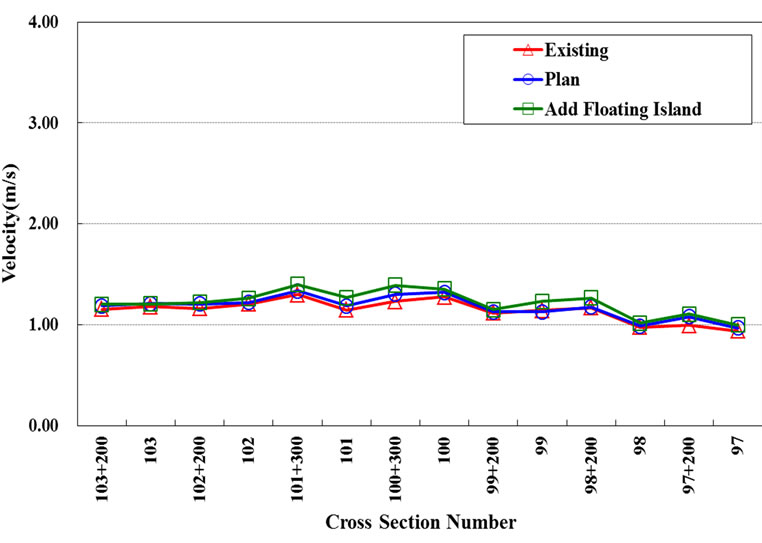
Figure 9. Comparison of velocity of floating islands and current and planned cross sections (Frequency of 200 years and bankfull discharge).
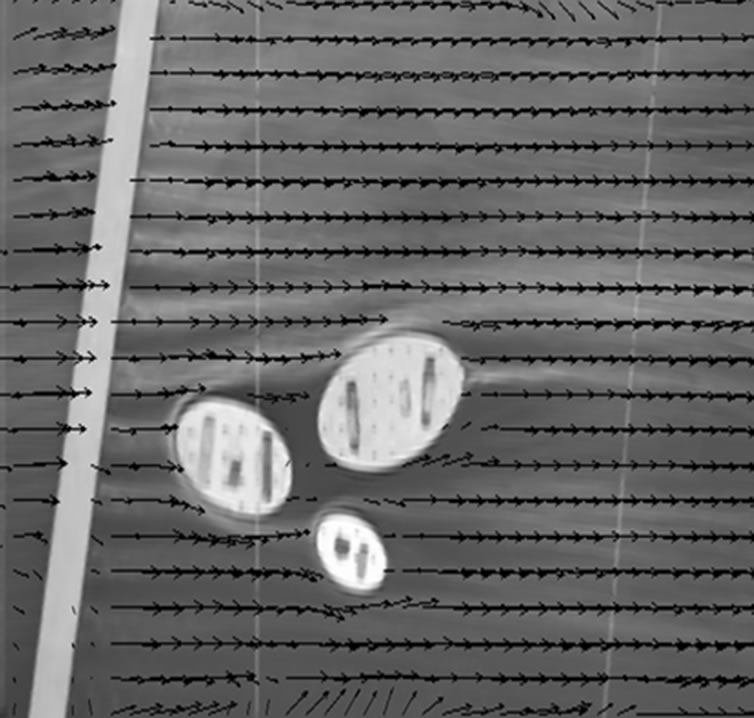
Figure 10. Surface current field after floating islands were installed with frequency of 200 years.

Figure 11. Surface current field after floating islands were installed with bankfull discharge.
wherein flow is divided around the floating islands downstream of BanpoBridge occurred. Nonetheless, strong whirlpool or backwash did not occur, with the impact scope downstream observed within a maximum of 150 m from the end of the installed floating islands. The area affected by the floating islands was about 400 m × 200 m including the floating islands. In the case of riverside flood discharge in the Banpo area (7066 m3/s), small whirlpool and stagnant area were observed in some sections due to topographical impact on the left side of the installed floating islands area before the floating islands were installed. When the floating islands were installed, however, velocity increased owing to the impacts of the floating islands on the current field on the left side of the floating islands. Such velocity increase was observed to increase backwash slightly in the stagnant area and small whirlpool, which occurred because of topographical impacts prior to the floating islands installation. Concerning the surrounding water level change arising from the floating islands installation, water level rise was locally observed owing to the clash between flow and floating islands, but no water level rise impact was observed based on the water level comparison at the upstream measurement lines. The water level impact resulting from the clash between flow and floating islands is a local phenomenon; there was no big difference by flood frequency as observed within approx. 5 - 10 m section upstream of the floating islands.
4.3. Bottom Velocity Distribution and Shear Stress Surrounding the Floating Islands
The analysis of changes in bottom velocity and shear stress surrounding the floating islands was carried out to predict riverbed change that can be caused by the floating islands installation. Concerning the bottom layer’s velocity change, velocity was 1.73 m/s - 2.15 m/s before the floating islands installation and 1.70 m/s - 2.18 m/s after the floating islands installation in the velocity measurement section. In other words, velocity change was minimal in the case of frequency of 200 years. Velocity change tended to diminish in the upstream area of the floating islands but tended to increase in the area where the floating islands were installed. Velocity increase in the area where floating islands were installed was about 0.1 m/s. The maximum velocity increase at the bottom layer was 0.14 m/s at D7, with maximum velocity increase of about 0.16 m/s at P1 in the measurement section. Maximum velocity decline was measured to be –0.23 m/s at A4 in Figure 12. When riverside flood discharge was 7066 m3/s, velocity distribution in the velocity measurement section surrounding the floating islands was 0.50 m/s - 1.28 m/s before the floating islands installation and 0.71 m/s - 1.46 m/s after the floating islands installation. Velocity change tended to decline at measurement line G upstream section surrounding the floating islands but tended to increase at the measurement line G downstream and riverside area on the left side of the installed floating islands.
Velocity increase in the floating islands installation area was measured to be about 0.05 m/s - 0.24 m/s, and maximum velocity increase in the measurement section was about 0.026 m/s. The area where velocity increase is huge in the riverside flood discharge was mostly on the left side of the floating islands, apparently due to the reduction of discharge capacity caused by the floating islands installation in Figure 13.
In the case of frequency of 200 years, the distribution of shear stress before and after the floating islands installation was measured to be 1.56 kg/m2 - 2.18 kg/m2 and 1.61 kg/m2 - 2.16 kg/m2, respectively in Figure 14. Although maximum shear stress change existed, overall distribution difference was minimal depending on the measurement points.
Shear stress affecting the riverbed was biggest in the case of frequency of 200 years, but the increase arising from the floating islands installation does not seem to impact the riverbed since it is minimal and shear stress under floating island in the case of 7066 m3/s was increased bigger than other discharge conditions in Figure 15. The point where the biggest increase was measured is the riverside bank; the increase was relatively huge because shear stress was very small as a stagnant section before the floating islands installation. Thus, the impact on the riverbed is judged to be minimal. Nonetheless, scrupulous review and measure to reduce impacts are considered necessary since flow duration in the river bank may become slightly unfavorable owing to the floating islands installation.
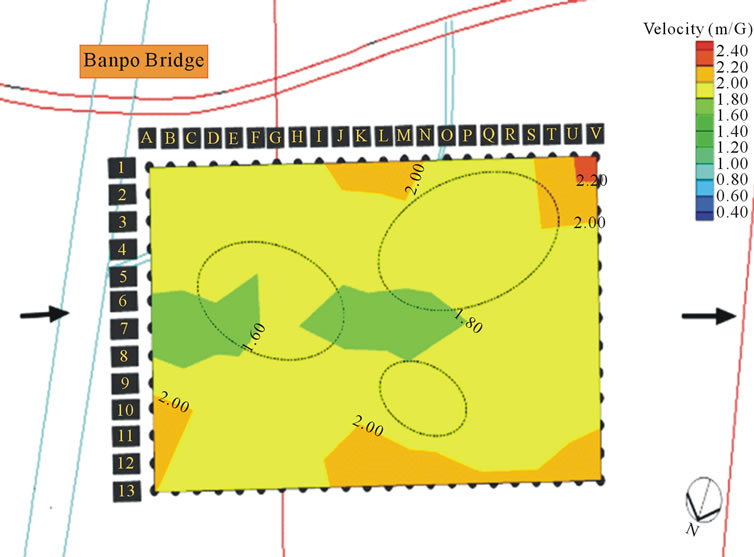
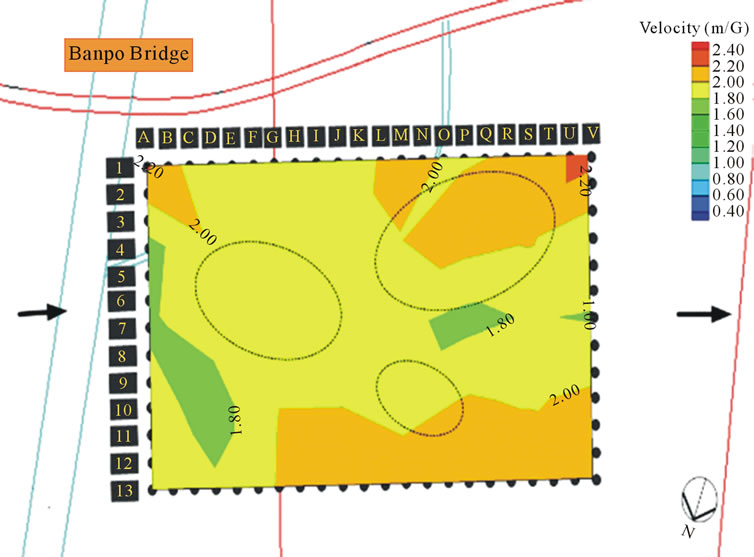
Figure 12. Velocity distribution before and after floating islands (frequency of 200 years).
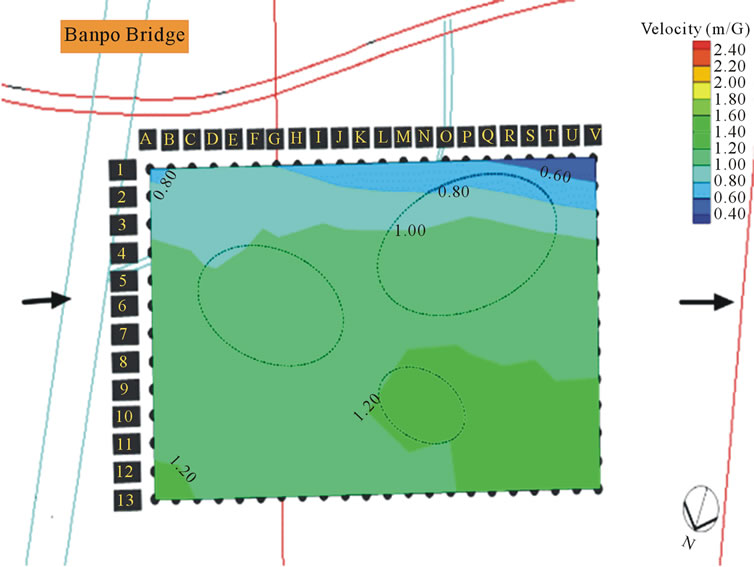
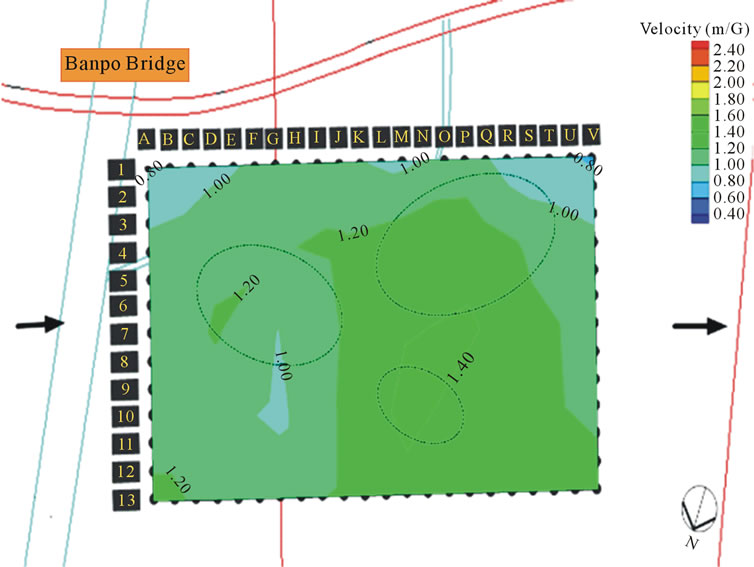
Figure 13. Velocity distribution before and after floating islands (bankfull discharge).
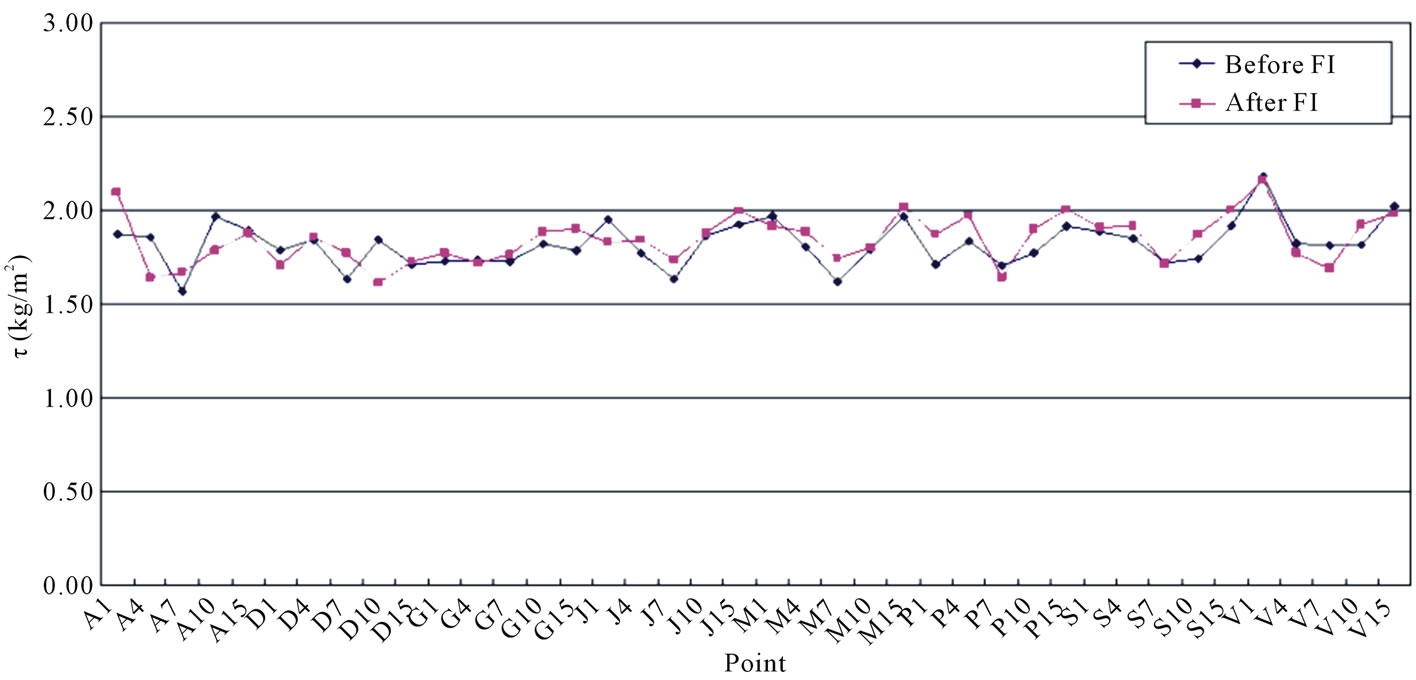
Figure 14. Comparison of shear stresses around the floating islands with frequency of 200 years.
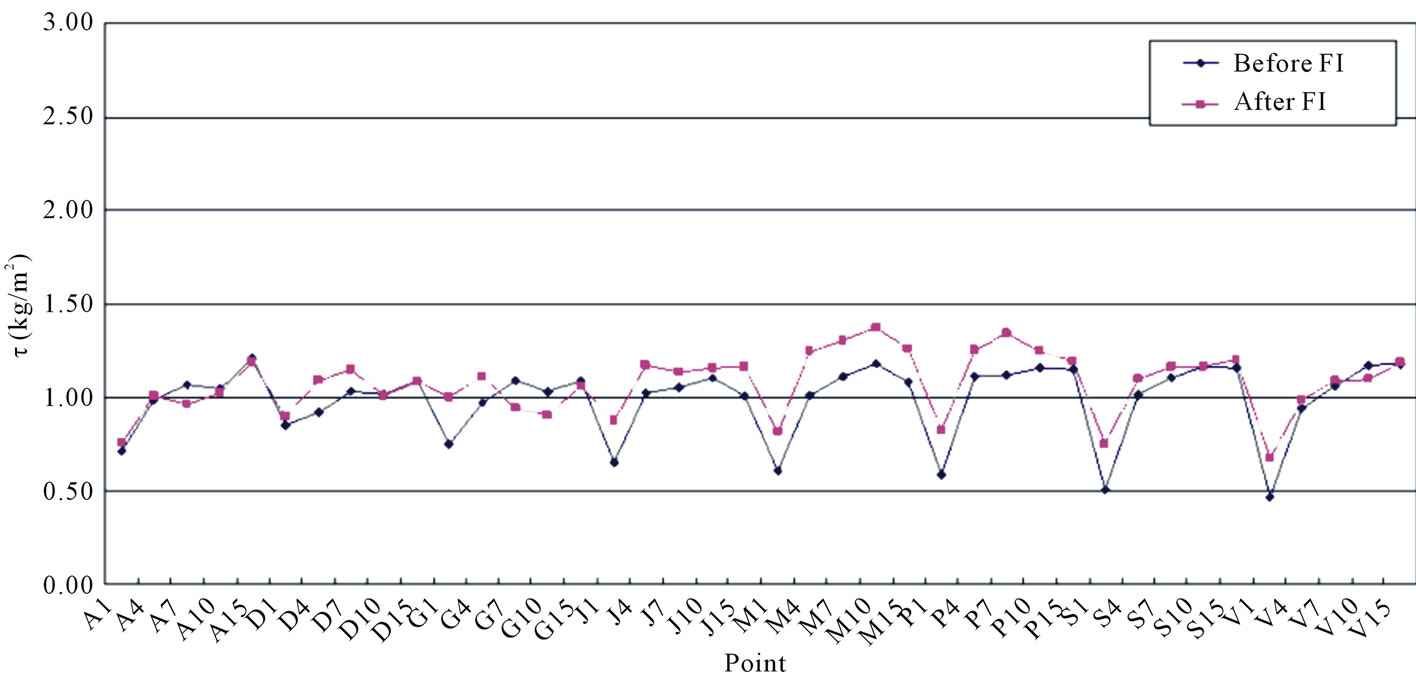
Figure 15. Comparison of shear stresses around the floating islands with bankfull discharge.
4.4. Floating Islands Layout
This study presented 2 revised proposals that can reduce whirlpool since the whirlpool was formed surrounding the floating islands in Figure 16. Figure 17 shows the flow duration surrounding the 2 revised proposals on floating islands. The left side of the floating islands installation section is the stagnant area with weak whirlpool before the floating islands installation, and solving with layout change alone is judged to be difficult. In the case of revised proposal 2, in the downstream area of the floating islands, the reduction of whirlpool’s impact was confirmed because of smooth flow; thus, good flow is deemed to be formed compared with the design proposal and revised proposal 1.
Differences in bottom velocity and shear stress around the floating islands were found to be minimal in the design proposal (revised proposals 1 and 2; see Figure 18).
5. Conclusions
This study comparatively analyzed water levels, velocity distributions, and flow durations with regard to flood frequency of 200 years and riverside flood discharge (7066 m3/s) in the Banpo zone to review the impacts of the floating island design proposal on the safety of flood control.
Although water level rise was locally observed due to the clash between the flow and the floating islands in terms of the surrounding water level change following floating islands installation, no water level rise impact was observed based on the water level comparison at the upstream measurement lines. There was no big difference by flood frequency in water level impacts due to the clash between the flow and the floating islands as a local phenomenon, which was observed within the section of about 5 - 10 m upstream of the floating islands. The experiment result suggests that the installation of the floated structure within the river does not have a huge effect on the water level of the relevant river section.
The analysis of the changes in bottom velocity and shear stress surrounding the floating islands was carried out for the purpose of predicting riverbed change that may be caused by the floating islands installation.
Although change of maximum shear stress exists, overall distribution difference was minimal according to the measurement points. The increase in shear stress arising from the floating islands installation was minimal; thus seemingly not affecting the riverbed. In the case of a large river with sufficient depth, the increase in shear stress owing to floating structure is not considered huge. When the structure is close to a riverbank, however, this can cause an increase in surface velocity under the riverside discharge condition, and this needs to be taken into account. Based on the experiment result of this study, a
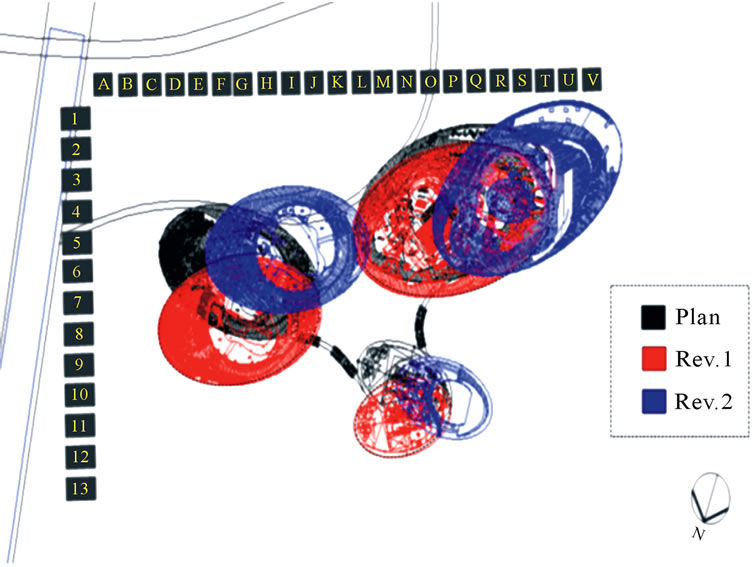
Figure 16. Revised proposal of layout of floating islands.

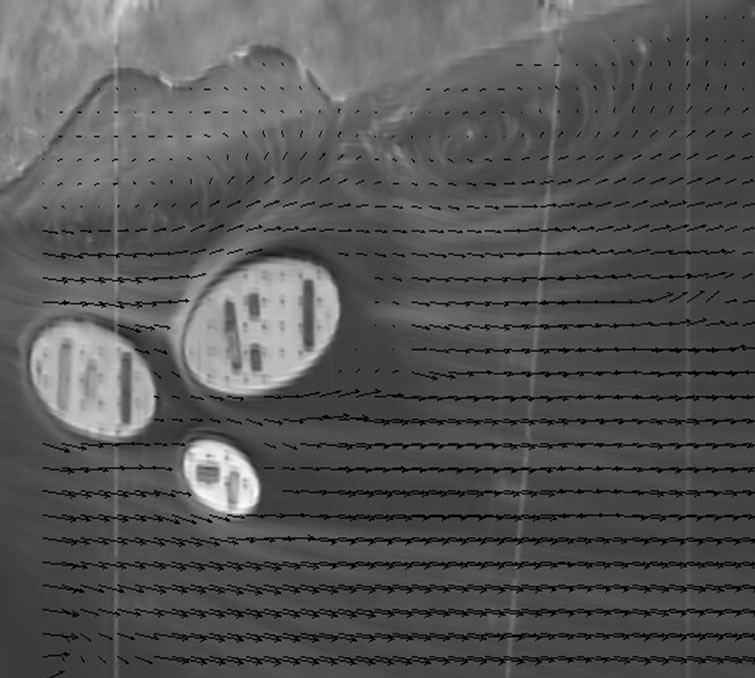
Figure 17. Planned cross sectional surface current field after floating islands (Frequency of 200 years and bankfull discharge).
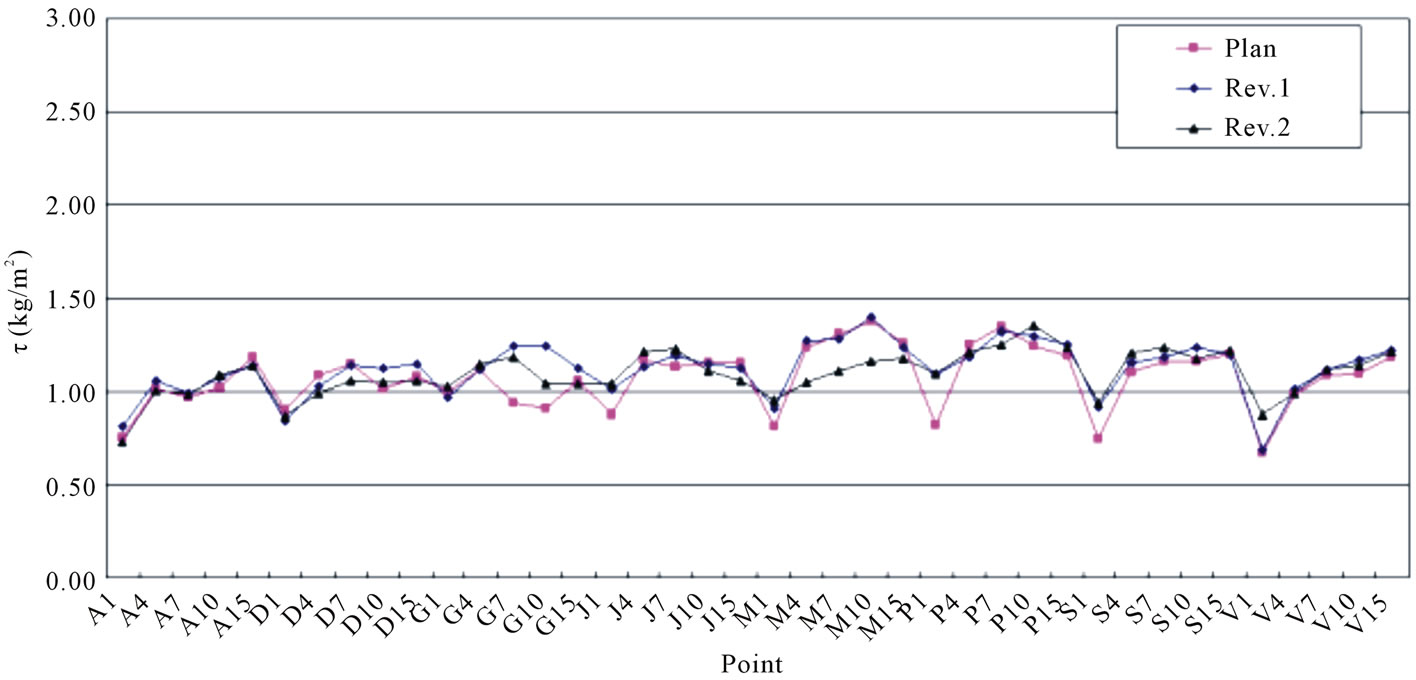
Figure 18. Comparison of shear stresses surrounding the floating islands.
proposal to reduce the external force around the riverbank by changing flow duration was presented.
REFERENCES
- A. Harpold and S. Mostaghimi, “Stream Discharge Measurement Using a Large-Scale Particle Image Velocimetry Prototype,” Proceedings of Virginia Water Research Symposium, Blacksburg, 4-6 October 2004, pp. 178-185.
- ASCE Task Committee, “Hydraulic Modeling: Concepts and Practice,” Manuals and Reports on Engineering Practice No. 97, ASCE, Reston, 2000.
- G. Dramaisa, J. L. Coza and B. C. A. Hauetb, “Advantages of a Mobile LSPIV Method for Measuring Flood Discharges and Improving Stage-Discharge Curves,” Journal of Hydro-Environment Research, Vol. 5, No. 3, 2011, pp. 301-312. doi:10.1016/j.jher.2010.12.005
- R. J. Adrian, “Particle Imaging Techniques for Experimental Fluid Mechanics,” Annual Review of Fluid Mechanics, Vol. 23, No. 1, 1991, pp. 261-304. doi:10.1146/annurev.fl.23.010191.001401
- M. Raffel, C. Willert and J. Kompenhans, “Particle Image Velocimetry: A Practical Guide,” Springer, New York. 1998.
- E. A. Meshleh, T. Peeva and M. Muste, “Large Scale Particle Image Velocimetry for Low Velocity and Shallow Water Flows,” Journal of Hydraulic Engineering, Vol. 130, No. 9, 2004, pp. 937-940. doi:10.1061/(ASCE)0733-9429(2004)130:9(937)