Engineering
Vol. 3 No. 3 (2011) , Article ID: 4143 , 4 pages DOI:10.4236/eng.2011.33026
Study of Ni/Al Interface Diffusion by Molecular Dynamics Simulation*
Key Laboratory of OptoElectronic Science and Technology for Medicine of Ministry of Education, Fujian Provincial Key Laboratory for Photonics Technology, School of Physics and OptoElectronics Technology, Fujian Normal University, Fuzhou, China
E-mail: cgzhang@fjnu.edu.cn
Received December 23, 2010; revised January 11, 2011; accepted January 14, 2011
Keywords: Molecular Dynamics Simulation, Interface Diffusion, EAM Potential
ABSTRACT
Molecular dynamics simulation of Ni/Al interface diffusion is carried out by Embedded Atom Method (EAM) potential. The problem how the temperature affects Ni/Al interface diffusion is discussed. The initial dynamic behavior of Ni/Al interface diffusion at high temperature is shown. The study in this letter is helpful to understand the origin of diffusion phenomenon.
1. Introduction
Diffusion is a method of substance transition. Many processes occurring in actual material proceed through it and is under the control of it. The research on the diffusion is significant. Ni based high temperature alloy is widely used in gas engine industry [1-3]. The Al2O3 film on the alloy surface is very steady at high temperature. For increasing the using temperature and enlarge its using range, the Alumina coat of Ni based high temperature alloy is developed. This kind of coat can satisfy generic performance requirement with lower cost and good stability. The importance of Ni based high temperature alloy and its alumina coat has made the study on this material become a hotspot in the material area. Previous studies mostly focus on the actual material experiments and thermodynamics characters. The investigation about the dynamics behavior deep to the atom scale is less. Its microcosmic mechanism on atom scale is not very clear. Especially, the study of the initial stages on the diffusion reaction is much less for the limitation of experiment conditions. In this paper, the dynamic behavior of Ni/Al interface diffusion which happens during the initial reaction stage is investigated carefully by molecular dynamics simulation.
2. Molecular Dynamics Simulation
The first process of molecular dynamics simulation is setting the initial condition. As shown in Figure 1(a), the initial model of the simulation is a computational box of 4a0 × 4a0 × 11a0. The below box of 4a0 × 4a0 × 9a0 stands for the base with fcc Ni atoms being placed in it. The fcc Al atoms are placed in the above box of 4a0 × 4a0 × 2a0. The lattice constant is set by that of Al (It is 4.05Å). [001] face is the initial Ni/Al interface. Repeating boundary condition is used in the direction of [100] and [010]. In the direction of [001], free boundary condition is used to avoid appearing two interfaces in the model. Newton moving equation is solved by Verlet method [4]. Time step size is 2.8 × 10⁻¹⁵ s. We select the interact potential of Embedded Atom Method (EAM) [5,6].
To study the behavior of Ni/Al interface diffusion, we have designed the simulation method from two aspects: 1) The function of temperature on Ni/Al interface diffusion is studied. The system is run for 160000 time steps at 300 K, 400 K, 500 K, 600 K, 700 K and 800 K respectively. The coordinates of every atom corresponding to time are remembered in the process of simulation. 2) The Ni/Al interface diffusion at high temperature is studied. First, the system is run at constant 500 K for 20000 steps. For the initial lattice constant is set at 4.05Å. Ni atom lattice constant at the base is smaller than this value actually; the relaxation at lower temperature of 500 K can help Ni lattice adjusting to its actual size. Thus the precision of simulation can be improved. Then, the temperature of the system is changed to the high temperature of 1200 K. At constant 1200 K, the system is run for 480000 steps till the simulation stops. The information such as the atoms’ coordinates is recorded every certain time during the process of simulation.
3. Results and Discussions
3.1. The Function of the Temperature on the Ni/Al Interface Diffusion
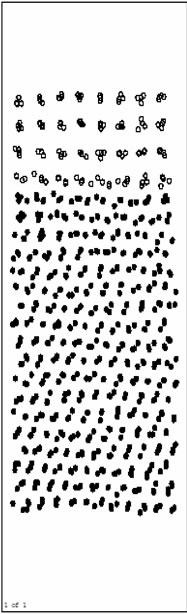
The initial model along with the coordinate system is shown in Figure 1(a).
Figure 1(b) to Figure 1(g) are the pictures of atoms position after running 160000 time steps at 300 K, 400 K, 500 K, 600 K, 700 K and 800 K, respectively. From Figure 1(b) to Figure 1(g), we can observe that the vo-
 (a)
(a)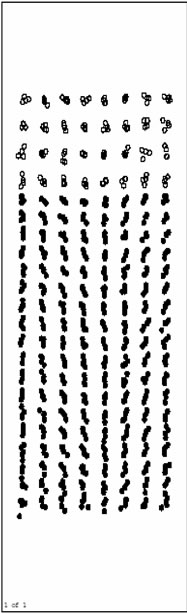 (b)
(b)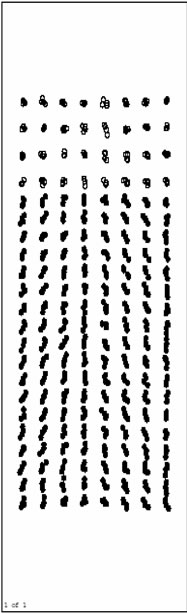 (c)
(c) (d)
(d)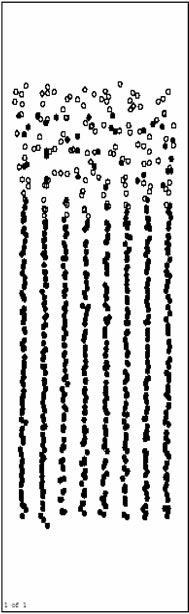 (e)
(e)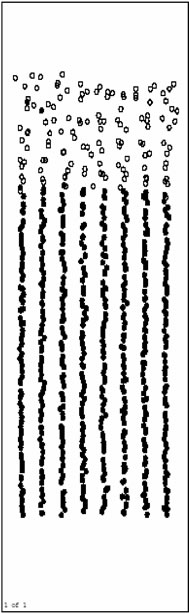 (f)
(f)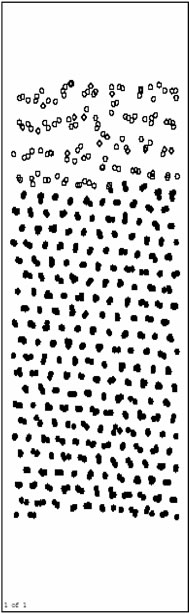 (g)
(g)
Figure 1. The atoms position pictures at different temperature (in this paper, solid dot stands for Ni atom; hollow dot stands for Al atom). (a) The initial model of simulation; (b) 300 K; (c) 400 K; (d) 500 K; (e) 600 K; (f) 700 K; (g) 800 K.
lume of the base has decreased on different extent than initial model at every temperature.
In Figure 1(b)-1(f), we can see the interface diffusion has not taken place, Ni atoms in the base and Al atoms on the surface all keep solid when the temperature is lower than 700K. Figure 1(g) shows that Al atoms turn to liquid and Ni/Al interface diffusion begins to take place when the temperature is high to 800 K.
This study shows that Ni/Al interface diffusion is controlled by temperature.
3.2. The Behavior of Ni/Al Interface Diffusion at High Temperature
Figure 2 shows the postions of the atoms after running 20000 time steps at 500 K. From Figure 2, we know that the interface diffusion has not taken place. In this process, the lattice of Ni base is automatically relaxing for optimum, the volume on the base is widely decreased comparing with initial model, but Al layers on the surface do not change obviously. Till 20000th step, the system has relaxed to balance. During this process, the orientation of crystal face for Ni appears a turn due to the volume adjustment.
Then, the temperature is adjusted to 1200K.
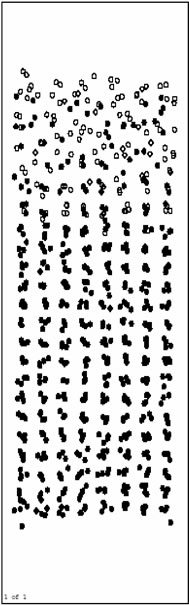
Figure 3(a), Figure 3(b) and Figure 3(c) are respectively the atom position picture after running for 200, 1000, 4000 steps at 1200 K. Pure Al layers on the surface begin to melt quickly during this time (before 4000th step).The Ni base still keep solid, and the orientation of crystal face turns back parallel to the initial model. Ni/Al interface does not move obviously. It indicates that Inter-diffusion has not taken place yet.
Figure 3(d) and Figure 3(e) are respectively atoms position picture after running 10000 and 15000 time
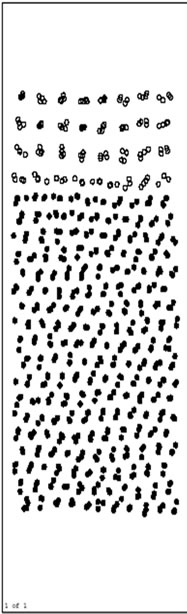
Figure 2. Atoms position picture after running 20000 time steps at 500K.
steps at 1200 K. From 4000th step, inter-diffusion reaction takes place gradually. Ni atoms in the base diffuse towards the surface rapidly, and Al atoms as a whole move to the base. This process makes the inter-diffusion layers become thicker and thicker. At the same time, orderly inter-diffusion region/pure Ni region interface can be observed easily. During the inter-diffusion, the diffusion velocity of Ni (up to the surface)is obviously faster than that of Al (down to the base). This indicates that the activity of Al metal is relatively lower at this temperature (1200 K), and the results agree with related experiment.
Figure 3(f), Figure 3(g) and Figure 3(h) are the pictures of atoms position after running 20000, 40000 and 80000 time steps at 1200 K, respectively. From about 20000th step, inter-diffusion layers begin to be solidified gradually for the influence of solid base. Besides, the solidification phenomenon happens from the base surface. It agrees with the growing rule of the liquid phase film.
Figure 4 is Ni-Al phase picture on experiment. The melting point of Ni-Al liquid increases with the mount of Ni. The melting point of Ni-Al liquid will be higher than the simulation temperature when the mount of Ni in the liquid reaches certain value. Then solidification phenomenon appears. The simulation has shown that the inter-diffusion layers begin to be solidified when the interface diffusion happened certain time, the simulation is agree with Ni-Al phase picture.
The atoms position picture after running 480000 time steps (1.344 ns) at 1200 K is shown in Figure 3(i). Inter-diffusion layers have been solidified completely with
 (a)
(a)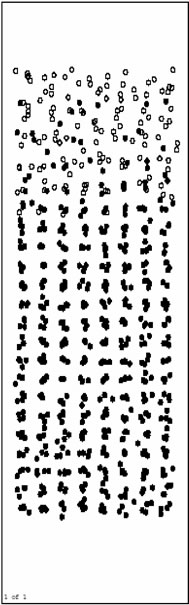 (b)
(b)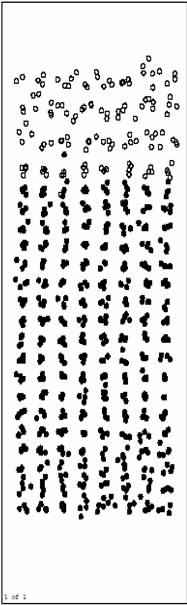 (c)
(c)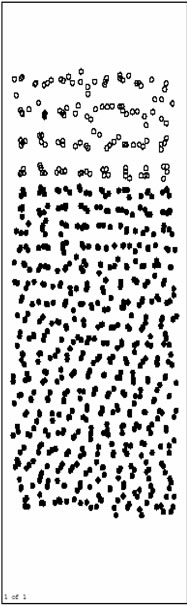 (d)
(d)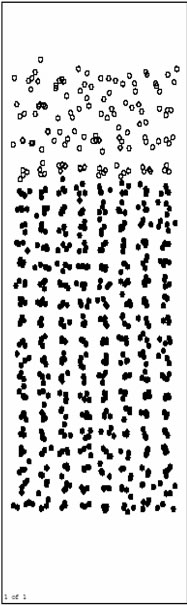 (e)
(e)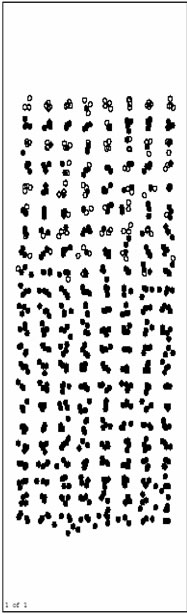 (f)
(f)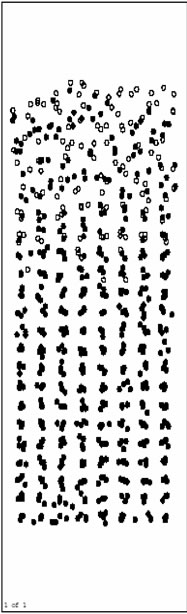 (g)
(g)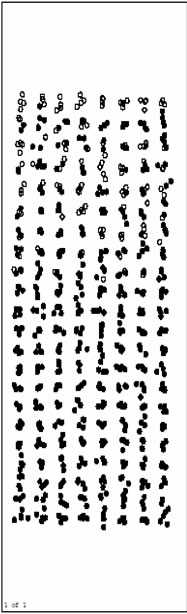 (h)
(h)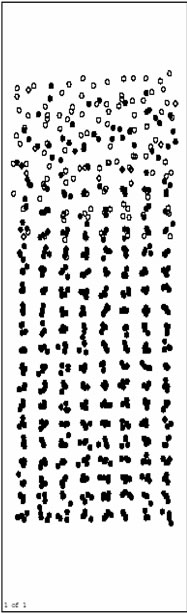 (i)
(i)
Figure 3. Atoms position picture after running certain time steps at 1200K. (a) after running 200 time steps; (b) after running 1000 time steps; (c) running 4000 time steps; (d) after running 10000 time steps; (e) after running 15000 time steps; (f) after running 20000 time steps; (g) after running 40000 time steps; (h) after running 80000 time steps; (i) after running 480000 time steps.
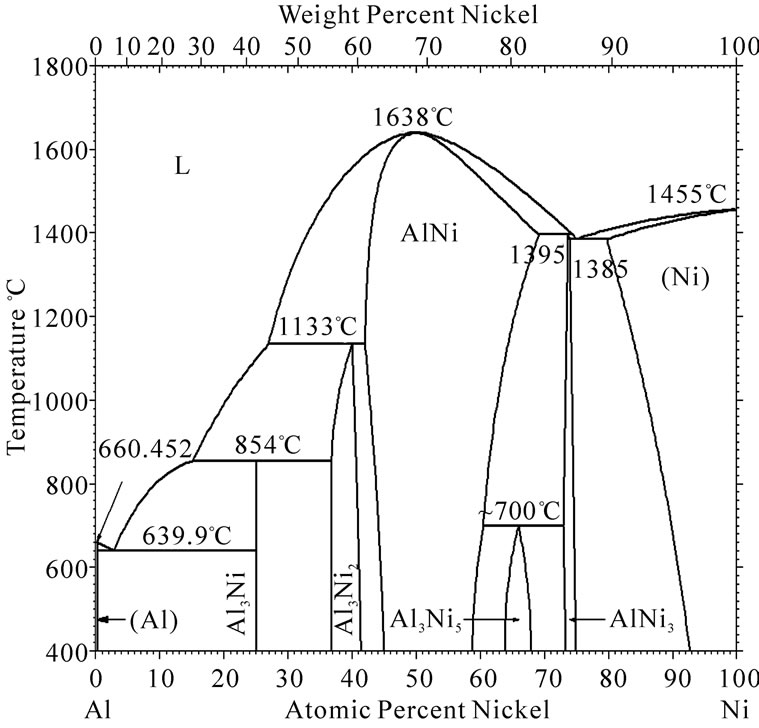
Figure 4. Phase picture of Ni-Al system.
regular crystal construction at that time. Some aspects of crystal construction can be preliminarily aquired from Figure 5. In the top three layers of the inter-diffusion surface, atoms turn into bcc NiAl. The surface orientation is β-NiAl(110)//Ni(010)base, but the lattice constant of β-NiAl is the same as Ni atoms. Furthuremore, A transitional region exists between β-NiAl and Ni base, it is a fcc construction in which Al atoms have replaced part of Ni atoms.
For getting more rules about the change of inner construction of inter-diffusion region during simulation, we select the central region (where Al atom layer is in before inter-diffusion happens, transition region when the simulation is finished) to do a concrete construction analysis.
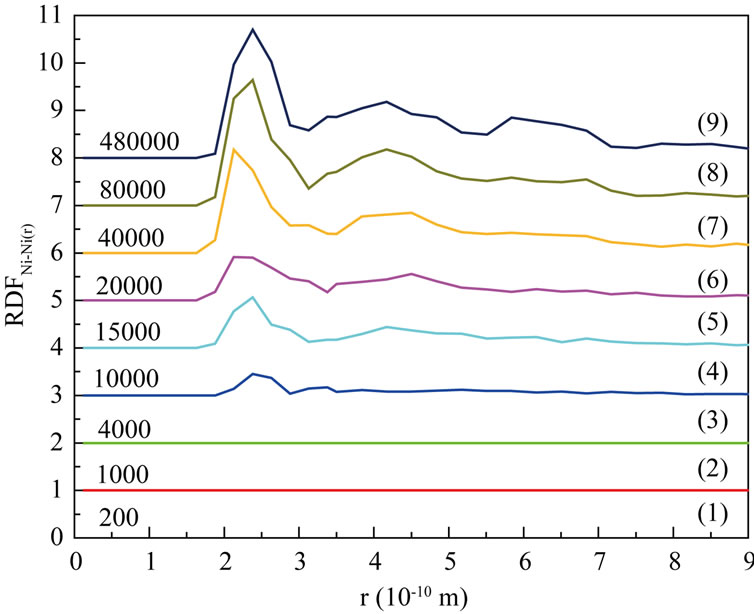
Figure 5(a)-Figure 5(c) are respectively the Radial Distribution Function (RDF) of Ni-Ni, Al-Al and Ni-Al at 1200 K. From the curves (1) to (3) in Figure 5(a)- Figure 5(c), we can see that RDFNi-Ni and RDFNi-Al are both zero, while RDFAl-Al(r) is not zero, it indicates that inter-diffusion for the atoms of different sorts has not taken place in so short time (4000 steps). At the same time, the second RDFAl-Al peak becomes smooth more and more with the process of simulation. And the second RDFAl-Al peak has disappeared till 4000th step (curve (3) in Figure 5(b)), this liquid character of the curve has itentified that Al is melting. As shown on every curve (4)-(9), RDFNi-Ni and RDFNi-Al are no more zero after 4000th step with the first peak increasing continually. This demonstrates that large numbers of Ni atoms rapidly diffuse towards the surface, it has increased the number of Ni atoms in the studied region. Thus the bond probability of Ni-Ni and Ni-Al are increased. From about
 (a)
(a)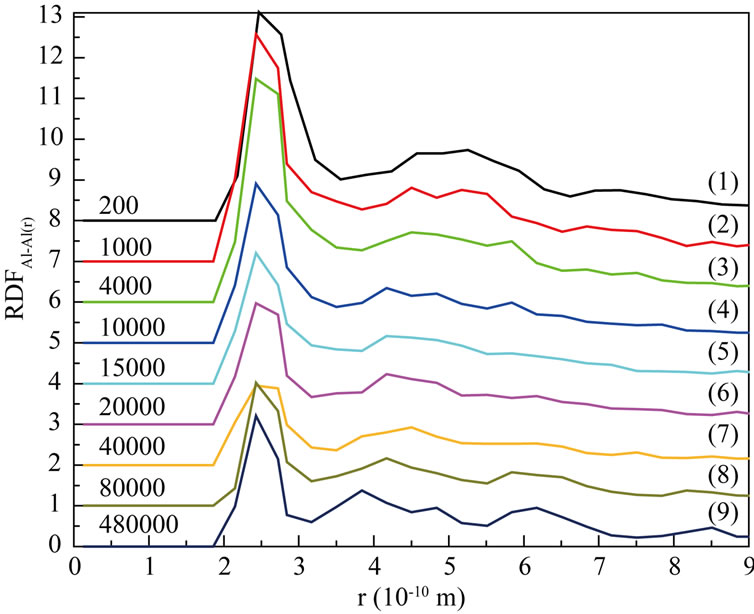 (b)
(b)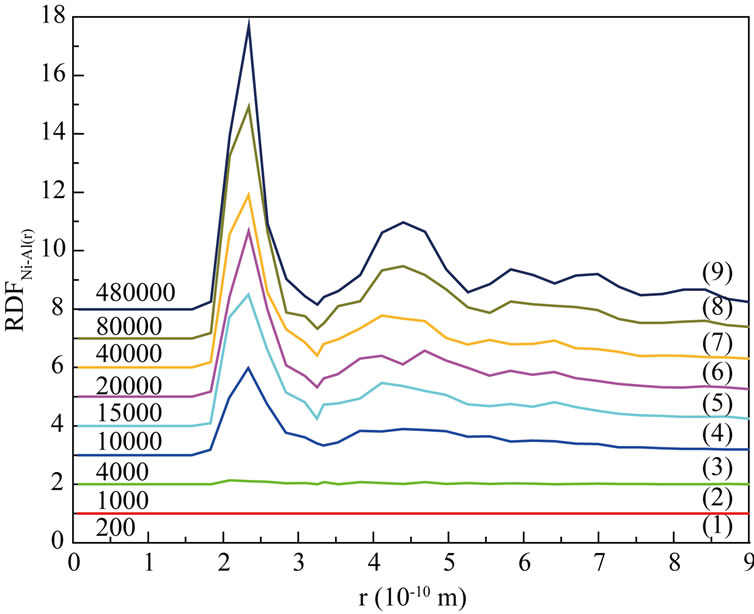 (c)
(c)
Figure 5. Radial distribution function (RDF) at 1200 K. (a) Ni-Ni; (b) Al-Al; (c) Ni-Al.
20000th steps, we can see the following characters on every curve: on one hand, 1st peak of RDFNi-Ni and RDFNi-Al increase more and more, the other peaks also appear with a tendency of enhancement; On the other hand, 1st peak of RDFAl-Al still shows a falling tendency, other peaks tend to be obvious. It tells us the number of inferior neighbors is increasing, and the curves have shown the character of solid crystal. From 40000th step to the final, 1st peak of RDFNi-Al is higher than that of RDFNi-Ni and RDFAl-Al. We can conclude that bond probability between different sort of atoms is higher than the same sort. To sum up, the conclusion from RDF is well agree with that of the atom position picture.
In order to make clear the character of the final crystal structure, in Figure 6, we gives the results of bond analysis [7] within 480000 time steps (in 1.344ns) at 1200K. At the initial time, bonds of 1201 + 1211 + 1301 + 1311 which stand for diamond symmetry construction are the main part in our studied region. From the beginning to about 4000 th step, the percentage of diamond symmetry construction decreases a little (As we know, this period is related to the process of Al atoms’ melting before the inter-diffusion takes place). From 4000th to 15000th step, bond percentage changes much rough, total percentage of 1201 + 1211 + 1301 + 1311 bond increases with high speed (from 35% up to 58%), other bonds such as 1421, 1422, 1431, 1541, 1551 all have a different increase (from the atom position picture, we know that many Ni atoms diffuse towards the surface in this period). The existence of 1431, 1541, 1551 bond indictes the liquid and amorphous construction in studied region. From 20000th to 80000th step, the bond percentage changes rougher: total percentage of 1201 + 1211 + 1301 + 1311 falls down fast from 58% to 41%; the whole increasing range for 1421 + 1422 bond has reached 25%; and about
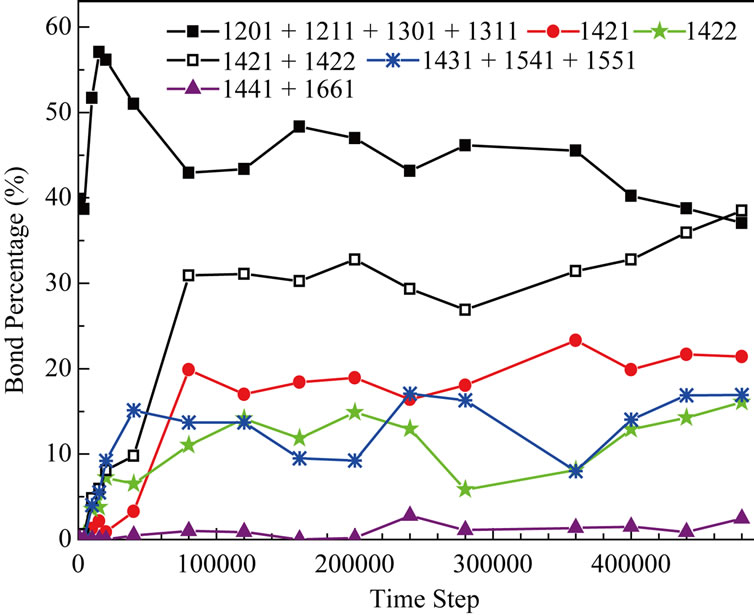
Figure 6. The bond percentage versus the simulation time in 480000 time steps.
5% increment has happened on 1431 + 1541 + 1551 bond. The information of atom position picture has told us that solidification is happening in inter-diffusion region. The solidification process can stimulate the formation of fcc construction and restrain that of diamond symmetry construction, and also supply certain condition for the forming of amorphous construction. From 80000th step to the final, every bond percentage changes smoothly. At the final time of simulation, 1421 + 1422 bond which can stand for fcc construction is the most, it is 40%; then, 1201 + 1211 + 1301 + 1311 bond of diamond symmetry construction is followed, it have 37% in all; the third is the 1431 + 1541 + 1551 bond (widely exists in amorphous construction), about 15%. The percentage of 1441 and 1661 bond keeps along at a very low level.
4. Conclusions
On basis of the conducted simulation, many valuable conclusions can be got. 1) the behavior of Ni/Al interface diffusion is controled by the temperature. The temperature must be higher than 700K for the proceeding of the Ni/Al interface diffusion. 2) The rule of Ni/Al interface diffusion at the high temperature is studied. The changing of inner construction and the final construction in the inter-diffusion layers are analyzed carefully. 3) The real-time and intuitionistic atoms position picture, Radial Distribution Function and bond analysis, are all effective methods of studying inter-diffusion layer construction. In our simulation, the results from these three methods are in agreement. It ensures the reliability our conclusions. 4) In this simulation, the studied reaction of Ni/Al interface diffusion is in earlier phase (in 1.344 ns). Actually, the interface reaction rule is difficult to make clear in such a short time by experimental method. Our theoretical simulation can fill the deficiency of experiment.
5. REFERENCES
- J. Qi and Y. Song, “Experimental Studies on the Diffusion Reaction of Al /Ni /Fe Interface,” Metal Materials and Metallurgy Engineering, Vol. 35, No. 6, 2007, pp. 8-11.
- Y. Song, S. Li and G. Du, “Forming Rule of Ti/Cu Interphase Diffusion Solution Zone,” Rare Metal Materials and Engineering, Vol. 38, No. 7, 2009, pp. 1188-1192.
- M. Liu, J. Zhang and K.Xu, “Interface Diffusion and Resistivity of Ni/Al Nanomultilayers,” Acta Metallurgica Sinica, Vol. 44, No. 3, 2008, pp. 357-360.
- L. Verlet, “Computer Experiments on Classical Fluids,” Physical Review B, Vol. 159, No. 1, 1967, pp. 98-103. doi:10.1103/PhysRev.159.98
- M. S. Daw and M. I. Baskes, “Emebedded Atom Method Derivation and Application to Impurities, Surfaces, and Other Defects in Metals,” Physical Review B, Vol. 29, No. 12, 1984, pp. 6443-6453. doi:10.1103/PhysRevB.29.6443
- A. F. Voter and S. P. Chen, “Intermetallic Compounds: Principles and Practice,” Proceedings of Materials Research Society Symposium, Vol. 82, 1987, pp. 175-177.
- J. D. Honeycutt and H. C. Andresen, “Molecular Dynamics Study of Melting and Freezing of Small Lennard-Jones Clusters,” The Journal of Physical Chemistry, Vol. 91, No. 19, 1987, pp. 4950-4963. doi:10.1021/j100303a014
NOTES
*Natural Science Foundation of Fujian Province of China (2010J05131 and 2010J05129)