Intelligent Control and Automation
Vol.4 No.2(2013), Article ID:31734,16 pages DOI:10.4236/ica.2013.42019
Homeostasis Lighting Control System Using a Sensor Agent Robot
Department of System Design Engineering, Keio University, Yokohama, Japan
Email: tatsuya930@gmail.com
Copyright © 2013 Tatsuya Akiba, Akira Mita. This is an open access article distributed under the Creative Commons Attribution License, which permits unrestricted use, distribution, and reproduction in any medium, provided the original work is properly cited.
Received January 18, 2013; revised February 18, 2013; accepted February 27, 2013
Keywords: Homeostasis; Lighting Control; Sensor Agent Robot; Human Tracking
ABSTRACT
In this study, “homeostasis”, the function by which living things keep their constancy, was emulated as a lighting control for a building space. The algorithm we developed mimics the mechanisms of the endocrine and immune systems. The endocrine system transmits information entirely, whereas the immune system transmits information with a concentration gradient. A lighting control system using the proposed algorithm was evaluated in a simulation and experiment using a sensor agent robot. In this algorithm, a robot recognizes a person’s behavior and uses it to decide his or her preference as to the illuminance. The results indicate that the algorithm can be used to realize a comfortable lighting control in several situations.
1. Introduction
There have been numerous studies on intelligent spaces in which sensors are installed [1,2]. For instance, infrared sensors are being used in lighting control systems to recognize the presence of persons in the controlled space [3]. Such a system is able to turn on or off lighting when someone enters or leaves a space. But depending on the sensor, if a person keeps still, a system may consider that there is nobody in the room and turn off the lights. Moreover, it is difficult for such a simple system to respond to complicated needs, for example, by varying the illuminance appropriately. Another problem with current lighting control systems is that many sensors need to be installed in the space.
Here, we tried to exploit “homeostasis”, the function by which living things keep their constancy [4]. In applying this function to the control of building spaces, we realized a lighting control that can respond appropriately to the complicated needs of the occupants. In this paper, we describe a comfortable lighting space that imitates the homeostasis systems of living things. We evaluated our system in a simulation and experiment. The experiment differed from other studies [5] in that the sensors were not installed throughout the space to be controlled. Instead, a sensor agent robot played the role of measuring the illuminance and controlling the lighting devices.
2. Homeostasis
A number of algorithms that imitate the functions of living things, for example, neural networks [6] and the genetic algorithm [7], have been proposed as ways of controlling appliances. We developed a “homeostasis algorithm” that imitates the functions of the endocrine and immune systems.
2.1. Endocrine and Immune Systems
Figure 1 is an image of the endocrine system. The hypothalamus in the brain promotes the secreting cells that emit hormones and spread in the body uniformly through blood vessels. The cells of the body have receptors through which they receive specific hormones. Figure 2 is an image of the immune system. Here, an infected cell (by a virus) attaches to lymphocyte, and the lymphocyte emits “cytokines” with a concentration gradient. Immune cells which have receptors receive specific cytokines and behave with a protective response.
3. Proposed Algorithms
3.1. Definition
Ambient lighting devices are set on a ceiling for illuminating the entire space, and task lighting devices are set on desks for illuminating the space near each desk. The
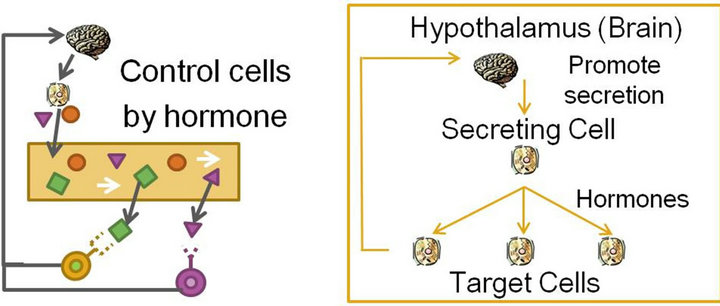
Figure 1. Image of endocrine system.

Figure 2. Image of immune system.
luminance of each lighting device can be controlled in 100 steps. Devices placed underneath the lights measure the illuminance. In the case of measuring ambient light, they are placed at desk height under the ambient light. In the case of measuring the task light, they are put on the desk directly under the task light. A comfortable lighting system is realized by using the measured illuminance as feedback for the homeostasis algorithm.
Figure 3 is an image of the target space. The building space acquires the characteristics of a living thing in which the lighting devices act as immune cells, the human acts as the hypothalamus (brain), and the robot acts as a hormone secreting cell. The cells are where the illuminance is measured and lighting devices are mounted, and consequently we call them “illuminance measuring cells” and “lighting device cells”. This target space has ambient lights and task lights, and to distinguish them if necessary, we call them the “ambient illuminance measuring cell” “task illuminance measuring cell”, “the ambient lighting device cell” and “task lighting device cell”. In the building space, “illuminance measuring cells” and “lighting device cells” have the role of “measuring illuminance and emitting information about the control devices” and the role of “obtaining the information and controlling the devices”.
3.2. Algorithm Based on Endocrine System
This algorithm imitates the endocrine system. The hypothalamus (brain) promotes the secreting cells in order to emit hormones in the body uniformly. In the homeostasis algorithm, a robot recognizes the person’s behavior, and it decides his or her preference as to the illuminance from the observed behavior. The robot transmits the “ambient target illuminance” to all ambient illuminance measuring cells and transmits the “task target illuminance” to the task illuminance measuring cell nearest to the person. In other words, the robot transmits the information on the target illuminance to the entire space using the endocrine system in response to the person’s behavior. When the person’s behavior changes, a new target illuminance is transmitted. Figure 4 is the image of how the endocrine system works.
3.3. Algorithm Based on Immune System
In the immune system, an infected cell attaches to a lymphocyte and the lymphocyte emits “cytokines” with a concentration gradient. Immune cells receive specific cytokines and behave with a protective response. This algorithm imitates the immune system. When the illuminance measuring cells receive the information on the target illuminance, they measure the current illuminance and calculate the difference between the measured illuminance and the target illuminance. These differences are treated like a viral infection in the case of living things. Each illuminance measuring cell calculates discomfort factors from the difference and emits them into the target space with a concentration gradient like in the
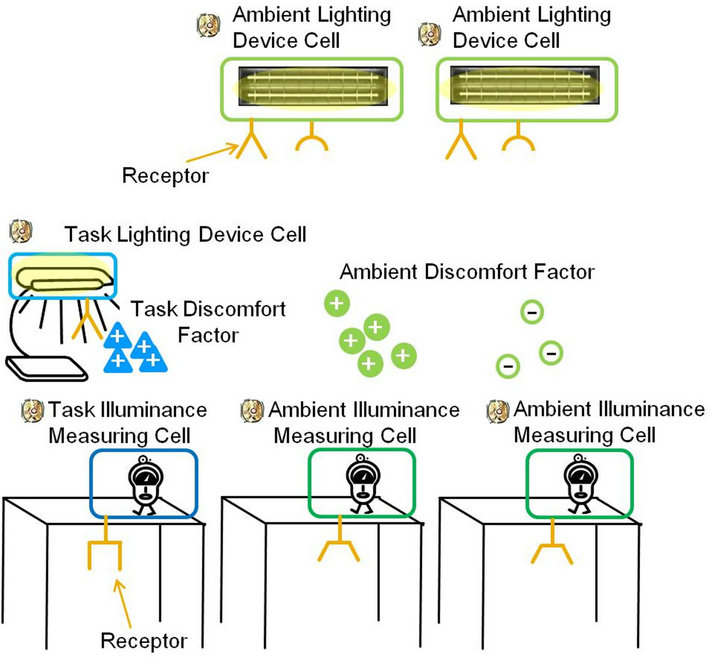
Figure 3. Image of target space.

Figure 4. Application of endocrine system.
immune system. Ambient discomfort factors (discomfort factors which ambient illuminance measuring cells emit) are received by ambient lighting device cells in inverse proportion to the square of the distance between the ambient illuminance measuring cell and the ambient lighting device cell. Task discomfort factors (discomfort factors which task illuminance measuring cells emit) are received by both task lighting device cells and ambient lighting device cells in inverse proportion to the square of the distance between the task illuminance measuring cell and the lighting device cell. Each lighting device cell that received discomfort factors increases its own power level in accordance with the received discomfort factors. The lighting devices illuminate the space at these power levels, and the illuminance measuring cells thereby fill in the gaps between the measured illuminance and target illuminance. By repeating this algorithm, the illuminance in the room converges to the target illuminance. In terms of a system of receptors, the ambient discomfort factors are received by all ambient lighting devices cells and the task discomfort factors are received by the nearest task lighting device and all ambient lighting devices.
Figure 5 is an image of the immune system application.
3.4. Application to Lighting Control
This algorithm can deal with many situations. First, it can account for the case of noise (sunlight or other lighting devices). Each illuminance measuring cell controls lighting device cells with the feedback of its own illuminance; therefore, it can reduce the power of the lighting device cells by emitting negative discomfort factors when the illuminance measuring cell measures higher than its target illuminance due to noise. Figure 6 illustrates lighting control in the presence of sunlight.
Second, the algorithm can deal with broken lighting devices. A broken lighting device cannot receive discomfort factors. The discomfort factors that should have

Figure 5. Immune system application.

Figure 6. Lighting control in the presence of sunlight.
been received by the broken lighting device are distributed to the neighbor devices near the broken one. The neighbor lighting device cells can compensate for the lost illumination of the broken lighting device cell. Figure 7 is the image of lighting control in the case of a broken lighting device.
4. Simulation
The simulation was of the office space shown in Figure 8.
In this space, ambient lighting devices are set on the ceiling and task lighting devices are set on the desks. The windows are on the north side, and sunlight enters the space through them. In the case of noise from the other lighting devices, a noise device constantly emitting illumination is assumed to be mounted on the ceiling at the point marked “*” in Figure 8. This simulation assumes there is one person in the room. After the person enters the room, s/he sits on the chair at point “A”, and behaves according to the actions listed in Table 1. Here, we suppose that the preferred illuminance depends on the behavior. The preferred task illuminance is decided arbitrarily, and the comfortable ambient illuminance is obtained in relation to the task illuminance [8].
First, using the endocrine system, the preference task illuminance and ambient illuminance are transmitted to each illuminance measuring cell. We call this illuminance the “target illuminance”. Illuminance measuring cells predict the current illuminance from the sum of illuminances from noise (sunlight and other lighting devices) and the lighting devices and calculate discomfort factors using the difference between the target illuminance and predicted current illuminance. The relationship between the illuminance difference , predicted current illuminance Ep and target illuminance Et is like in Equation (1).
 . (1)
. (1)
The discomfort factors of the ambient illuminance
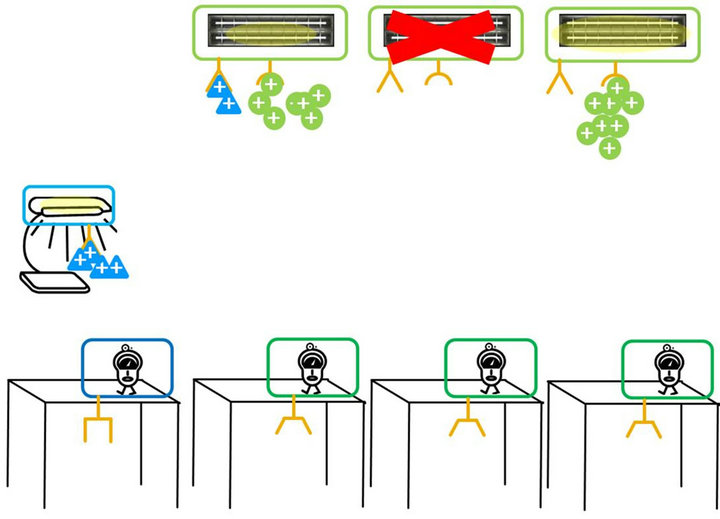
Figure 7. Lighting control when there is a broken device.
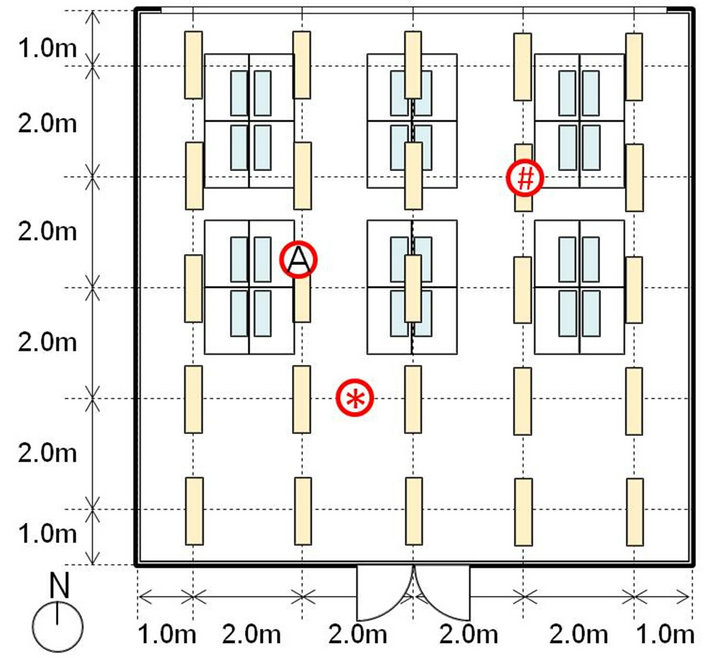
Figure 8. Simulation space.

Table 1. Behavior and preferred illuminance.
measuring cells and task illuminance measuring cells are obtained from Table 2.
Second, the discomfort factors are distributed to the
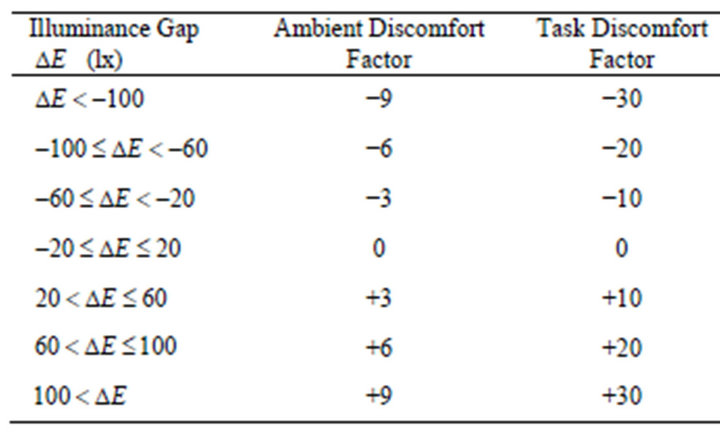
Table 2. Discomfort factors.
lighting devices cells with a concentration gradient dependent on the distance between the illuminance measuring cells and lighting device cells. The distribution ratio is in inverse proportion to the square of the distance between the illuminance measuring cells and the lighting device cells (Equation (2)). FRj is the discomfort factors which the lighting device cell j receives, FEi is the discomfort factors which the illuminance measuring cell i emits, and Di,j is the distance between lighting device cell j and illuminance measuring cell i.
 . (2)
. (2)
If there are broken lighting devices or lighting devices which cannot receive discomfort factors any more (devices at illuminance levels of 100% cannot receive positive discomfort factors, and devices with illuminance levels of 0% cannot receive negative discomfort factors), the distribution ratio is calculated without these devices. Ambient discomfort factors are received by the ambient lighting device cells and task discomfort factors are received by both task lighting device cells and ambient lighting device cells. The lighting device cells use the received discomfort factors to adjust their own power. The illumination of the ambient lighting device cell and task lighting device cell at 100% power and the illuminetion due to noise (other lighting devices) were determined by examining the actual lighting devices used in the experiment. In this study, illuminance from the lighting devices and noise (other lighting devices) were calculated under the assumption of a “point light source” like in Figure 9 and Equation (3). Sunlight was assumed to have the illuminance of unobstructed sky.
 . (3)
. (3)
The algorithm was repeated 100 times per second during the simulation period (180 s). The simulation considered only direct illuminance, not indirect illuminance.
Illuminance at an arbitrary point was obtained from the sum of illuminances of the lighting devices, sunlight and noise (other lighting devices).
4.1. Simulation 1: No Sunlight, No Other Lighting Devices and No Broken Devices
The blue line in Figure 10 is the average illuminance of the ambient illuminance measuring cells, and the blue line in Figure 11 is the illuminance of the task illuminance measuring cells. The red lines are bounds at which discomfort factors are not emitted. In other words, this system keeps the illuminance within the two red lines. It is clear that the homeostasis algorithm can control the illuminance correctly. Figure 12 is the power of the ambient lighting device cells at 50 s, and Figure 13 is the illuminance distribution at 50 s.
4.2. Simulation 2: Sunlight, No Other Lighting Devices and No Broken Devices
Figure 14 is the average illuminance of the ambient illuminance measuring cells, and Figure 15 is the illuminance of the task illuminance measuring cells. It is clear that the illuminance is controlled correctly by the homeostasis algorithm. Figure 16 is the power of the ambient lighting device cells at 50 s. The sunlight causes the ambient lighting devices on the window side to be turned off. Figure 17 is the illuminance distribution at 50 s. The window side’s illuminance is higher due to the sunlight.
4.3. Simulation 3: Sunlight, Other Lighting Devices and No Broken Devices
Figure 18 is the average illuminance of the ambient illuminance measuring cells, and Figure 19 is the illuminance of the task illuminance measuring cells. It is clear that the homeostasis algorithm correctly controls the illuminance. Figure 20 is the power of the ambient lighting device cells at 50 s, and Figure 21 is the illuminance distribution at 50 s. The influence of noise (the other lighting devices) causes the power level of the ambient lighting devices near the noise to become lower than in the case without noise.
4.4. Simulation 4: No Sun Light, No Noises and Broken Devices
Here, we suppose that the ambient lighting device at “#” in Figure 8 is broken down. Figure 22 is the average
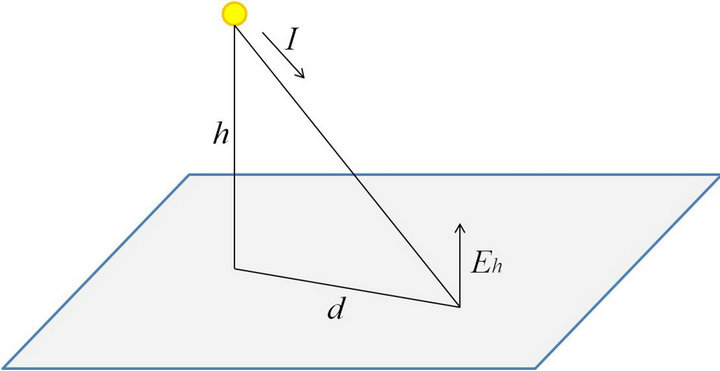
Figure 9. Light point source method.
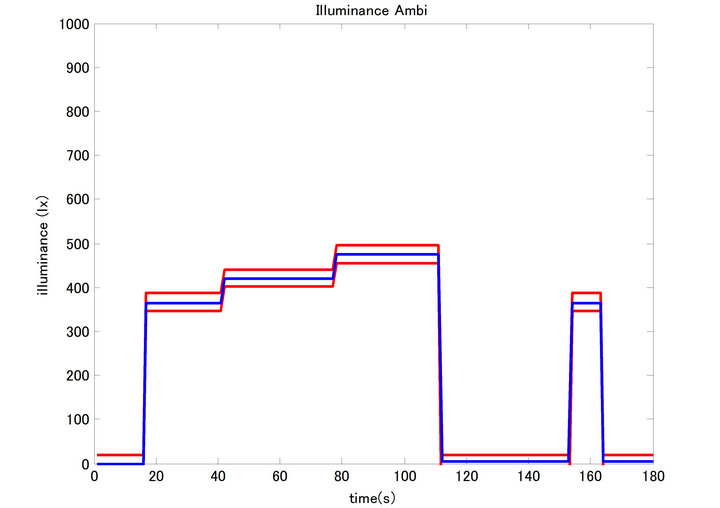
Figure 10. Average ambient illuminance.

Figure 11. Task illuminance.
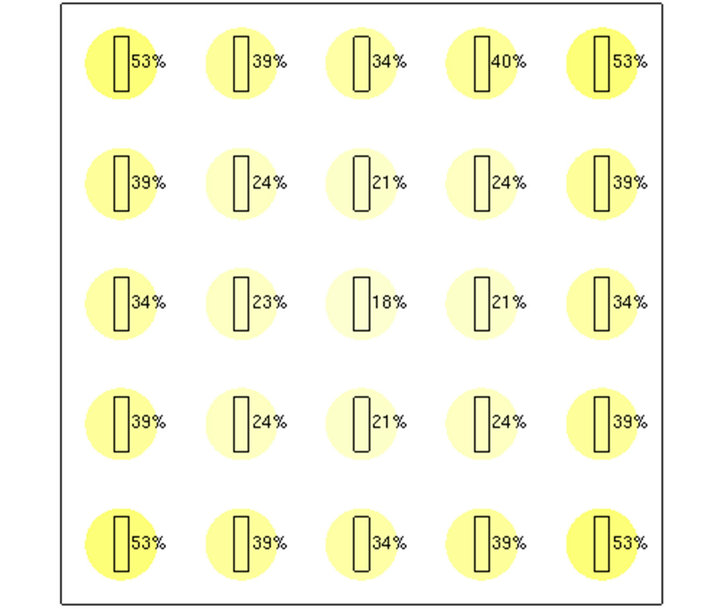
Figure 12. Power of ambient lighting device cells.
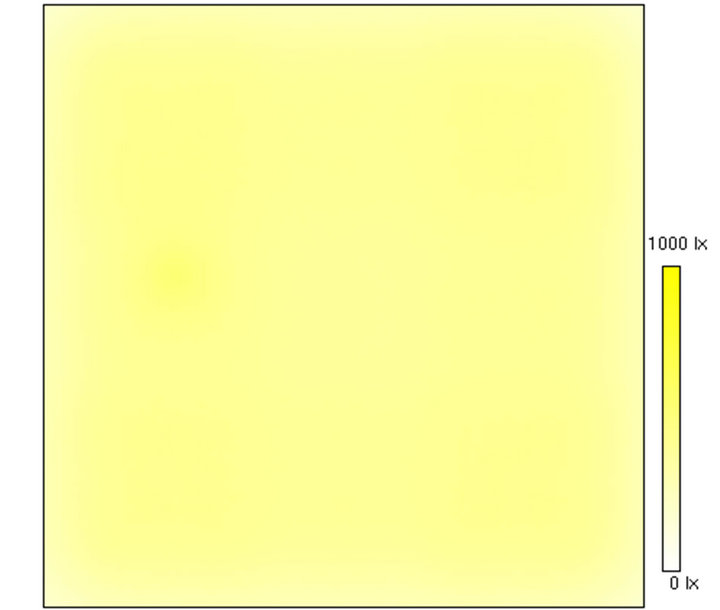
Figure 13. Illuminance distribution.
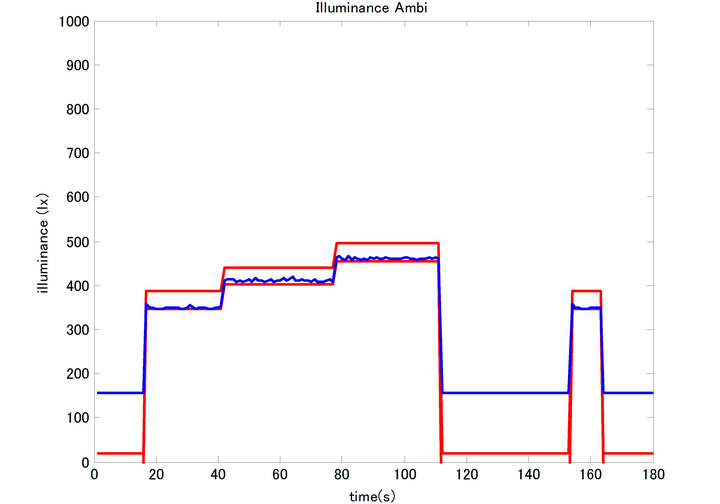
Figure 14. Average ambient illuminance.
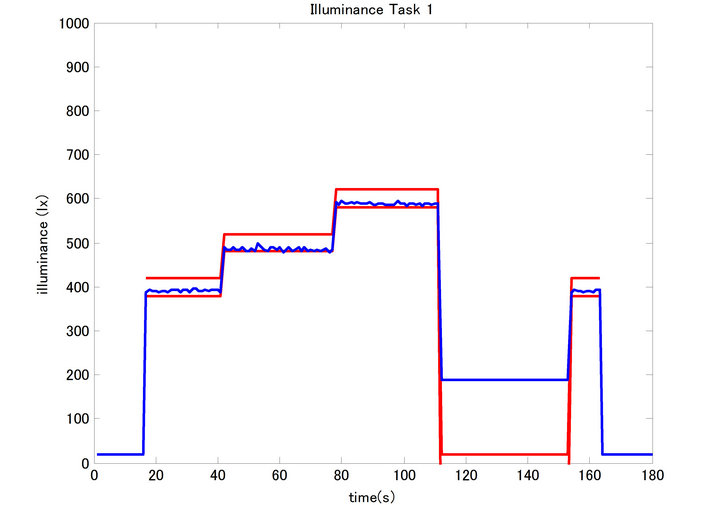
Figure 15. Task illuminance.
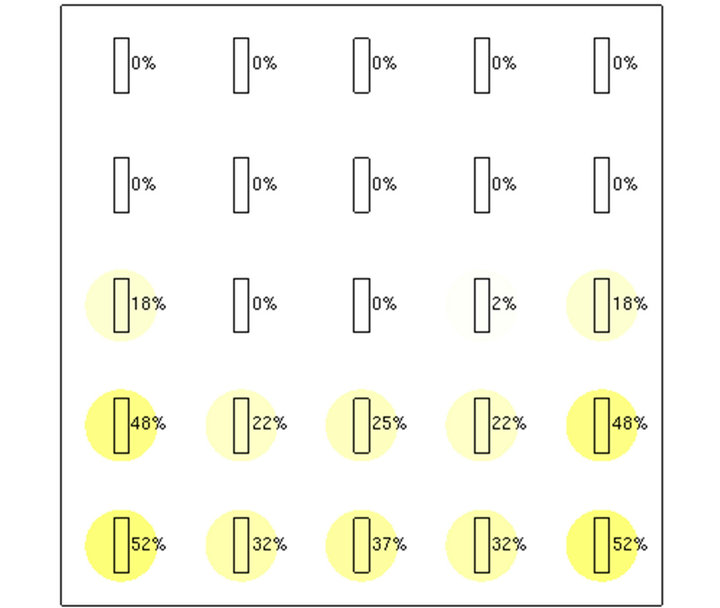
Figure 16. Power of ambient lighting device cells.
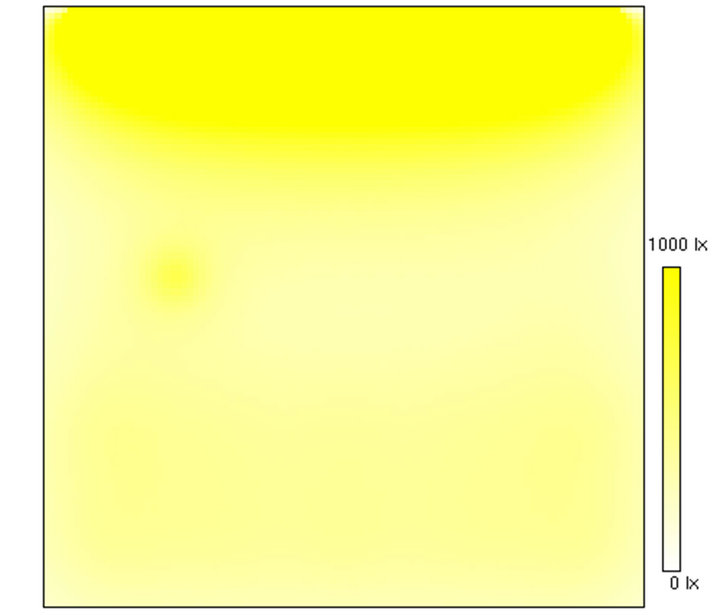
Figure 17. Illuminance distribution.
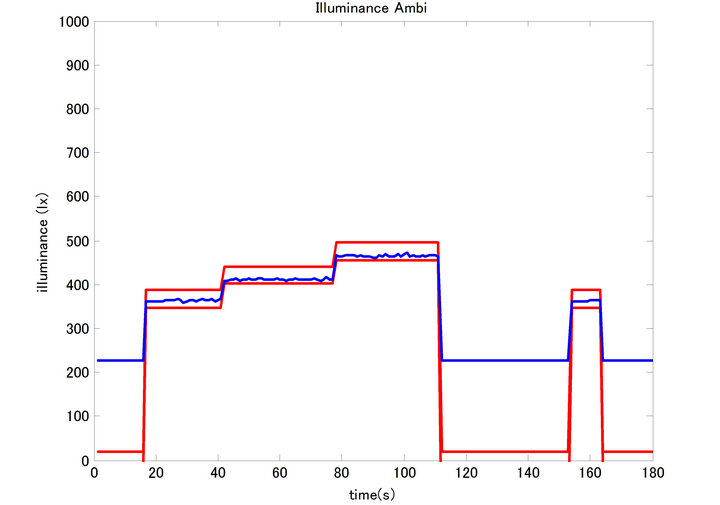
Figure 18. Average ambient illuminance.
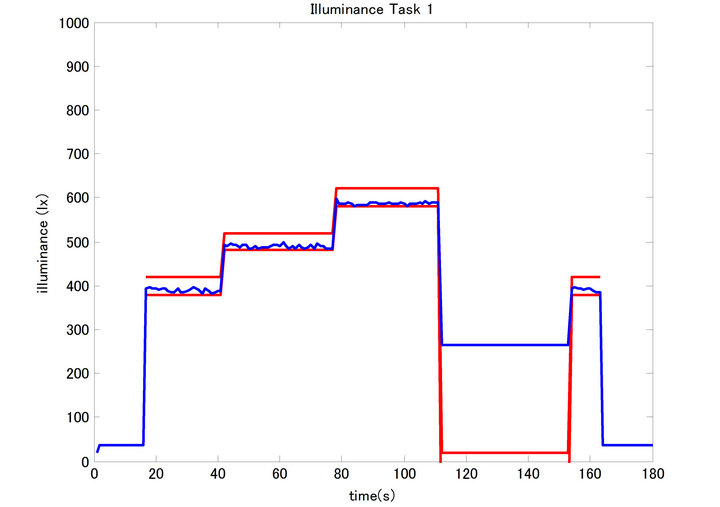
Figure 19. Task illuminance.
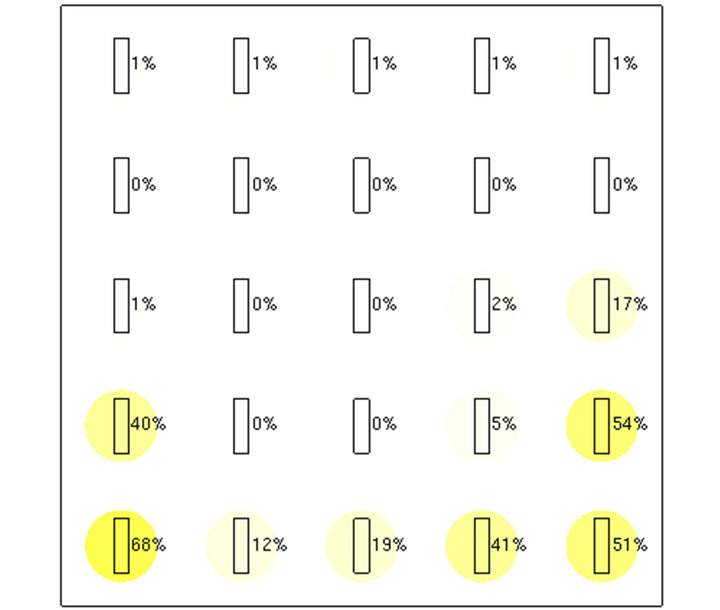
Figure 20. Power of ambient lighting device cells.

Figure 21. Illuminance distribution.
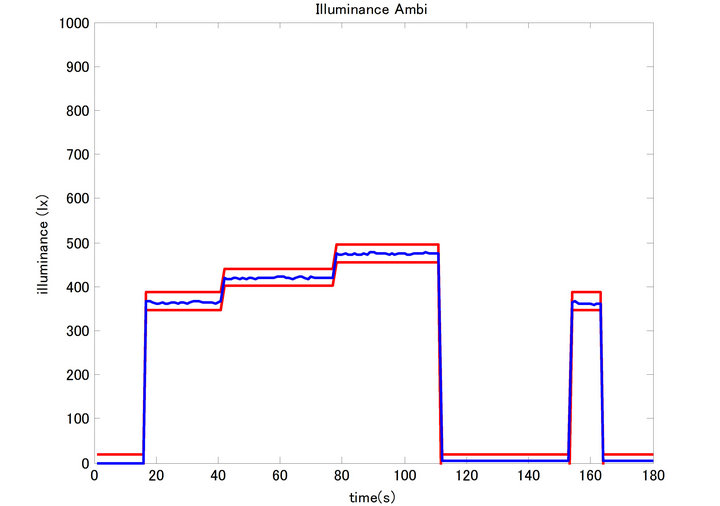
Figure 22. Average ambient illuminance.
illuminance of the ambient illuminance measuring cells, and Figure 23 is the illuminance of the task illuminance measuring cells. It is clear that the homeostasis algorithm correctly controls the illuminance. Figure 24 is the power of ambient lighting device cells at 50 s, and Figure 25 is the illuminance distribution at 50 s. The broken device does not turn on, but instead the devices around it raise their power levels higher than in the cases without the broken device, like in Figure 12. The results show that the devices can compensate for the broken one.

Figure 23. Task illuminance.
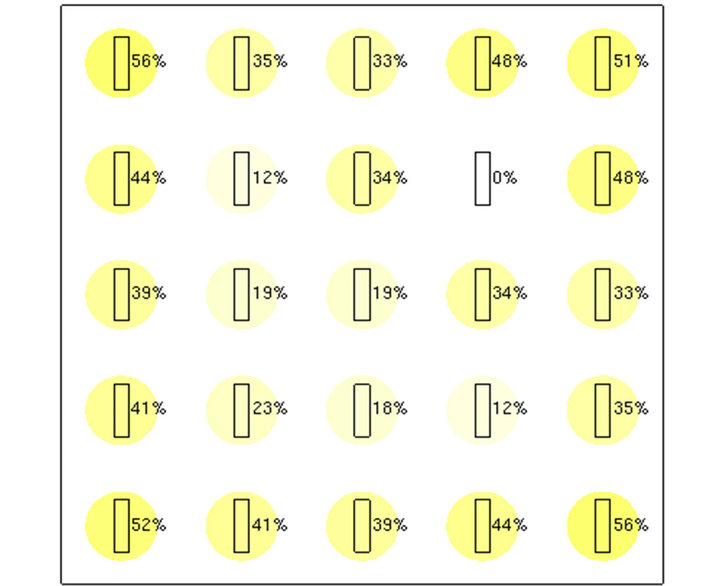
Figure 24. Power of ambient lighting device cells.
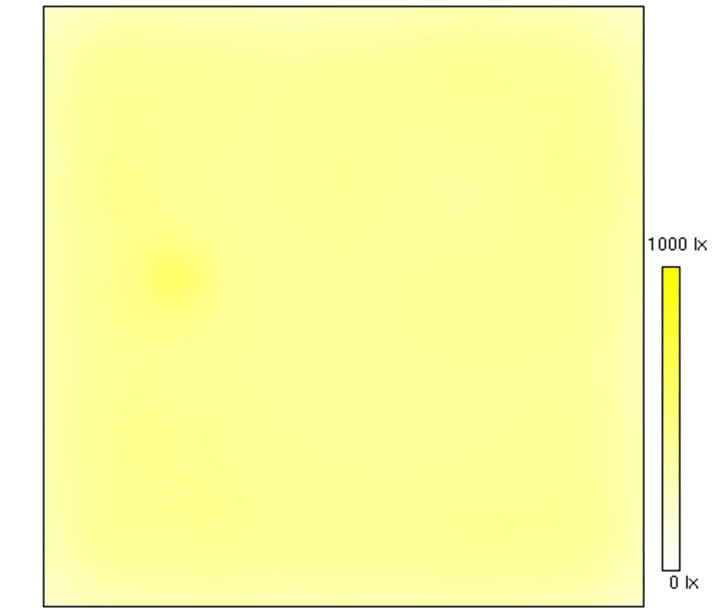
Figure 25. Illuminance distribution.
5. Demonstration Experiment
A demonstration experiment was conducted in a real environment (Figure 26) by installing LED lighting devices that could be controlled in 100 steps through the Internet. These devices were installed on the right side of the experimental space, and fluorescent lights on the left side were used as noise (the other lighting devices). There were two task areas (“a” and “b” in Figure 26).
The sensor agent robot shown in Figure 27 mounted a Kinect sensor, illuminometer, and PC. The PC controlled the robot and all the devices. Using Kinect, it followed the person, recognized his or her behavior, and measured the illuminance. It used the homeostasis algorithm to control the lighting devices through the Internet.
5.1. Human Tracking Method
Human tracking is used so that a robot may move near a person to recognize his behavior. Many human tracking methods using robots have been proposed. Belloto et al. [9] proposed a human tracking robot with a laser range finder (LRF) and color camera. Using data from the LRF, a robot was able to recognize the shape of human legs. At the same time, the color camera was able to be used to recognize human faces. Human tracking becomes possible by combining these data.
We proposed human tracking method using LRF, and

Figure 26. Experimental environment.
used it so that our robot recognized its position [10].
In this research, we used the Kinect sensor mounted on the robot to get the skeleton data shown in Figure 28. Using this data, the robot could recognize the position of the person and move in that direction.
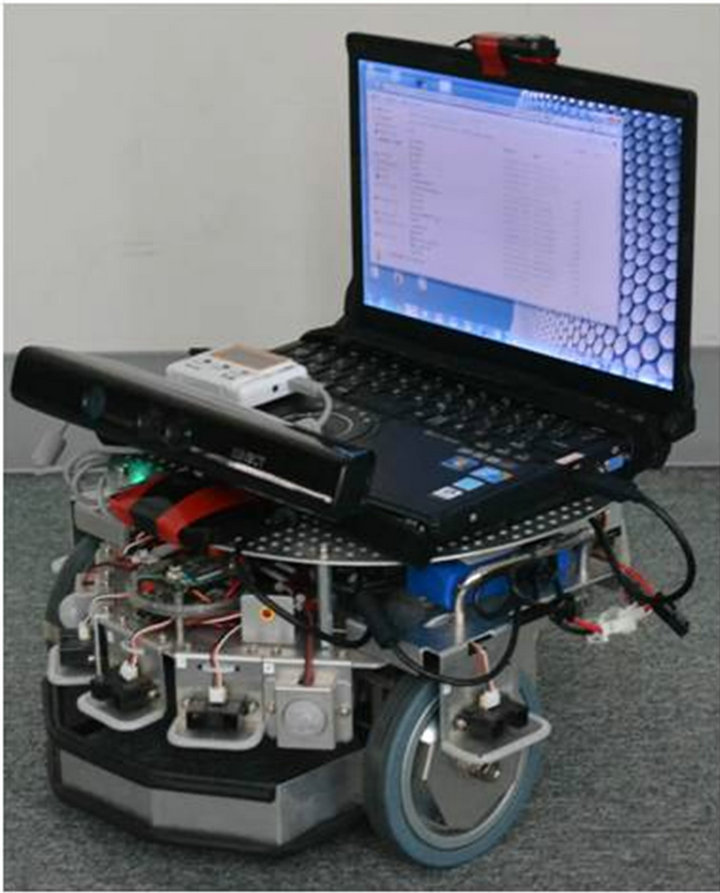
Figure 27. Sensor agent robot.
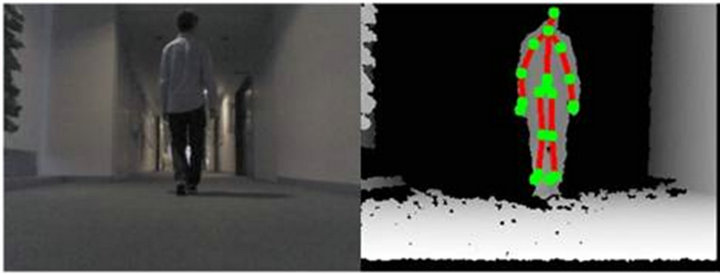
Figure 28. Skeleton recognition.
5.2. Recognition of Human Behaviors
The robot learned to recognize four behavior patterns as it followed a person. These patterns are “locating oneself outside the room”, “locating oneself inside the room”, “seated and moving”, and “seated and not moving”. The person’s position was used to make the judgment of whether the person was inside or outside the room. Taking a seat was recognized by using the person’s height as recorded by the Kinect sensor. The person’s motion was recognized by calculating differences between consecutive camera image frames.
5.3. Lighting Control Using Human Tracking and Recognition of a Person’s Behavior
Figure 29 is an image of the demonstration experiment. First, the ambient lighting devices turned on after the person entered the room, and the task lighting device turned on after the person sat down. Next, the lighting
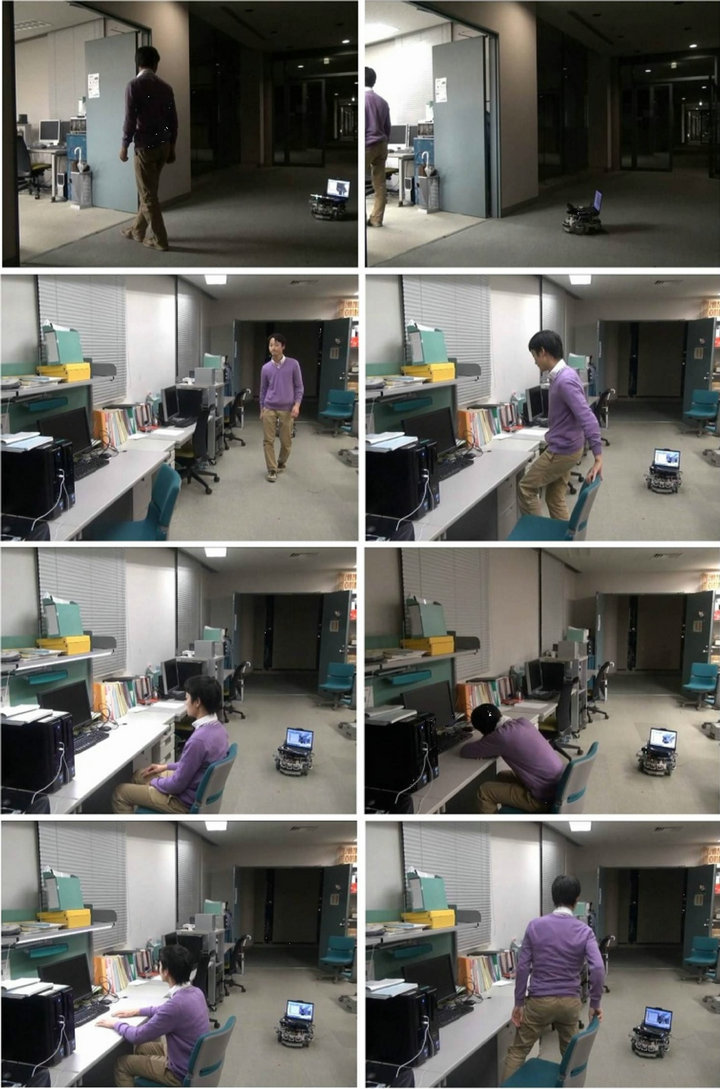
Figure 29. Lighting control demonstration.
devices turned off after the person stopped moving and turned on after the person started moving. Finally after the person left his seat, the task lighting device turned off.
6. Experiment
6.1. Experimental Environment
The lighting control system incorporating the homeostasis algorithm was evaluated in a real experimental space. Before the experiment, the illuminances due to noise (illuminance from other lighting devices) and sunlight at each illuminance measuring cell was measured. In addition, the illuminances were measured by lighting device cells. Each illuminance measuring cell input information about the ambient, task target illuminance, and the existence of noise or broken devices, and the lighting devices were controlled using homeostasis algorithm in real space. In the case with sunlight, the robot predicted illuminance distribution using the mounted illuminometer. By repeating this algorithm 100 times, the predicted illuminance of each cell converged to the target illuminance. The actual illuminance and predicted illuminance were compared by measuring actual illuminance at each point using illuminometer. The task target illuminance was set at 600 (lx), and the ambient target illuminance was set at 400 (lx). The experiments without sunlight were conducted at night so there would be no influence from sunlight.
6.2. Experiment Results
Table 3 lists the results for the case without any conditions (no sunlight, no other lighting devices and no broken devices). Table 4 lists the results of the case with sunlight and without other lighting devices and broken devices. Table 5 lists the results of the case with other lighting devices and without sunlight and broken devices. Table 6 lists the results of the case with the broken device (Ambient D) and without the other lighting devices.
In these experiments, the predicted illuminance converged to the target illuminance. Moreover, every actual illuminance was near the predicted value. The lighting devices listed in Tables 4 and 5 got lower power levels
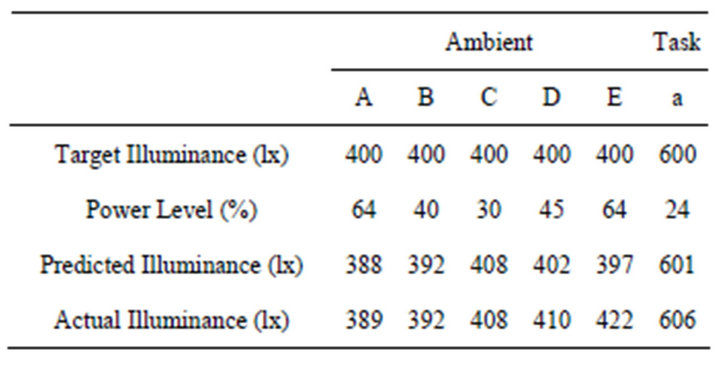
Table 3. Results without any conditions.
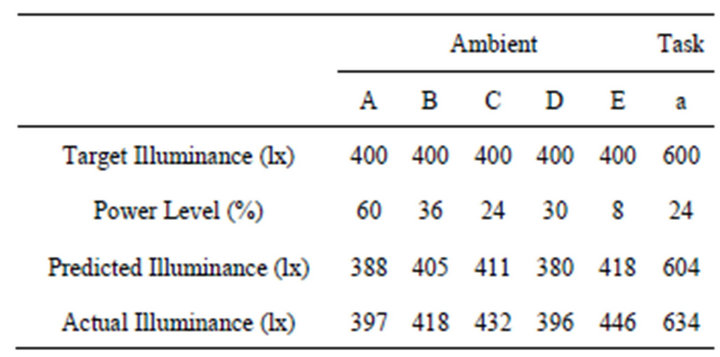
Table 4. Results with sunlight.
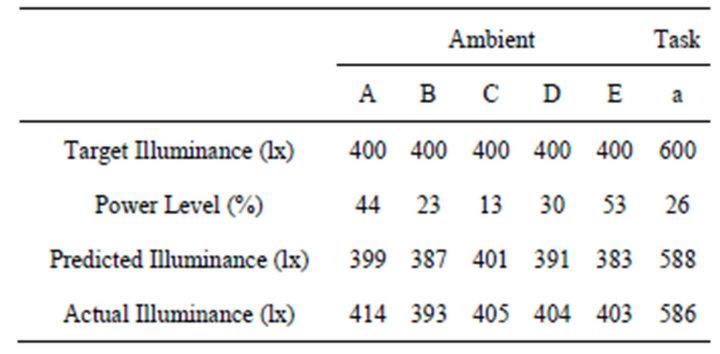
Table 5. Results with noise.
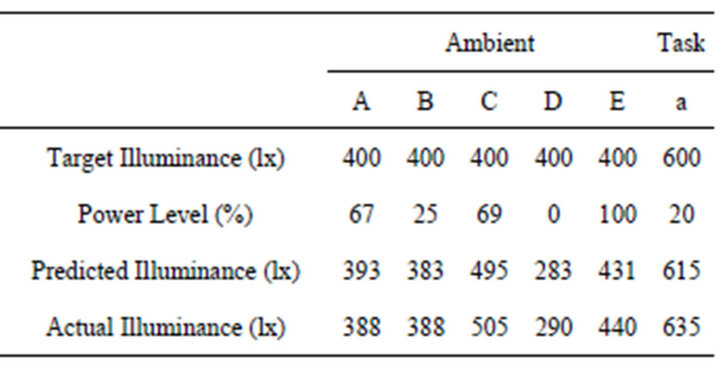
Table 6. Results with a broken device (Ambient D).
than those of Table 3 because of the influence of sunlight or noise, but the predicted illuminance converged to the target illuminance. Regarding the results shown in Table 6, ambient lighting device D was assumed to be broken. The neighboring devices increased their power levels in excess of that of Table 3 and compensated for the broken device. This result shows that the homeostasis algorithm worked properly.
7. Conclusion
We developed a homeostasis algorithm that imitates the function by which living things keep their constancy. We embodied it in a lighting control system and evaluated its operation in a simulation and experiment. The previous intelligent lighting control systems [11] have trouble dealing with unexpected events, for example noise or broken devices. In contrast, we found that our homeostasis algorithm could deal with such unexpected events. In the future, we’d like to make a system that can deal with more than one person and persons with different needs.
8. Acknowledgements
This work was supported in part by a Grant in Aid of the Global Center of Excellence Program for the “Center for Education and Research of Symbiotic, Safe and Secure System Design” from the Ministry of Education, Culture, Sport, and Technology in Japan.
REFERENCES
- J. A. Kientz, et al., “The Georgia Tech Aware Home,” Proceedings of CHI 2008, Florence, 5-10 April 2008, pp. 3675-3680.
- D. H. Stefanov, Z. Bien and W.-C. Bang, “The Smart House for Older Persons and Persons with Physical Disabilities: Structure, Technology Arrangements, and Perspectives,” IEEE Transactions on Neural Systems and Rehabilitation Engineering, Vol. 12, No. 2, 2004, pp. 228-250. doi:10.1109/TNSRE.2004.828423
- H. Sako and H. Takai, “Example of Natural Lighting Control in Office Building,” Journal of the Illuminating Engineering Institute of Japan, Vol. 82, No. 10, 1988, pp. 821-824.
- J. Werner, “System Properties, Feedback Control and Effector Coordination of Human Temperature Regulation,” European Journal of Applied Physiology, Vol. 109, No. 1, 2010, pp. 13-25. doi:10.1007/s00421-009-1216-1
- K. Baba, T. Enohara and K. Nagata, “Solution Applying Recognition Technology for Safe, Secure, and EnergySaving Buildings,” Toshiba Review, Vol. 65, No. 5, 2010, pp. 15-18.
- I.-H. Yang, M.-S. Yeo and K.-W. Kim, “Application of Artificial Neural Network to Predict the Optimal Start Time for Heating System in Building,” Energy Conversion and Management, Vol. 44, No. 17, 2003, pp. 2791- 2809. doi:10.1016/S0196-8904(03)00044-X
- S. W. Wang and X. Q. Jin, “Model-Based Optimal Control of VAV Air-Conditioning System,” Building and Environment, Vol. 35, No. 6, 2000, pp. 471-487. doi:10.1016/S0360-1323(99)00032-3
- Y. Tabuchi, K. Matsushima and H. Nakamura, “Preferred Illuminances on Surrounding Surfaces in Relation to Task Illuminance in Office Room Using Task-Ambient Lighting,” Journal of Light & Visual Environment, Vol. 19, No. 1, 1995, pp. 28-39. doi:10.2150/jlve.19.1_28
- N. Bellotto and H. S. Hu, “Multisensor-Based Human Detection and Tracking for Mobile Service Robots,” IEEE Transactions on Systems, Man, and Cybernetics, Part B: Cybernetics, Vol. 39, No. 1, 2009, pp. 167-181. doi:10.1109/TSMCB.2008.2004050
- T. Akiba and A. Mita, “Human Tracking Using Sensor Agent Robot for Biofied Building,” AIJ Journal of Technology and Design, Vol. 18, No. 39, 2012, pp. 775-778. doi:10.3130/aijt.18.775
- Y.-W. Bai and Y.-T. Ku, “Automatic Room Light Intensity Detection and Control Using a Microprocessor and Light Sensors,” IEEE Transactions on Consumer Electronics, Vol. 54, No. 3, 2008, pp. 1173-1176. doi:10.1109/TCE.2008.4637603

