Intelligent Control and Automation
Vol.4 No.1(2013), Article ID:27702,6 pages DOI:10.4236/ica.2013.41004
Discriminant Analysis for Human Arm Motion Prediction and Classifying
Department of Computer Engineering, Al-Nahrain University, Baghdad, Iraq
Email: mzalfaiz@ieee.org, sarmad7906@yahoo.com
Received September 22, 2012; revised October 22, 2012; accepted October 30, 2012
Keywords: Linear Discriminant Analysis (LDA); k-Nearest Neighbor (k-NN)
ABSTRACT
The EMG signal which is generated by the muscles activity diffuses to the skin surface of human body. This paper presents a pattern recognition system based on Linear Discriminant Analysis (LDA) algorithm for the classification of upper arm motions; where this algorithm was mainly used in face recognition and voice recognition. Also a comparison between the Linear Discriminant Analysis (LDA) and k-Nearest Neighbor (k-NN) algorithm is made for the classification of upper arm motions. The obtained results demonstrate superior performance of LDA to k-NN. The classification results give very accurate classification with very small classification errors. This paper is organized as follows: Muscle Anatomy, Data Classification Methods, Theory of Linear Discriminant Analysis, k-Nearest Neighbor (kNN) Algorithm, Modeling of EMG Pattern Recognition, EMG Data Generator, Electromyography Feature Extraction, Implemented System Results and Discussions, and finally, Conclusions. The proposed structure is simulated using MATLAB.
1. Introduction
EMG signals, which are measured at the skin surface, are the electrical manifestations of the activity of muscles. It provides an important access to the human neuromuscular system. EMG has been well recognized as an effective tool to generate control commands for prosthetic devices and human-assisting manipulators. Information extracted from EMG signals, represented in a feature vector, is chosen to minimize the control error. In order to achieve this, a feature set must be chosen which maximally separates the desired output classes. The extraction of accurate features from the EMG signals is the main kernel of classification systems and is essential to the motion command identification [1].
Early attempts using pattern matching algorithms for prosthesis control have been proposed by Finely [2].
In today’s literature on EMG classification the signal processing chain is often broken down to three algorithmic components: the feature extraction, the dimensionality reduction and the pattern classification. In the feature extraction step attributes are extracted omitting redundancy. In the second step the amount of data is further reduced by selecting or projecting features for more robust and accurate classification. In the last step pattern matching algorithms are applied to detect the category of the input data. The complete processing queue has to be carefully balanced-especially the combination of the pattern matching algorithm and the selected feature contributes significantly to the classification accuracy.
EMG classification is one of the most difficult pattern recognition problems because there are large variations in EMG features. Especially, it is difficult to extract useful features from the residual muscle of an amputee. So far, many researches proposed many kinds of EMG feature to classify posture and they showed good performance. However, how to select a feature subset with the best discrimination ability from those features is still an issue for classifying EMG signals [3].
2. Muscle Anatomy
The muscles that are responsible for the movement of the arm, wrist, and hand abduction are performed by the deltoid. Human elbow is mainly actuated by two antagonist muscles: biceps and triceps, although it consists of more muscles. Consequently, biceps and a part triceps are biarticular muscles. Many studies have been performed to investigate the effects of biarticular muscles. By adjusting the amount of force generated by these muscles, the elbow angle and impedance can be arbitrary controlled [4]. The biceps brachii and triceps brachii however, which insert from the arm contraction of the biceps brachii flexes the elbow and supinated the forearm. Contraction of triceps brachii extends the elbow. Most of the muscles that move the forearm and hand originate within the forearm. The flexor carpi radialis flexes and abducts the wrist, while the flexor carpi ulnaris flexes and adducts. The extensor carpi radialis produces extension and abduction of the wrist, while the extensor carpi ulnaris produces extension and abduction [5].
3. Data Classification Methods
The most commonly used techniques for data classification is the Linear Discriminant Analysis. This method maximizes the ratio of between-class variance to the within-class variance in any particular data set thereby guaranteeing maximal separability. The use of Linear Discriminant Analysis for data classification is applied to classification problems and recognition. This method also helps to better understand the distribution of the feature data [6].
The Linear discriminant analysis (LDA) is a classical statistical approach for supervised classification. LDA computes an optimal transformation (projection) by minimizing the within-class distance and maximizing the between-class distance simultaneously, thus achieving maximum class discrimination. Hence LDA will be used in this paper as the classification method due its ability in class discrimination. In the case of the classification of the upper arm motion; these motions are similar to each other in signal shape. Therefore, the obtained results in this paper demonstrated that this method of classification can provide accurate classification result with minimum classification error in the classification of the upper arm motions.
4. Theory of Linear Discriminant Analysis [6]
Consider a data set that consists of n samples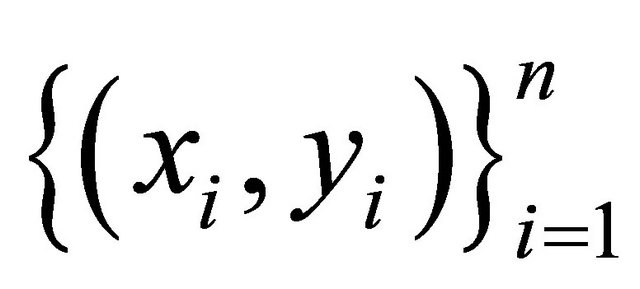 , where
  denotes the d-dimensional input,
  the corresponding class label, n is the sample size, and k is the number of classes. Let
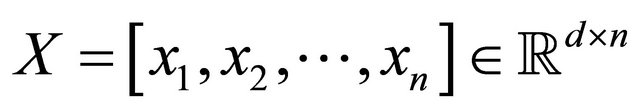 (1)
(1)
be the data matrix and  be the data matrix of the j-th class, where nj is the sample size of the j-th class, and
  that maps xi in the d-dimensional space to a vector
  in the
  -dimentional space as follows:
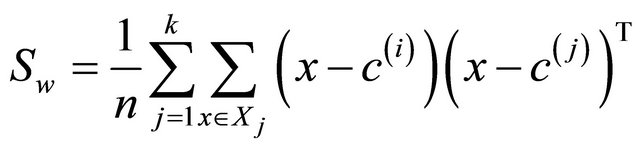
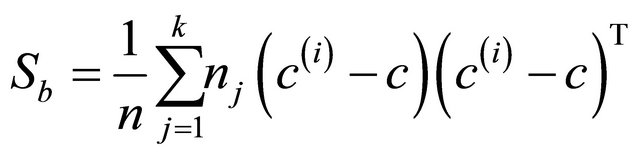
In LDA, three scatter matrices, called the within-class, between-class and total scatter matrices are defined as follows:
 (2)
(2)
 (3)
(3)
 (4)
(4)
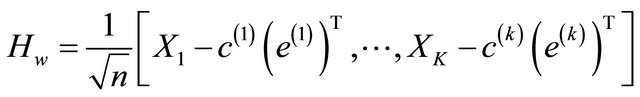
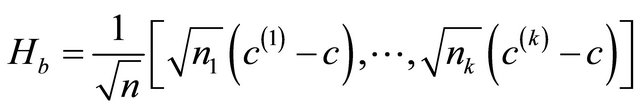
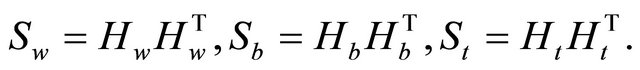
where  is the centroid of the j-th class, and c is the global centroid. It can be verified from the definitions that St= Sb + Sw. Define three matrices Hw, Hb, and Ht as follows:
 (5)
(5)
 (6)
(6)
 (7)
(7)
where  and e are vectors of all ones of length nj and n, respectively. Then the above three scatter matrices can be expressed as
It follows from the properties of the matrix trace that
 (8)
(8)
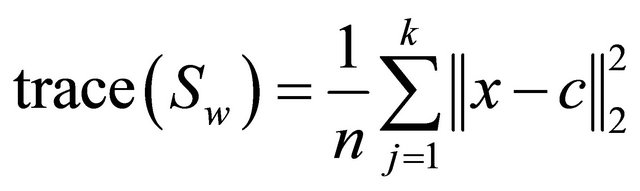 (9)
(9)
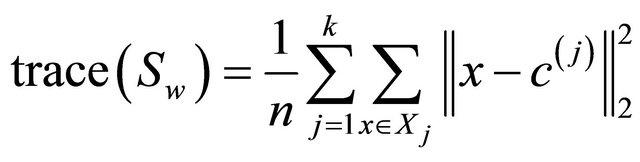
Thus trace (Sw) measures the distance between the data points and their corresponding class centroid, and trace (Sb) captures the distance between the class centroids and the global centroid.
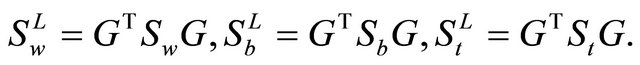
In the lower-dimensional space resulting from the linear transformation G, the scatter matrices become
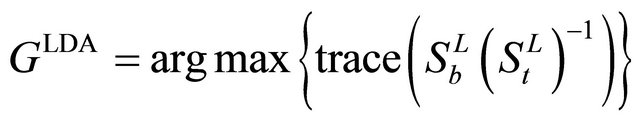
An optimal transformation G would maximize trace  and minimize trace
  simultaneously, which is equivalent to maximizing trace
  and minimizing trace
  simultaneously, since
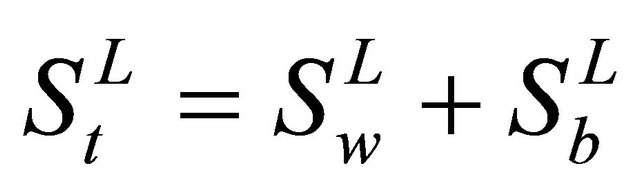 . The optimal transformation,
  , of LDA is computed by solving the following optimization
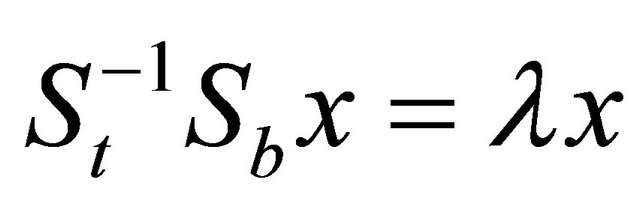
It is known that the optimal solution to the optimization problem in above equation can be obtained by solving the following generalized eigenvalue problem:
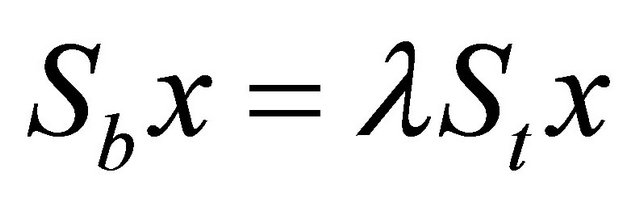
More specifically, the eigenvectors corresponding to the k − 1 largest eigenvalues form columns of GLDA. When St is nonsingular, it reduces to the following regular eigenvalue problem:
When St is singular, this is known as the singularity or undersampled problem in LDA. When St is singular, the classical LDA formulation discussed above cannot be applied directly.
The unified framework consists of four steps described below:
1) Compute the eigenvalues,  of St and the corresponding eigenvectors
 , with
 . Then
 .
.
2) Given a transfer function , let
, let
 for all i. Construct
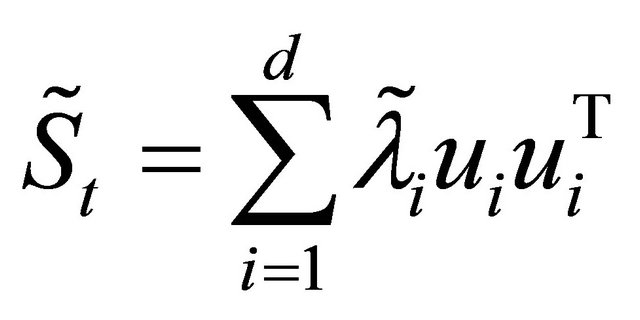 .
.
3) Compute the eigenvectors,  of
of 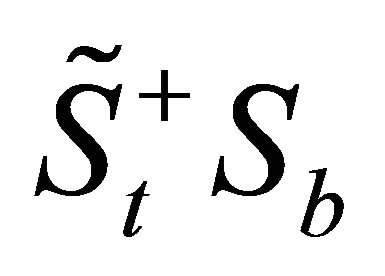 corresponding to the nonzero eigenvalues, where q = rank (Sb),
  denotes the pseudo-inverse of
 . Construct the matrix G as
 .
.
5. k-Nearest Neighbor (kNN) Algorithm
The k-nearest neighbor (kNN) classification rule is wellknown and widely used nonparametric pattern classification method. It was originally suggested by Cover and Hart [7]. Its simplicity and effectiveness have led it to be widely used in a large number of classification problems. When there is little or no prior knowledge about the distribution of the data, the kNN method should be one of the first choices for classification. It is a powerful nonparametric classification system which bypasses the problem of probability densities completely. The class assigned to a pattern is the class of the nearest pattern known to the system, measured in terms of a distance defined on the feature (attribute) space. On this space, each pattern defines a region (called its Voronoi region). When distance is the classical Euclidean distance, Voronoi regions are delimited by linear borders. To improve the classification, more than one neighbor may be used to determine the class of a pattern or distances other than the Euclidean distances that may be used [8]. The kNN rule classifies assigning it the label most frequently represented among the k nearest samples; this means that, a decision is made by examining the labels on the k-nearest neighbors and taking a vote. kNN classification was developed from the need to perform discriminant analysis when reliable parametric estimates of probability densities are unknown or difficult to determine [8].
6. Modeling of EMG Pattern Recognition
The structure of the implemented system is shown in Figure 1, which will form a common baseline measurement against other algorithms for comparison.
The process of pattern recognition can be broken down into two main phases: feature extraction and classification.
Feature extraction refers to the transformation of the input signal into a set of representative signal features. Number of features that are now commonly used for EMG classification; in this paper features that are used are the root mean square and autoregressive coefficients.
Classification maps feature vectors into specific classes, with the mapping function determined using training data. This classification procedure is implemented using LDA classifier, and kNN classifier.
7. EMG Data Generator
The data used in this paper are generated using EMG Simulator [9]. These data were simulated from simulation of seven sites on the forearm and one site on the bicep.
Signals are generated using a model constructed to closely resemble the physiology and morphology of skeletal muscle, combined with line source models of commonly used needle electrodes positioned in a way consistent with clinical studies. The validity of the simulation routines is demonstrated by comparing values of statistics calculated from simulated signals with those from clinical EMG studies of normal subjects. The simulated EMG signals are used to explore the relationships between muscle structure and activation and clinically acquired EMG signals.
EMG data were simulated as the subject underwent seven distinct limb motions: hand open, hand close, supination, pronation, wrist flexion, wrist extension, and rest, as shown in Figure 2. These data are used to create test-

Figure 1. System Model.
ing set and training set.
8. Electromyography Feature Extraction
The first four autoregressive coefficients and the root mean square value were used as the feature vector. The analysis window size was 256 ms, which were spaced 128 ms apart for training data and 32 ms apart for testing data. Data that were 256 ms before or after a change in limb motion were removed from the training set to avoid transitional data.
Features are computed from the EMG signals using a sliding analysis window. In this paper the sliding window is depicted in Figure 3, with analysis windows of 256 ms in length, spaced 32 ms apart. A single feature vector is produced from each analysis window.
9. Implemented System Results and Discussions
The classification error from the testing data was 2.9329% (with no feature reduction). To improve classification accuracy, majority vote post-processing can be employed. The majority vote uses the current classification result, along with the previous classification results (with an analysis window spacing of 32 ms, this corresponds to the classification results within the last 256 ms) and makes a classification decision based on the class that appears most often (Figure 4).
The resulting effect is a smooth operation that removes spurious misclassification. The classification error reduces to 2.3316% after majority vote post processing.
The errors that are present occur during transitional periods, which are expected as the system is in an undetermined state between contractions.
If we removed the analysis windows that are 256 ms before and after the transition, the classification error is 0.85402% (i.e. no transitions).
If we combine majority vote post processing with no transition error; the classification error will be 0.84067%. The classification errors from the testing data (with Linear Discriminant Classifier and ULDA Feature Reduction) are shown in Figure 5.
Also the classification errors from the testing data (with Linear Discriminant Classifier and PCA Feature Reduction) are shown in Figure 6.
While the classification errors from the testing data (with k-Nearest Neighbor Classifier and PCA Feature Reduction) are shown in Figure 7.
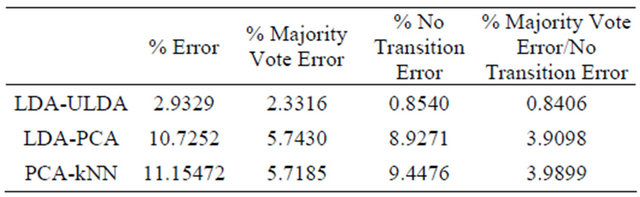
The classification errors from the testing data are summarized in Table 1.
10. Conclusions
Results in this paper demonstrate that a relatively simple pattern classification system can achieve high classifica-
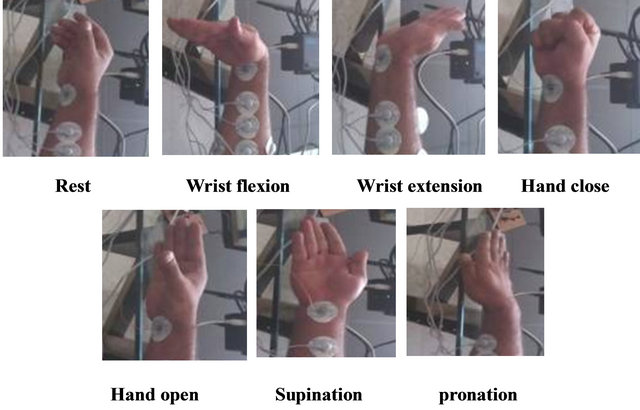
Figure 2. Motion classes.
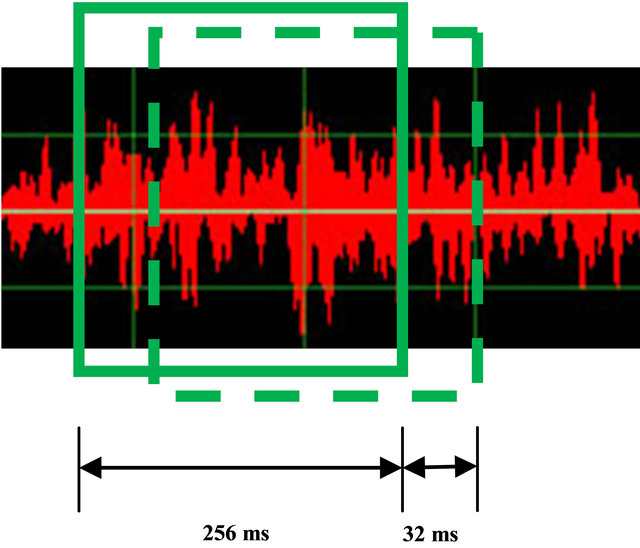
Figure 3. Sliding analysis window.
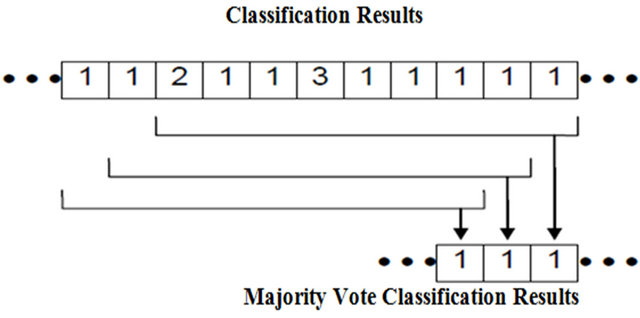
Figure 4. Majority vote post-processing.
tion accuracy. One can improve classification accuracy by changing the pattern recognition components in the system. For example, different features and classifiers may yield an improved system. The system presented in this paper establishes a good baseline to which other systems can be compared. This includes comparisons in system complexity. This is of particular importance for EMG control systems, where the computational requirements are important in an embedded system implementa-
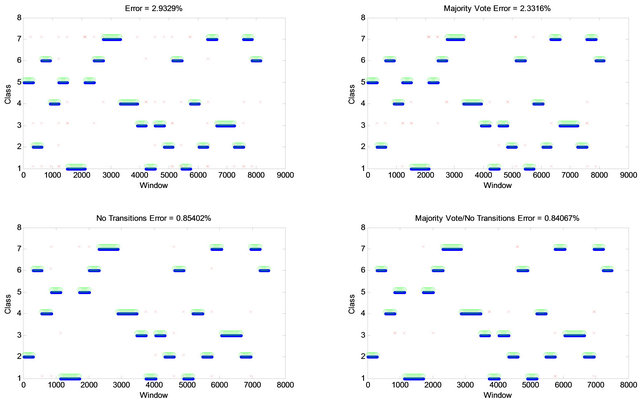
Figure 5. Classification errors from the testing data (with Linear Discriminant Classifier and ULDA Feature Reduction).
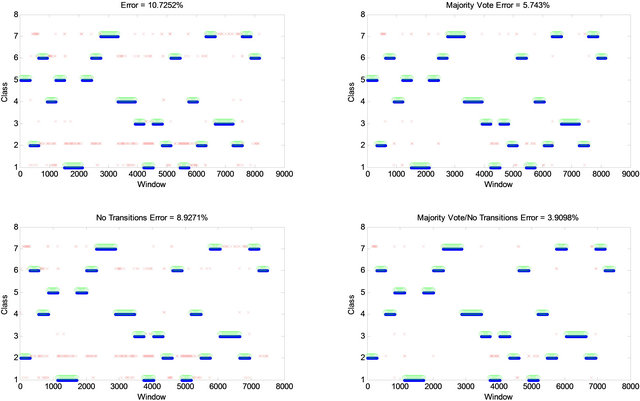
Figure 6. Classification errors from the testing data (with Linear Discriminant Classifier and PCA Feature Reduction).
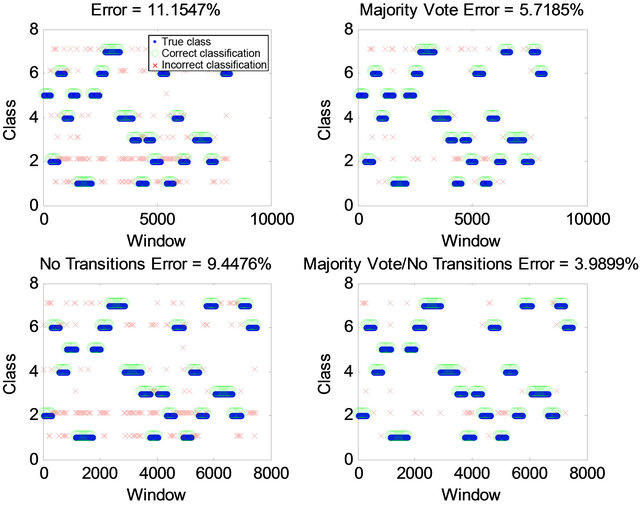
Figure 7. Classification errors from the testing data (with kNN Classifier and PCA Feature Reduction).
Table 1. The classification errors.
tion (e.g. computation load, power requirements, system robustness).
REFERENCES
- M. Z. Al-Faiz, A. A. Miry and A. H. Ali, “A k-Nearest Neighbor Based Algorithm for Human Arm Movements Recognition Using EMG Signals,” IEEE Proceedings of the 1st International Conference on Energy, Power and Control (EPC-IQ), Basrah, 30 November-2 December 2010, pp. 159-167.
- R. R. Finley and R. W. Wirta, “Myocoder Studies of Multiple Myocoder Response,” Archives of Physical Medicine and Rehabilitation, Vol. 48, 1967, pp. 599-601.
- O. Fukuda, T. Tsuji, M. Kaneko and A. Otsuka, “A Human-Assisting Manipulator Teleoperated by EMG Signals and Arm Motions,” IEEE Transactions on Robotics and Automation, Vol. 19, No. 2, 2000, pp. 210-222. doi:10.1109/TRA.2003.808873
- N. Bu, M. Okamoto and T, Tsuji, “A Hybrid Motion Classification Approach for EMG-Based Human-Robot Interfaces Using Bayesian and Neural Networks,” IEEE Transactions on Robot, Vol. 23, No. 3, 2009, pp. 502- 511.
- S. Park and S. Lee, “EMG Pattern Recognition Based on Artificial Intelligence Techniques,” IEEE Transactions on Rehabilitation Engineering, Vol. 6, No. 4, 1998, pp. 400- 405. doi:10.1109/86.736154
- K. Fukunaga, “Introduction to Statistical Pattern Recognition,” 2nd Edition, Academic Press Professional, Inc., San Diego, 1990.
- T. M. Cover and P. E. Hart, “Nearest Neighbor Pattern Classification,” IEEE Transactions on Information Theory, Vol. IT-13, No. 1, 1967, pp. 21-26. doi:10.1109/TIT.1967.1053964
- A. Cervantes, I. Galvan and P. Isasi, “AMPSO: A New Particle Swarm Method for Nearest Neighborhood Classification,” IEEE Transactions on System, Man and Cybernetics, Vol. 39, No. 5, 2009, pp. 1082-1091. doi:10.1109/TSMCB.2008.2011816
- A. Hamilton-Wright and D. W. Stashuk, “Physiologically Based Simulation of Clinical EMG Signals,” IEEE Transactions on Biomedical Engineering, Vol. 52, No. 2, 2005, pp. 171-183. doi:10.1109/TBME.2004.840501