Materials Sciences and Applications
Vol.3 No.12(2012), Article ID:25406,8 pages DOI:10.4236/msa.2012.312123
A Simple Two-Phase System Involving the Commercial Organophosphorous Extractant Cyanex® 471x for the Preparation of Silver Sulphide Nanoparticles
![]()
1Instituto de Metalurgia, San Luis Potosí, México; 2Facultad de Ciencias, San Luis Potosí, México; 3Facultad de Ingeniería, Universidad Autónoma de San Luis Potosí, San Luis Potosí, México.
Email: msanchez@uaslp.mx
Received October 17th, 2012; revised November 13th, 2012; accepted December 11th, 2012
Keywords: Silver Sulphide; Solvent Extraction; Precipitation Stripping; Cyanex® 471x; Tri-Isobutylphosphine Sulphide
ABSTRACT
The facile chemical synthesis of silver sulphide nanocrystals from metal-loaded organic media, containing a silver-selective organophosphorous ligand as extractant, is reported. The method involves the phase-transfer of silver species from aqueous nitrate media to organic solution using the commercial extractant Cyanex® 471x (tri-isobutylphosphine sulphide, Cytec Co.) as extractant, followed by precipitation stripping using ammonium sulphide as strip reagent. The nanoparticles were structurally characterized, and some aspects of the synthetical process, are briefly discussed. Under the conditions studied, the extractant Cyanex® 471x was able to act as stabilizer adsorbing on the particles surface, maintaining the size of the particles nanometrical.
1. Introduction
Several approaches are utilised for the colloidochemical preparation of nanoparticles, but, in all cases, the metal precursors need to be highly pure in order to obtain high quality materials. High purity metal-containing solutions can be obtained using separation techniques such as the two-phase system applied in hydrometallurgy, also known as the solvent extraction process. An interesting modification of the conventional extraction is the addition of a crystallization operation (crystallization or precipitation stripping), where low-solubility salts are formed. Yttrium oxalate powders from metal-loaded D2EHPA (di-2-ethylhexylphosphoric acid) were synthesised by Combes et al. [1]. By heat-treatment in air the oxalates become the corresponding oxides [2]. Preparation of cobalt ferrite from Versatic Acid solutions was reported [3]. Fu et al. reported the preparation of organic fluids containing Ag, Ag2S, Bi2S3, CdS and ZrO2 from organophosphorous extractants solutions [4-6].
The first report of thiol-stabilized gold nanoparticles prepared by metal extraction, the two-phase approach, appeared in 1993, and a year later a simple but very successful method for preparing larger amounts of nanocrystals appeared, involving the phase transfer of an anionic Au3+ complex from aqueous to organic solution using a reagent-grade anion exchanger, followed by reduction with sodium borohydride using a long chain thiol as stabilizer [7]. Similar preparation of silver was also reported [8]. Well-known solvating organophosphorous extractants, such as trioctyl phosphine and trioctyl phosphine oxide, were used for preventing particle growth and aggregation in the one-pot chemical synthesis of quantum dots [9]. CdS nanowires and Bi2S3 nanorods were prepared by extraction of Cd2+ or Bi3+ ions using Cyanex® 301, followed by solvothermal treatment [10]. Therefore we hoped other extractants from the Cyanex® family (Cytec Co.), and particularly Cyanex® 471x (tri-isobutylphosphine sulphide, TIBPS), could behave as phase transfer reagents, and as effective capping ligands during the synthesis of semiconductor nanoparticles by the facile two-phase approach. The effectiveness of different ligands in nanoparticles stabilisation is influenced by the difference in Lewis base character, where a firmly bound moiety stabilises growth. As Ag+ is a soft acid, the stability of the moiety would increase with increasing ligand softness, and so was expected that the sulphur containing TIBPS could act as good capping agent during the synthesis of Ag2S nanocrystals. Silver sulphide, an intrinsic n-type semiconductor with a band gap of 1.03 eV and relatively high absorption coefficient, 104 M–1·cm–1 [15- 17], has attracted attention owing to its potential as optoelectronic and thermoelectric material, for uses in devices such as photovoltaic cells, photoconductors, IR detectors, superionic conductors and photosensitizer for photographic purposes [11-14]. Radiation of wavelengths under 1210 nm (e.g. ambient light) may induce photoconductivity in Ag2S, accelerating the rate of electron transfer process. Ag2S nanocrystals were synthesized by thermal decomposition, reverse micelles, precipitation from thiolate glutathione, and L-Cysteine complexes, or using the already mentioned two-phase system [5,14,18-21].
Depending on the leaching media, different reagents are suitable for separating silver ions from aqueous solutions. Paiva et al. revised examples of application of trialkyl-, triarylthiophosphates and triphenylphosphine to silver extraction [22-24]. TIBPS is a well-known extractant for silver and Pd/Pt separation, extracting Ag+ from nitrate solutions via a “solvating” mechanism by coordination through a sulphur atom, with simultaneous transfer of a nitrate to form an ion-pair [22-28]:
 (1)
(1)
 (2)
(2)
where (org) represents the organic phase.
We expected the reactions involved during precipitation stripping could involve the reversal of (1) or (2) promoted by the formation of silver ammonium complexes (3), which are not well extracted by TIBPS [25]:
![]() (3)
(3)
Finally, the low solubility product appears:
 (4)
(4)
In this work, the chemical synthesis and the characterisation of the Ag2S nanocrystals obtained from organic phases containing Cyanex® 471x and silver ions using a very simple method involving solvent extraction and precipitation stripping, are reported.
2. Procedures
The extractant Cyanex® 471x was kindly donated by Cytec Co. and used as received. The silver nitrate solutions used were: 0.005 and 0.01 M Ag+ in 0.1 M HNO3. The silver phase-transfer was carried out at room temperature (about 20˚C) in separatory funnels shaken mechanically at a fixed frequency of 90 min–1. Unless otherwise stated, the metal loading was performed by shaking 0.01 L of Ag+ aqueous solution with 0.01 L of the organic phase (0.005, 0.01 and 0.05 mol/L of Cyanex® 471x in p-xylene). In order to obtain enough material for XRD (powder X-ray diffraction) characterisation, some experiments were performed by mixing 0.5 L of silver aqueous solution with 0.5 L of the selected organic phase. After 30 minutes shaking, the two phases were allowed to separate. The metal concentration of the aqueous phase before and after extraction was determined using an Atomic Absorption Spectrometer Varian model Spectra AA 220 (AAS) with graphite furnace GTA-110 and the organic phase metal content was calculated by mass balance.
At the beginning of this work, the silver-loaded organic phases were transferred into separatory funnels, and the precipitates were obtained by adding a 0.01 L (or 0.5 L in case of materials prepared in order to perform the XDR characterisation) of a freshly prepared stripping solution (0.005, 0.01, 0.05, 0.1 mol/L ammonium sulphide). After 30 minutes shaking, both phases were allowed to separate and filtered. The obtained powders were washed with methanol and acetone and dried. Depending on the experimental conditions, some of the particles prepared do not precipitated and remained dispersed, in the organic or aqueous solutions. They were separated by centrifugation, washed and dried. Residual metal concentration in the organic phases was determined after digestion using AAS. After improving of the preparation method, the precipitation stripping was carried out in a stirred reaction vessel, both phases were stirred for 30 minutes, and after that the two phases were transferred to a separatory funnel for phase separation and particles recovery.
The X-ray diffraction pattern was obtained in a Rigaku 2200 diffractometer equipped with a nickel monochromator using Cu Kα (λ = 1.54 Å) radiation. The Rietveld analysis was performed using the program MAUD (Materials Analysis Using Diffraction), software developed to analyze diffraction spectra and obtain crystal structures, quantity and microstructure of phases along with the texture and residual stresses. It applies the RITA/ RISTA method as developed by Wenk et al. and Ferrari and Lutterotti [29,30]. As initial model for the refinement, the structure of silver sulfide (monoclinic, space group: P21/n) was used [31]. The SEM images were obtained using a XL-30 scanning electron microscope (Philips, Netherlands). The size and morphology of selected nanocrystals were examined using a JEOL JEM 2000 FXII operating at 100 kV, and a high resolution transmission electron microscopy (HRTEM Tecnai, 300 kV), the crystallinity was confirmed by FFT simulation. The samples were prepared by dispersing of the powders in acetone using an ultrasound bath, and putting a drop of the dispersion over the carbon-supported copper grid and letting it dry at room temperature. Dynamic Light Scattering analysis (DLS) was performed in a Malvern Zetasizer Nano S. Organic adsorption on the precipitates was checked by thermal analysis (Perkin Elmer TGA), using nitrogen or argon as a purging gas, at a scanning rate of 10˚C/min. FTIR measurements were carried out using a Perkin-Elmer FT-IR coupled to a diffuse reflectance device. Since the sample was diluted, to minimize interfereences from impurities in the KBr matrix, the spectra were rationed to the background spectrum taken for a blank KBr pellet. In order to find out if the extractant was adsorbed on the surface of the materials prepared, the spectrum of one of the samples was obtained using pure Ag2S synthesized with this purpose.
3. Results
During the experiments the extraction conditions were chosen such as they ensure the extent of silver extraction by the commercial organophosphorus reagent was in all cases quantitative. Under the stripping conditions chosen, the quantitative and efficient precipitation of Ag2S from organic solutions could be observed. MEB images (not shown) showed the products to be nanometrical in size, but the agglomeration degree was in general high, as confirmed in experiments varying the sulphide concentration (0.1, 0.05, 0.01 to 0.005 M [ ], metal and extractant concentrations were kept constant at 0.005 mol/ L), where the particles average size obtained from dynamic light scattering measurements varied from 160 nm to 301 nm (Figure 1).
In order to obtain information about the crystal structure of the powders, for the following experiment the extraction conditions were 0.5 L aqueous phase (0.01 M Ag+ in HNO3 0.1 mol/L), and 0.5 L organic phase (0.05 mol/L of Cyanex® 471x). Ammonium sulphide concentration during stripping was 0.1 mol/L and the volume
Figure 1. Average size of the Ag2S powders as a function of sulphide ions concentration obtained from dynamic light scattering measurements.
was also 0.5 L. The reflections on the XRD patterns of the product could be indexed to the monoclinic acanthite (a-Ag2S) crystal structure (Figure 2, JCPDS Card File 14-0072), which is the stable form of silver sulphide at room temperature in the bulk phase, also called the bAg2S phase [14].
Figure 2(a) represents the experimental (original data) and calculated diffractograms (computed data from Rietveld analysis), with good agreement between them indicating that the used initial structural model was correct. Figures 2(b) and (c) show that the materials are ellipsoidal in shape with some other irregular particles. The FFT simulated pattern (Figure 2(c)) contains spots, confirming the high crystalline quality. Table 1 shows the refined atomic positions from the computed data and Table 2 the unit cell parameters along with the X-ray
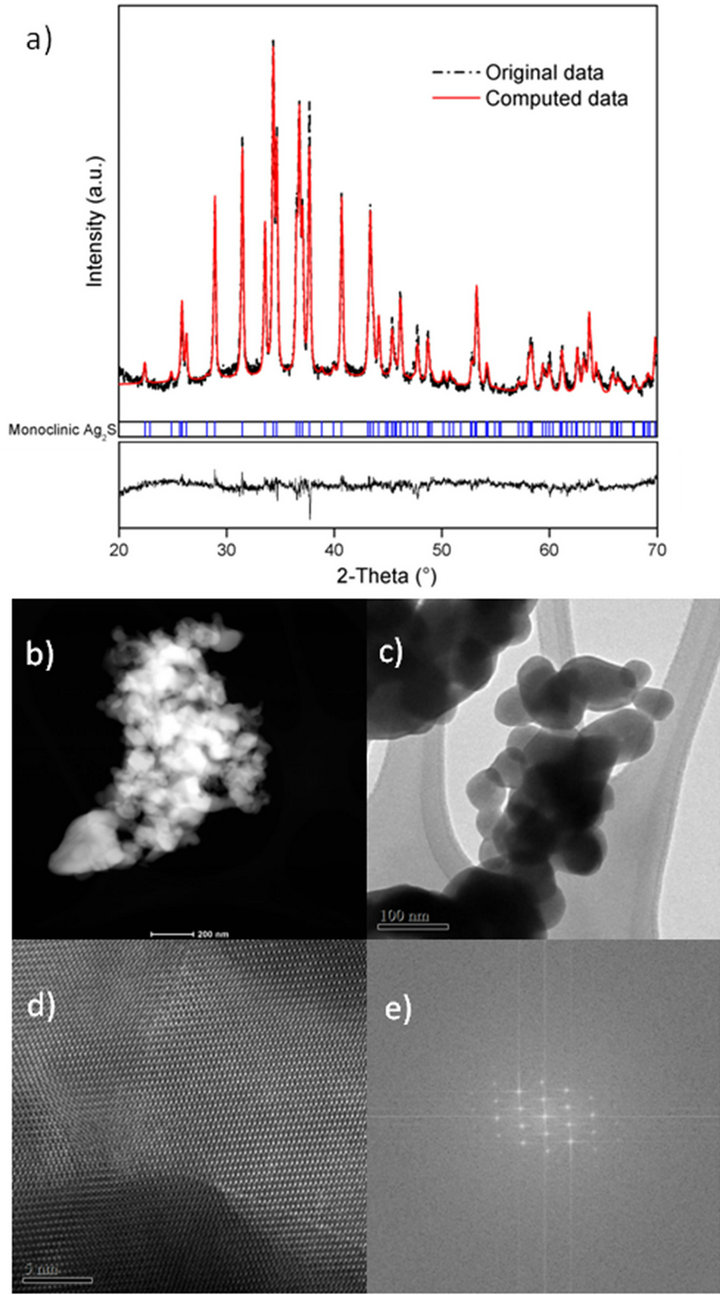
Figure 2. (a) Plot of the measured and calculated diffractogram along with the Bragg positions of silver sulphide; (b) S (c) and (d) TEM images and (e) FFT pattern of Ag2S from Cyanex® 471x solution.
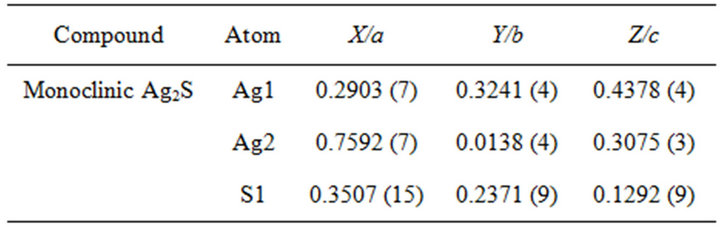
Table 1. Atomic positions in the unit cell of Ag2S.
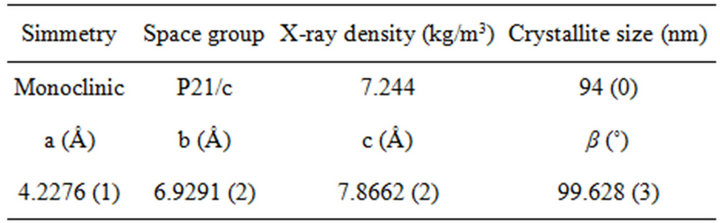
Table 2. Unit cell parameters, X-ray density and crystallite size of Ag2S obtained from the refinement of the structure.
density and crystallite size. According to the Rietveld analysis, the extractant was able to maintain the size of the particles nanometrical, but was less capable to prevent some agglomeration degree. The size of particles measured by DLS is much larger than that from XRD; because DLS measures aggregates size, where Rietveld analysis gives the crystallite size.
The following precipitation experiments were carried out in a reaction vessel by varying the extractant concentrations (0.01 and 0.05 mol/L, Figure 3) and using a metal concentration of 0.005 mol/L. The particle size remains at the first sight almost constant. The size distributions of both products were also studied using TEM images and image analysis. The sample prepared from Cyanex® 471x 0.05 mol/L solution has an average size of 85.7 nm2 (area), with a standard deviation of 47.7 nm2 (Figure 4). The value is large due to the presence of clusters of about 223 nm2. The sample prepared from Cyanex® 471x 0.01 mol/L solution has an average size of 83.8 nm2, with a standard deviation of ~59.5 nm2. This value is so large due to the presence of clusters of about 293 nm2.
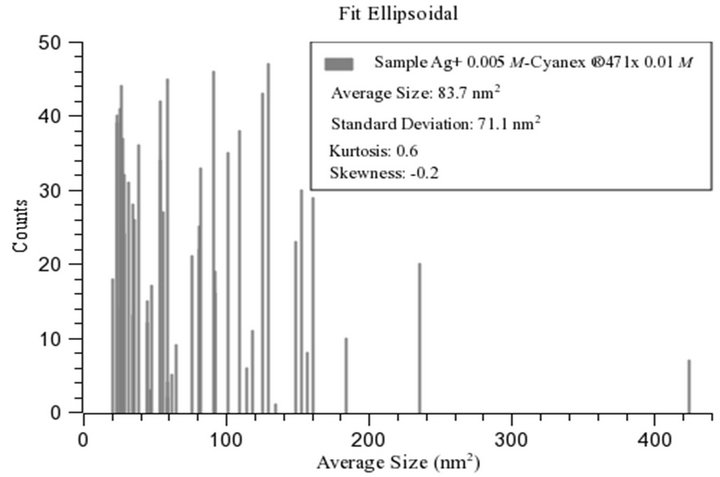
For the same percentage of particles, an adjustment to an elliptical shape of the area was made. The image processing and analysis with ImageJ for the sample Ag+ 0.005 mol/L-Cyanex® 471x 0.01 mol/L yielded a value of 83.7 nm2 for the average size (area) with a standard deviation equal to 71.1 nm2, and –0.2 and 0.6 for the skewness and kurtosis, respectively (Figure 5). The average circularity of particles was equal to 0.2 with a standard deviation of 0.1 nm2. The distribution in the shape of the particles is better suited to an ellipsoidal shape for the sample. In both samples dominate particles having ellipsoidal shape, being the particles prepared at higher ligand concentration slightly larger and more spherical, as shown in Table 3. Although it was hoped that the particle size could be controlled by tuning the reaction parameters, particularly the extractant concentration, the results show that under the experimental conditions used the size and size distribution of the as-obtained Ag2S QDs did not change distinctly with the concentration, taking into account the fact that a commercial reagent was used
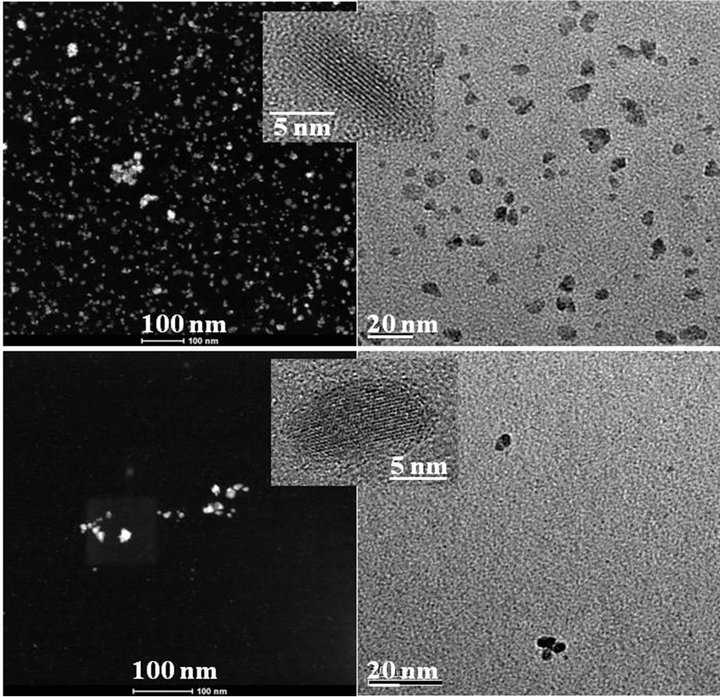
Figure 3. SEM, HRTEM and TEM images of Ag2S nanoparticles prepared from Ag(I)-Cyanex® 471 solutions at two different ligand concentrations (Ag+ 0.005 mol/L, upper figure: Cyanex® 471x 0.01 mol/L, down: Cyanex® 471x 0.05 mol/L).
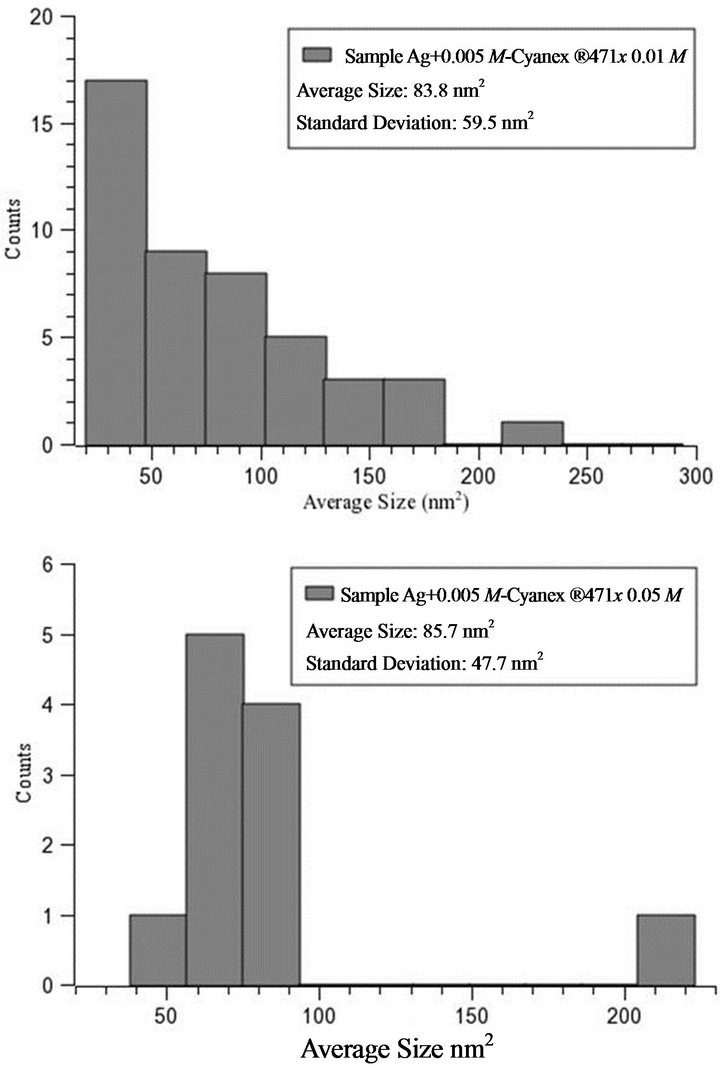
Figure 4. Histograms of the particle size distribution as determined from TEM images for the two Ag2S nanocrystals samples. A1: Ag+ 0.005 mol/L-Cyanex® 471x 0.01 mol/L, A2: Ag+ 0.005 mol/L-Cyanex® 471x 0.05 mol/L.
 (a)
(a)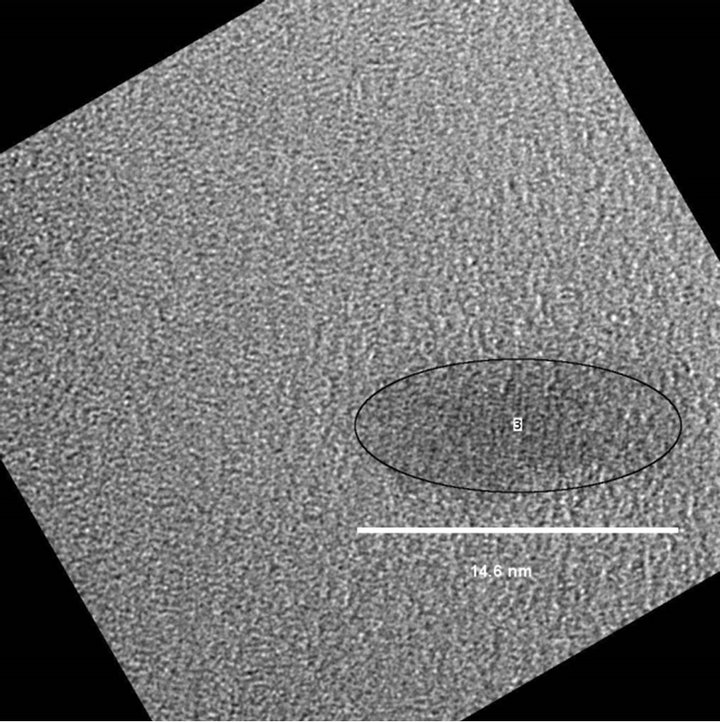 (b)
(b)
Figure 5. (a) Adjustment to an elliptical shape of the area, and (b) TEM image of Ag2S nanoparticle fitting the elliptical shape.
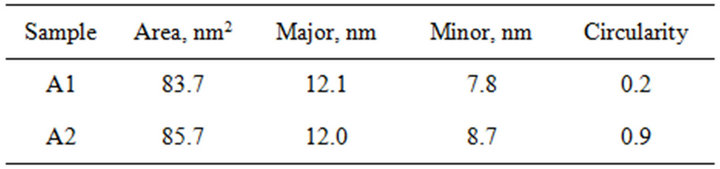
Table 3. Summary of the results for the size analysis for a selection of particles (ellipsoidal shape). A1: Cyanex® 471x 0.01 mol/L, A2: Cyanex® 471x 0.05 mol/L.
and the reproducibility of the experiments might not be good. Nevertheless, it is evident that the extractant is not only a good stabilizer but also works as a morphology control agent.
Figure 6 is a HRTEM bright field image carried out in Ag2S nanoparticles on an amorphous carbon support film. Even if lattice fringes are not direct images of the structure, it can give lattice spacing information. In this case, the measured distance between  planes was 3.919 Ǻ, a value slightly different from the value of 3.960 Ǻ generally reported for the Ag2S monoclinic structure. Besides, the Fast Fourier Transform (FFT) simulated from the particle (Figure 7) showed spots that strongly suggest the
  and
and  planes characteristic of monoclinic Ag2S structure. A particle growth direction along the normal of
  was suggested by Wen for Ag2S nanowires synthesised by a mild gas-solid reaction approach, with fringe spacing measures of 0.40 nm [16]. Deeper studies are needed in order to clarify the particles crystal growth kinetics.
It was speculated that the extractant molecules could be adsorbed onto the particles surface to form organic layers and were apparently not washed off by methanol or acetone. In order to clarify this subject, thermal analysis and FTIR analysis were conducted in order to examine the organic adsorption on the particles, which is also important because the presence of even small amounts of organic impurities on the nanoparticles surface might alter the material properties.
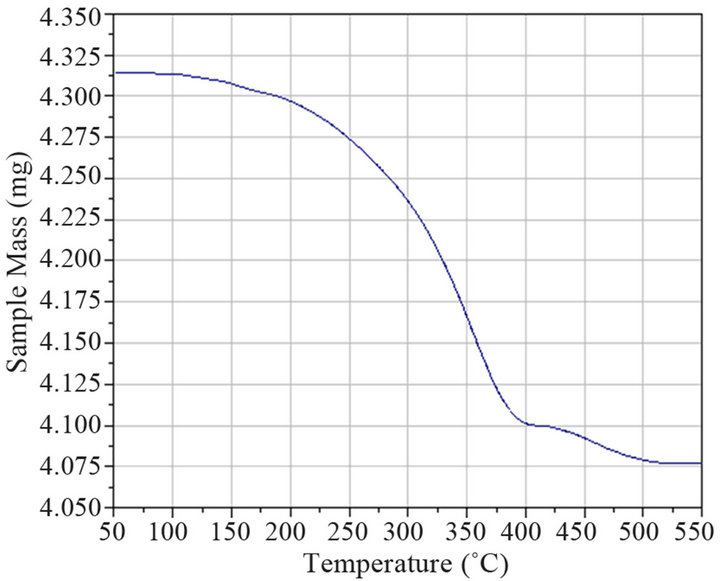
The thermogravimmetrical analysis (Figure 8(a)) showed two weight losses, the first between 150˚C and 400˚C (5% mass loss), and second, a small mass loss of 0.5% between 400˚C and 525˚C, both probably due to desorption of extractant molecules. The temperature range in the first weight loss temperature (250˚C) was broad, possibly corresponding to a “desorption” process.
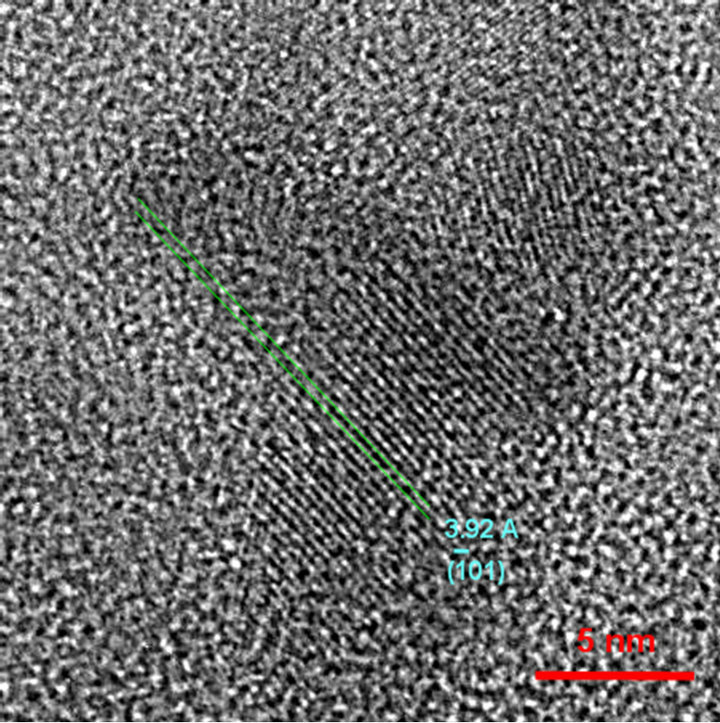
Figure 6. Illustration of lattice image from Ag2S nanometric particles.
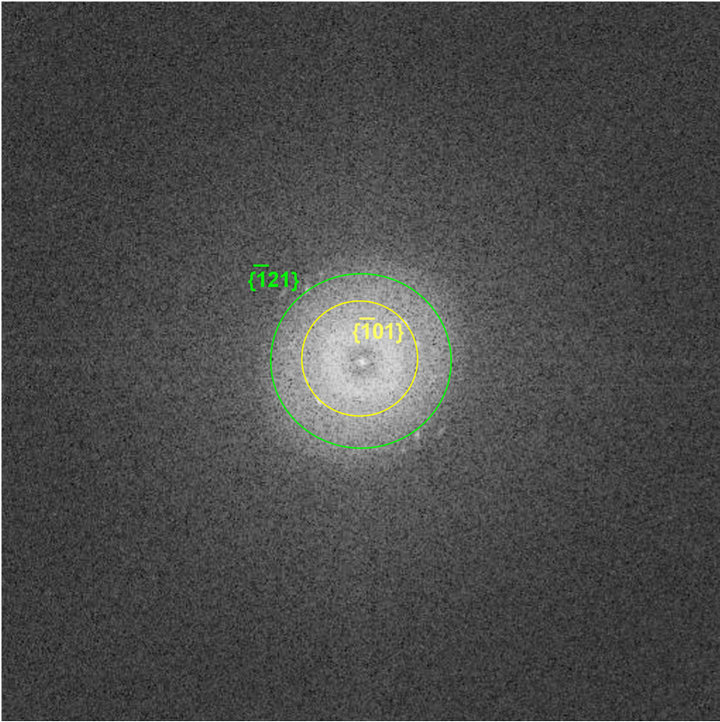
Figure 7. Indexed FFT pattern showing the  and
and  reflections.
 (a)
(a)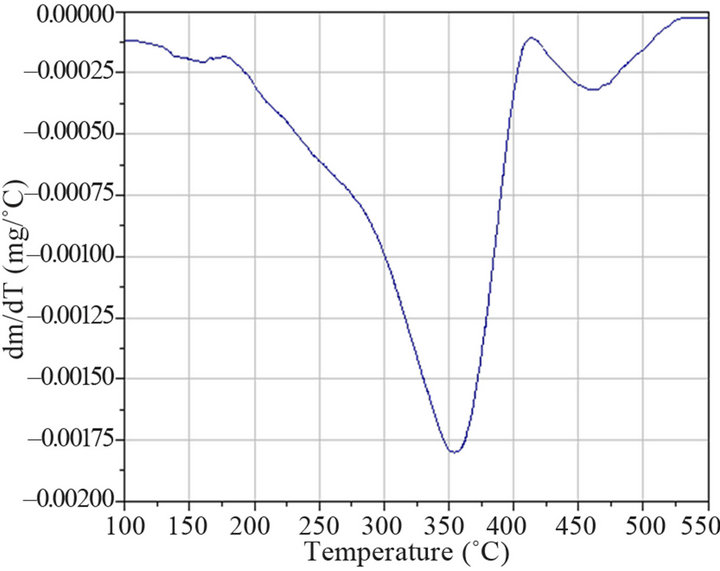 (b)
(b)
Figure 8. (a) Thermal analysis, and (b) maximum rate of mass losses (dm/dt) of silver sulphide synthesized from Cyanex® 471x solution (0.005 mol/L). 0.01 M Ag+ in HNO3 0.1 mol/L.
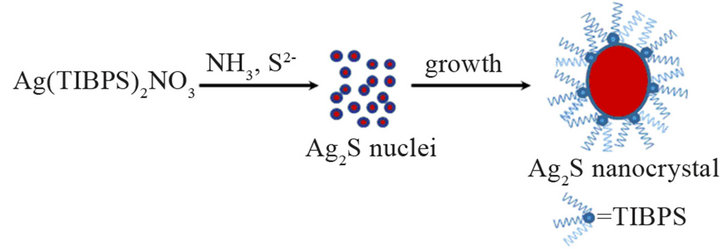
Scheme 1. Synthesis of Ag2S nanocrystals from silver(I)- loaded Cyanex® 471x solutions.
Moreover, the small mass loss starting around 400˚C, could indicate a second desorption process giving a hint of the existence of two kinds of modifier molecules. The peak found at around 350˚C (DTG curve, Figure 8(b)) could represent the characteristic desorption temperature of TIBPS.
The FTIR characterization of the crystals shows the absorption characteristic of the P = S group belonging to Cyanex® 471x at 597 cm–1 [34-36]. Lou et al. Reported a sharp peak at 619 cm−1 in the IR spectrum of Ag2S nanocrystals, synthesized by the thermal treatment of silver dialkyldithiophosphates, indexed to ν(P = S) [37]. The band at 818 (for the sample) and 823 cm–1 (for Cyanex® 471x) can be ascribed to the P-C stretching vibration, and the C-H stretching frequencies appear at 2960 and 2872 cm–1.
The C-H deformation vibrations show a frequency of 1468 cm–1, and bands in the 1367 - 1399 cm–1 region confirm the presence of more than one -CH3 group on a carbon atom [34], giving a hint of the adsorption of the extractant on the nanoparticles.
Interestingly, the strong absorption band at 923 cm–1 could corresponds to the P-O stretching vibration from the phosphine oxide analogue, present in the extractant as impurity, and apparently also adsorbed on the particles. No significant shift in the P-S and P-O bands toward lower or higher frequencies was noted.
The donor atoms of common bases have electronegativities increasing in the order: S < Br < N < Cl < O < F. Therefore, reagents containing sulphur atoms are expected to be strong stabilizers for Ag2S nanoparticles. Cyanex® 471x has been previously used as an effective ligand for silver extraction based on the relatively strong interaction between silver ions and the sulphur atom of the extractant moiety. In this work, it was confirmed that through a two-step synthetic method, nanometrical Ag2S particles can be controllably formed.
As expected, the sulphur sustitution in Cyanex® 471x favors the adsorption of the extractant onto the particles, as predicted by the Hard-Soft Acid-Base (HSAB) principle. After the formation of the nucleii, the preferential growth direction along the normal of , may develop as an entry to the formation of the ellipsoids. The strong coordination ability of Cyanex® 471x for Ag+ can decrease the formation rate of Ag2S nanocrystals. The reaction between the ligand and Ag+ competes with Ag2S crystal growth and leads to the controlled growth of Ag2S particles, keeping them as nanocrystals and hindering aggregation. Furthermore, the growth rate in all directions is not the same, leading to the final morphology of ellipsoids.
4. Conclusion
Silver sulphide particles were prepared by a simple method involving solvent extraction and precipitation from a commercial organophosphorous extractant, and their structural properties were discussed. Investigation revealed that Cyanex® 471x is an effective capping agent, depending on the extraction and stripping experimental conditions chosen. The metal-extractant complex in the organic solution serves as an excellent nanoparticle precursor due to the capability of Cyanex® 471x to compete for the metal binding sites and thus avoiding the incurporation of the sulphide ions during the nucleation process. The Ag2S nanocrystals are possibly coated by two kinds of organic molecules present in the commercial extractant, the tri-isobutylphosphine sulphide and its corresponding oxide. Although further studies are required for a better understanding of the correlation between the mechanism of nanoparticles stabilization and the stripping process, solvent extraction combined with precipitation stripping is a viable alternative for nanomaterials synthesis, because this purification technique is widely used in hydrometallurgy for the recovery and purification of a variety of metals.
5. Acknowledgements
Cytec Canada is thanked for providing the extractant. This work was supported by grants from the Fondo de Apoyo a la Investigación (UASLP) and Fondos Mixtos Consejo Nacional de Ciencia y Tecnología-Gobierno de San Luis Potosí (Project FMSLP 2002-5630). We thank G. Martínez, F. Ruiz, J. Ruiz, R. Vega, M. Lomelí (UASLP), D. Ramírez and N. Cayetano (Instituto Potosino para la Investigación Científica y Tecnológica).
REFERENCES
- E. Combes, C. Sella, D. Bauer and J. L. Sabot, “Precipitation-Stripping of Yttrium Oxalate Powders from YttriumLoaded HDEHP Organic Solutions Using an Ultrasonic Stirrer,” Hydrometallurgy, Vol. 46, No. 1-2, 2000, pp. 1- 12. doi:10.1016/S0304-386X(97)00016-9
- J. Shibata and H. Yamamoto, “Application of Solvent Extraction to Production of Multicomponent Composite Powders,” Proceedings of the International Solvent Extraction Conference, Cape Town, 17-21 May 2002, pp. 543-547.
- Y. Konishi, T. Nomura, K. Mizoe and K. Nakata, “Preparation of Cobalt Ferrite Nanoparticles by Hydrolysis of Cobalt-Iron (III) Carboxylate Dissolved in Organic Solvent,” Materials Transactions, Vol. 45, No. 1, 2004, pp. 81-85. doi:10.2320/matertrans.45.81
- X. Fu, Z.-S. Hu, G.-H. Gu, D.-B. Wang, H.-T. Zhu and X.-D. Zhou, “Study on the Preparation of Nano-Materials with Extractant and Extraction Systems,” International Solvent Extraction Conference, Beijing, 19-23 September 2005, pp. 852-857.
- H.-Q. Shi, X. Fu, X.-D. Zhou and Z.-S. Hu, “Preparation of Organic Fluids Containing Ag2S Nano-Particles with the Extractant Cyanex 301,” International Solvent Extraction Conference, Beijing, 19-23 September 2005, pp. 874-880.
- S.-L. Zhang, H.-Q. Shi, X. Fu and Z.-S. Hu, “Preparation and Characterisation of Organic Fluids Containing Bi2S3 Nano-Particles,”International Solvent Extraction Conference, Beijing, 19-23 September 2005, pp. 858-863.
- M. Brust, M. Walker, D. Bethell, D. J. Schiffrin and R. Whyman, “Synthesis of Thiol-Derivatised Gold Nanoparticles in a Two-Phase Liquid-Liquid System,” Journal of the Chemical Society, Chemical Communications, Vol. 7, 1994, pp. 801-802. doi:10.1039/c39940000801
- M. Brust and C. J. Kiely, “Some Recent Advances in Nanostructure Preparation from Gold and Silver Particles: A Short Topical Review,” Colloids and Surfaces A: Physicochemical and Engineering Aspects, Vol. 202, No. 2-3, 2002, pp. 175-186. doi:10.1016/S0927-7757(01)01087-1
- A. Eychmüller, “Structure and Photophysics of Semiconductor Nanocrystals,” Journal of Physical Chemistry B, Vol. 104, No. 28, 2000, pp. 6514-6528. doi:10.1021/jp9943676
- H.-Q. Shi, X.-D. Zhou, X. Fu, D.-B. Wang and Z.-S. Hu, “Preparation of CdS Nanowires and Bi2S3 Nanorods by Extraction-Solvothermal Method,” Materials Letters, Vol. 60, No. 15, 2006, pp. 1793-1795. doi:10.1016/j.matlet.2005.12.024
- G. Hodes, J. Manassen and D. Cahen, “Photoelectrochemical Energy Conversion and Storage Using Polycrystalline Chalcogenide Electrodes,” Nature, Vol. 261, 1976, pp. 403-404. doi:10.1038/261403a0
- S. Hull, D. A. Keen, D. S. Sivia, P. A. Madden and S. Wilson, “The High-Temperature Superionic Behaviour of Ag2S,” Journal of Physics: Condensed Matter, Vol. 14, No. 1, 2002, pp. 9-17. doi:10.1088/0953-8984/14/1/102
- X.-F. Quian, J. Yin, S. Feng, S.-H. Liu and Z.-K. Zhu, “Preparation and Characterization of Polyvinylpyrrolidone Films Containing Silver Sulfide Nanoparticles,” Journal of Materials Chemistry, Vol. 11, No. 10, 2001, pp. 2504-2506. doi:10.1039/b103708k
- L. Motte, F. Billoudet and M. P. Pileni, “Self-Assembled Monolayer of Nanosized Particles Differing by Their Sizes,” Journal of Physical Chemistry, Vol. 99, No. 44, 1995, pp. 16425-16429. doi:10.1021/j100044a033
- R. De Marco, R. W. Cattrall, J. Liesegang and G. L. Nyberg, “Surface Studies of the Silver Sulfide Ion Selective Electrode Membrane,” Analytical Chemistry, Vol. 62, No. 21, 1990, pp. 2339-2346. doi:10.1021/ac00220a015
- X.-G. Wen, S.-H. Wang, Y.-T. Xie, X.-Y. Li and S.-H. Yang, “Low-Temperature Synthesis of Single Crystalline Ag2S Nanowires on Silver Substrates,” Journal of Physical Chemistry B, Vol. 109, No. 20, 2005, pp. 10100- 10106. doi:10.1021/jp050126o
- L. Yang, R.-M. Xing, Q.-M. Shen, K. Jiang, F. Ye, J.-N. Wang and Q.-S. Ren, “Fabrication of Protein-Conjugated Silver Sulfide Nanorods in the Bovine Serum Albumin Solution,” Journal of Physical Chemistry B, Vol. 110, No. 21, 2006, pp. 10534-10539. doi:10.1021/jp055603h
- D.-Sh. Wang, T. Xie, Q. Peng and Y.-D. Li, “Ag, Ag2S, and Ag2Se Nanocrystals: Synthesis, Assembly, and Construction of Mesoporous Structures,” Journal of the American Chemical Society, Vol. 130, No. 12, 2008, pp. 4016-4022. doi:10.1021/ja710004h
- J.-C. Liu, P. Raveendran, Z. Shervani and Y. Ikushima, “Synthesis of Ag2S Quantum Dots in Water-in-CO2 Microemulsions,” Chemical Communications, Vol. 22, 2004, pp. 2582-2583. doi:10.1039/b410700d
- Z.-B. Zhuang, Q. Peng, X. Wang and Y.-D. Li, “Tetrahedral Colloidal Crystals of Ag2S Nanocrystals,” Angewandte Chemie International Edition, Vol. 46, No. 43, 2007, pp. 8174-8177. doi:10.1002/anie.200701307
- J.-H. Xiang, H.-Q. Cao, Q.-Z. Wu, S.-C. Zhang, X.-R. Zhang and A. A. R. L. Watt, “L-Cysteine-Assisted Synthesis and Optical Properties of Ag2S Nanospheres,” Journal of Physical Chemistry C, Vol. 112, No. 10, 2008, pp. 3580-3584. doi:10.1021/jp710597j
- A. P. Paiva, H. C. Pereira and L. M. Abrantes, “Electroreductive Stripping of Silver in the (C6H5)3P-Na2S2O3 Two-Phase System,” Separation Science and Technology, Vol. 28, No. 13-14, 1993, pp. 2097-2102. doi:10.1080/01496399308016737
- A. P. Paiva, “Solvent Extraction and Related Studies on Silver Recovery from Aqueous Solutions,” Separation Science and Technology, Vol. 28, No. 4, 1993, pp. 947- 1008. doi:10.1080/01496399308029233
- A. P. Paiva, “Review of Recent Solvent Extraction Studies for Recovery of Silver from Aqueous Solutions,” Solvent Extraction and Ion Exchange, Vol. 18, No. 2, 2000, pp. 223-271. doi:10.1080/07366290008934680
- Y. Baba, Y. Umezaki and K. Inoue, “Extraction Equilibrium of Silver(I) with Triisobutylphosphine Sulfide from Nitrate Media,” Journal of Chemical Engineering, Vol. 19, No. 1, 1986, pp. 27-30. doi:10.1252/jcej.19.27
- G.-G. Zuo and M. Muhammed, “Extraction of Noble Metals by Sulfur-Containing Reagents and Solvent Impregnated Resins,” Solvent Extraction and Ion Exchange, Vol. 13, No. 5, 1995, pp. 879-899. doi:10.1080/07366299508918308
- Z. Hubicki and H. Hubicka, “Studies of Extractive Removal of Silver (I) from Nitrate Solutions by Cyanex 471x,” Hydrometallurgy, Vol. 37, 1995, pp. 207-219. doi:10.1016/0304-386X(94)00027-Z
- R. S. Capela and A. P. Paiva, “Extraction of Silver from Concentrated Chloride Solutions: Use of Tri-n-Butyland Tri-n-Octylphosphine Sulphides,”Proceedings of the International Solvent Extraction Conference, Cape Town, 17-21 May 2002, pp. 335-340.
- H. R. Wenk, S. Matthies and L. Lutterotti, “Texture Analysis from Diffraction Spectra,” Materials Science Forum, Vol. 157-162, 1994, pp. 473-480.
- M. Ferrari and L. Lutterotti, “Method for the Simultaneous Determination of Anisotropic Residual Stresses and Texture by X-Ray Diffraction,” Journal of Applied Physics, Vol. 76, No. 11, 1994, pp. 7246-7255. doi:10.1063/1.358006
- G. A. Wiegers, “The Crystal Structure of the Low-Temperature Form of Silver Selenide,” American Mineralogist, Vol. 56, 1971, pp. 1882-1888.
- M. B. McNeil and B. J. Little, “Corrosion Mechanisms for Copper and Silver Objects in Near-Surface Environments,” Journal of the American Institute for Conservation, Vol. 31, No. 3, 1992, pp. 355-366. doi:10.2307/3179729
- G. A. Martínez-Castañón, M. G. Sánchez-Loredo, H. J. Dorantes, J. R. Martínez-Mendoza, G. Ortega-Zarzosa and F. Ruiz, “Characterization of Silver Sulfide Nanoparticles Synthesized by a Simple Precipitation Method,” Materials Letters, Vol. 59, No. 4, 2005, pp. 529-534. doi:10.1016/j.matlet.2004.10.043
- B. Menoyo, M. P. Elizalde and A. Almela, “Determination of the Degradation Compound Formed by the Oxidation of Thiophosphinic Acids and Phosphine Sulphides with Nitric Acid,” Analytical Science, Vol. 18, No. 7, 2000, pp. 799-804. doi:10.2116/analsci.18.799
- R. A. Zingaro and R. M. Hedges, “Phosphine-Halogen Complexes: Effect on P-O and P-S Stretching Frequencies,” Journal of the American Chemical Society, Vol. 65, No. 7, 1961, pp. 1132-1138.
- R. A. Zingaro, “Phosphine Sulphides and Selenides: The Phosphorus-Sulfur and Phosphorus-Selenium Stretching Frequencies,” Inorganic Chemistry, Vol. 2, No. 1, 1963, pp. 192-196. doi:10.1021/ic50005a049
- W.-J. Lou, J.-B. Wang, M. Chen, W.-M. Liu and J.-Ch. Hao, “A Simple Route to Synthesize Size-Controlled Ag2S Core-Shell Nanocrystals, and Their Self-Assembly,” Nanotechnology, Vol. 19, No. 22, 2008, pp. 225607- 225614. doi:10.1088/0957-4484/19/22/225607