Materials Sciences and Applications
Vol.3 No.7(2012), Article ID:21163,7 pages DOI:10.4236/msa.2012.37064
Dielectric and Microwave Properties of Natural Rubber Based Nanocomposites Containing Graphene
![]()
1Department of Physics, Faculty of Science, University of Tabuk, Tabuk, Saudi Arabia; 2Department of Physics, Faculty of Science, King Abdulaziz University, Jeddah, Saudi Arabia; 3Department of Polymer Engineering, University of Chemical Technology and Metallurgy, Sofia, Bulgaria; 4Department of Chemistry, Technical University, Sofia, Bulgaria; 5College of Telecommunications and Posts, Sofia, Bulgaria; 6Hayzen Engineering Co., Ankara, Turkey; 7Department of Physics, Faculty of Science, Suez Canal University, Ismailia, Egypt.
Email: dishov@uctm.edu
Received March 14th, 2012; revised April 15th, 2012; accepted May 10th, 2012
Keywords: Nanocomposites; Natural Rubber; Graphene; Dielectric and Microwave Properties
ABSTRACT
The development of carbon nanotubes based materials has been impeded by both their difficult dispersion in the polymer matrix and their high cost. The discovery of graphene and the subsequent development of graphene-based polymer nanocomposites is an important addition in the area of nanoscience and technology. In this study the influence of graphene nanoparticles (GNP) in concentrations from 2.0 to 10.0 phr on the dielectric (dielectric permittivity, dielectric loss angle tangent) and microwave (reflection coefficient, attenuation coefficient, shielding effectiveness) properties of nanocomposites on the basis of natural rubber has been investigated in the wide frequency range (1 - 12 GHz). The results achieved allow recommending graphene as a filler for natural rubber based composites to afford specific dielectric and microwave properties, especially when their loading with the much more expensive carbon nanotubes is not possible.
1. Introduction
Over the past five decades, industrial scale “composite materials” have been produced by adding different minerals and metals to thermosetting, thermoplastic and elastomeric polymers. As compared to the bulk polymers, these composites have shown moderate mechanical performance improvements in the mechanical properties such as Young's modulus, tensile strength, abrasion resistance and storage modulus. However, recent advances in nanoscale particle synthesis have definitely accelerated the growth of the composite industry. The capacity to synthesize and characterize atomic-level particles has produced a new generation of high-performance fillers and new class of materials—polymer nanocomposites.
Polymer nanocomposites are commonly defined as the combination of a polymer matrix and additives that have at least one dimension in the nanometer range. The additives can be one-dimensional, such as nanotubes and fibres, two-dimensional, which include layered clay minerals or graphene sheets, or three-dimensional, including spherical particles [1].
At present, nanocomposites employing carbon-based reinforcement materials are dominated by carbon nanotubes (CNTs) [2-4]. However, the development of CNTreinforced composites has been impeded by both their difficult dispersion in the polymer matrix and their high cost.
The discovery of graphene [5] and the subsequent development of graphene-based polymer nanocomposites is an important addition in the area of nanoscience and technology. Deservedly the Nobel Prize in Physics for 2010 was awarded to Andre Geim and Konstantin Novoselov from the University of Manchester for their work on a single free-standing atomic layer of carbon (graphene). Graphene is an allotrope of carbon, whose structure is one-atom-thick planar sheets of sp2—bonded carbon atoms packed in a honeycomb lattice. It is the basic structural element of some carbon allotropes including graphite, charcoal, carbon nanotubes and fullerenes.
Compared to carbon nanotubes, as well as its high aspect ratio and low density graphene has attracted considerable attention because of its unique and outstanding mechanical, electrical and electronic properties [6]. In addition to good thermal conductivity, remarkable mechanical stiffness and high fracture strength, graphene has been supposed to be a semiconductor with zero gap which is quite different from conventional silicon semiconductors. In graphene, electrons shoot along with minimal resistance which may allow for low-power, fasterswitching transistor and become a candidate to replace silicon in the area of microchip electronics.
All these unique properties in a single nanomaterial have made physicists, chemists and material scientists exited about graphene’s potential. The history, chemistry, preparation methods and possible applications of graphene are reviewed in [7-9]. Another new review focused on trends and frontiers in graphene-based polymer nanocomposites was published a year ago [10]. Recently, the trustees of Princeton University received a patent for graphene-elastomer nanocomposites where functionalized graphene sheets (FGS) had been dispersed in vulcanized natural rubber, styrene butadiene rubber, Psisoprene-Ps and PDMS [11]. The patented work could find a wide range of industrial applications, including food packaging, gasketing and automotive. The authors conclude that graphene-rubber nanocomposites possess qualities like those of carbon nanotube composites but are much cheaper to make.
The data about graphene influence on the microwave properties of the elastomeric composites are very scarce. Y. Chen et al. used functionalized graphene-epoxy composites as lightweight shielding materials for electromagnetic radiation [12]. I. M. De Rosa and coworkers have a wide expertise in the design of micro/nanocomposites based on carbon fibers and carbon nanotubes, for the realization of high performing radar absorbing screens, with tailored properties [13-15]. In a recent paper [16], the authors have accomplished a Salisbury screen, that consists of three layers. The second layer (the spacer) is a low-loss-tangent nanocomposite based on a Bisphenol-A based epoxy resin filled with GNPs at 0, 5% and 1% wt [16]. The real and imaginary parts of the complex effective permittivity within the 8 - 18 GHz range of the nanocomposite filled with GNPs have been shown. It has been observed that the real part of the effective permittivity is nearly constant.
There are no literature data about the dielectric and microwave properties of nanocomposites comprising a higher amount of graphene nanoparticles (GNP), e.g. over 1 phr. Neither there are available reports on investigations on those properties carried out in a wider frequency range, first of all at frequencies lower than 8 GHz. Therefore the aim of this work is to study the influence that graphene nanoparticles (in amounts of 2 to 10 phr) have on the dielectric (dielectric permittivity, dielectric loss angle tangent) as well as on the microwave properties (absorption and reflection of the electromagnetic waves, the effectiveness of the electromagnetic shielding) of natural rubber based composites in a significantly greater frequency range—from 1 to 12 GHz.
2. Experimental
2.1. Characterisation of the Graphene Used
Graphene as produced by Hayzen Engineering Co., Ankara, Turkey was used in our investigation. Graphene nanoplatelets (GNP) have a “platelet” morphology, meaning they have a very thin but wide aspect. Aspect ratios for this material can range into the thousands. Each particle consists of several sheets of graphene with an overall thickness of 50 nm and average plate diameter 40 micron.
2.2. Prepapation and Vulcanization of Rubber Compounds
Table 1 summarizes the formulation characteristics of the rubber compounds (in phr) used for the investigations.
The rubber compounds were prepared on an open tworoll laboratory mill (L/D 320 × 360 and friction 1, 27) by incorporating pre-characterized graphene nanoplatelets (GNP) into a natural rubber matrix at various loadings (Table 1). The speed of the slow roll was 25 min–1. The experiments were repeated for verifying the statistical significance. The ready compounds in the form of sheets stayed 24 hours prior to their vulcanization.
The optimal vulcanization time was determined by the vulcanization isotherms, taken on an oscillating disc vulcameter MDR 2000 (Alpha Technologies) at 150˚C according to ISO 3417:2002.
These composites were evaluated for their dielectric (dielectric permittivity, dielectric loss angle tangent) and microwave (reflection coefficient, attenuation coefficient, and shielding effectiveness) properties in the 1 - 12 GHz frequency range.

Table 1. Composition of the rubber compounds studied.
3. Measurements
3.1. Microwave Properties
3.1.1. Reflection and Attenuation
Measurements of reflection and attenuation were carried out using the measurement of output (adopted) power Pa in the output of a measuring line without losses, where samples of materials may be included. Because of the wide frequency measurement a coaxial line was used. Samples of the materials were shaped into discs with an external diameter D = 20.6 mm, equal to the outer diameter of the coaxial line and thickness of Δ ≈ 2 mm. The internal diameter depended on the relative dielectric permittivity of the material.
The sample reflected a part of the incident electromagnetic wave with power Pin. The rest of the wave with power Pp penetrated the material, so that the attenuation L depended on the coefficient of reflection |Г|. Its module was determined by a reflect meter.
Thus the attenuation was determined by
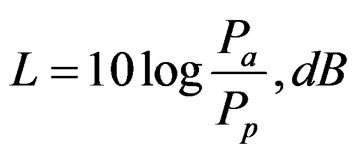 (1)
(1)
where
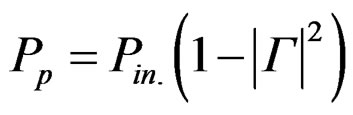 (2)
(2)
The following scheme presents the equipment used for testing both parameters (Figure 1)
1) A set of generators for the whole range: HP686A and G4 - 79 to 82;
2) Coaxial section of the deck E2M Orion, with samples of material;
3) Power meter HP432A;
4) Scalar reflectance meter HP416A; R—Reflect meter, including:
—Two directional couplers Narda 4222.16;
—Two crystal detectors Narda 4503-N.
3.1.2. Shielding Effectiveness (S.E.)
This parameter is defined as the sum of the reflection losses R, dB and attenuation L, dB in the material.
It can be directly measured or calculated from the measured reflectance and attenuation in the material. In the first case, as measured: incident power on the sample
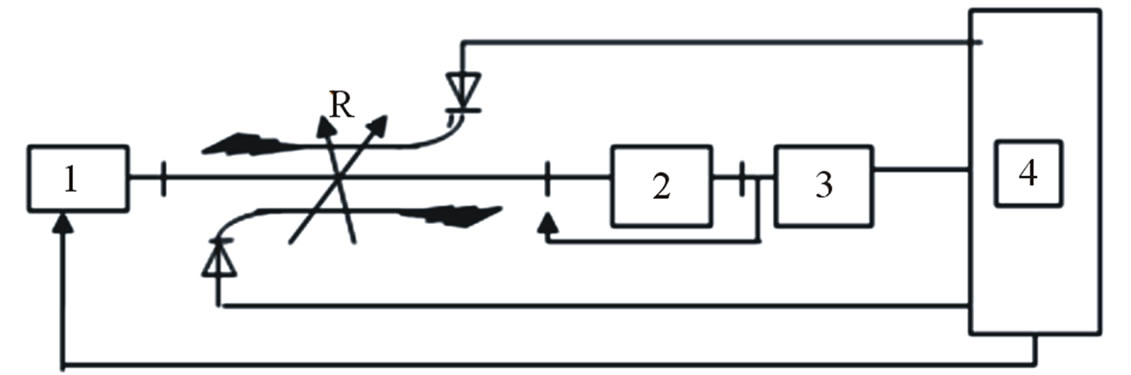
Figure 1. Scheme of the equipment for measuring the microwave properties.
Pin and adopted after the sample Pa (Figure 1), S.E. is determined by
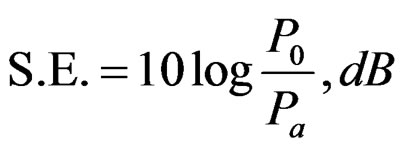 (3)
(3)
In the second, if known reflection and absorption in the material, S.E. is determined, by a definition, as
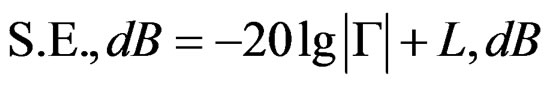 (4)
(4)
where R, dB is the attenuation due to the reflection of power at the interfaces.
In the present work the shielding effectiveness was determined by Equation (4).
3.2. Dielectric Properties
3.2.1. Complex permittivity
The determination of complex permittivity was carried out by the resonance method, based on the cavity perturbation technique.
Having measured the resonance frequency of the empty cavity resonator fr a measurement of the shift in resonance frequency fε was carried out in the presence of the sample material. Then the dielectric constant εr was calculated from the shift in resonance frequency, cavity and the sample cross sections Sr and Sε, respectively
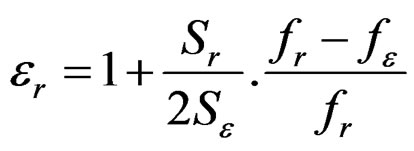 . (5)
. (5)
The sample was in the form of a disc with a diameter of 10 mm and about 2 mm thick. It was placed at the maximum electric field location of the cavity. Because the thickness of the sample was not equal to the height of the resonator, a dielectric occurred with an equivalent permittivity ee at the place of its inclusion. The parameter was determined by (5) and instead er be saved ee. Then er was determined by
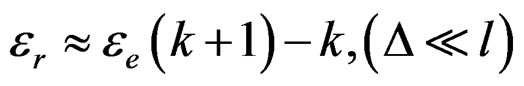 , (6)
, (6)
where  and l is the distance from the disc to the top of the resonator.
3.2.2. Loss Factor tanδ
The loss factor tanδ was calculated from the quality factor of the cavity with Qε and without sample Qr
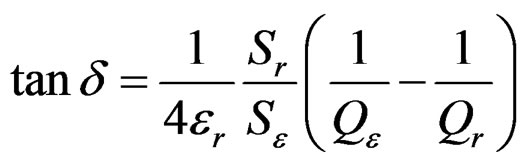 . (7)
. (7)
The measurement setup used several cavity resonators for the whole range, generators for the whole range, frequency meter and oscilloscope.
The following scheme presents the set used for measuring the dielectric properties (Figure 2):
1) Generators for the whole range: HP686A and G4 - 79 to 82;
2) Frequency meters: H 532A; FS - 54;
3) Cavity resonator;
4) Sample;
5) Oscilloscope EO 213.
4. Results and Discussion
4.1. Dielectric Properties
Figures 3 and 4 present the dependence of relative dielectric permittivity (er) and dielectric loss angle tangent (tanδ) on frequency and filler concentration for the studied composites filled with graphene nanoparticles.
4.1.1. Complex Relative Dielectric Permittivity. Real Part
As seen from the plots relative dielectric permittivity increases with the increasing frequency at constant filler concentration as well as with the increasing filler concentration at constant frequency.
The real part of dielectric permittivity is the ratio of the capacity of an electric capacitor filled with the substance investigated to that of the same capacitor in vacuum, at a definite external field of frequency [17]. The dependence of the real part of the complex relative dielectric permittivity on the frequency er (f) is shown in Figure 3. As seen in the concentration interval studied dielectric permittivity values for the non-filled and filled composites are relatively close at lower frequencies (up to 7 GHz). At frequencies higher than 7 GHz the dielectric permittivity increases with the increasing filler concentration. Moreover, there is a tendency of a more pronounced difference in the values for the non-filled and filled composites. The values we obtained for the nonfilled composites are close to the ones for natural rubber at 1000 Hz reported in literature which are 2.40 - 2.70 [18]. As the figure shows our investigations also confirm the fact that the dielectric permittivity increases at higher frequencies. Of particular interest is the 9 - 12 GHz range wherein there is a relatively fast increase in the dielectric permittivity and its dependence on the GNP is the most prominent. Having in mind that the dielectric permittivity is related to the composites polarity [17], probably at frequencies higher than 9 GHz the polarization of the natural rubber matrix is hampered. Hence, the dielectric
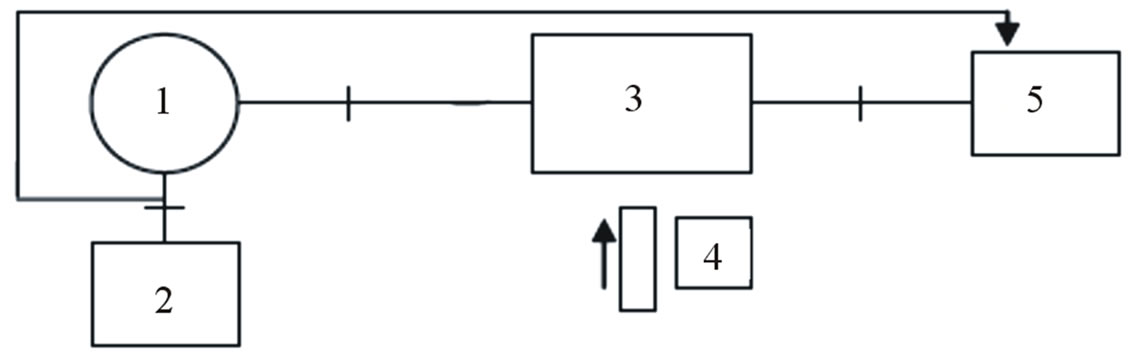
Figure 2. Scheme of the equipment for measuring the dielectric properties.
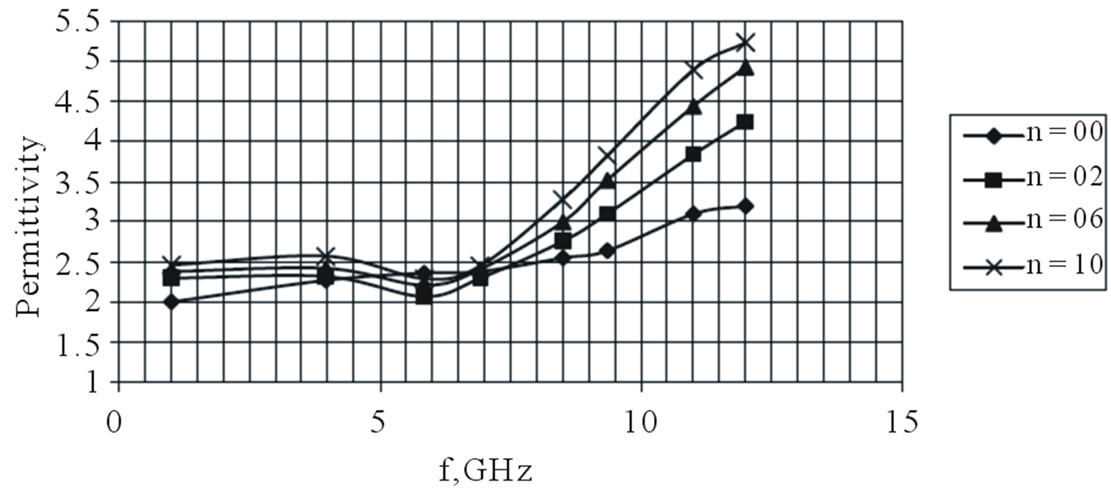
Figure 3. Frequency dependence of relative dielectric permittivity er at various filler content (n-phr of graphene).
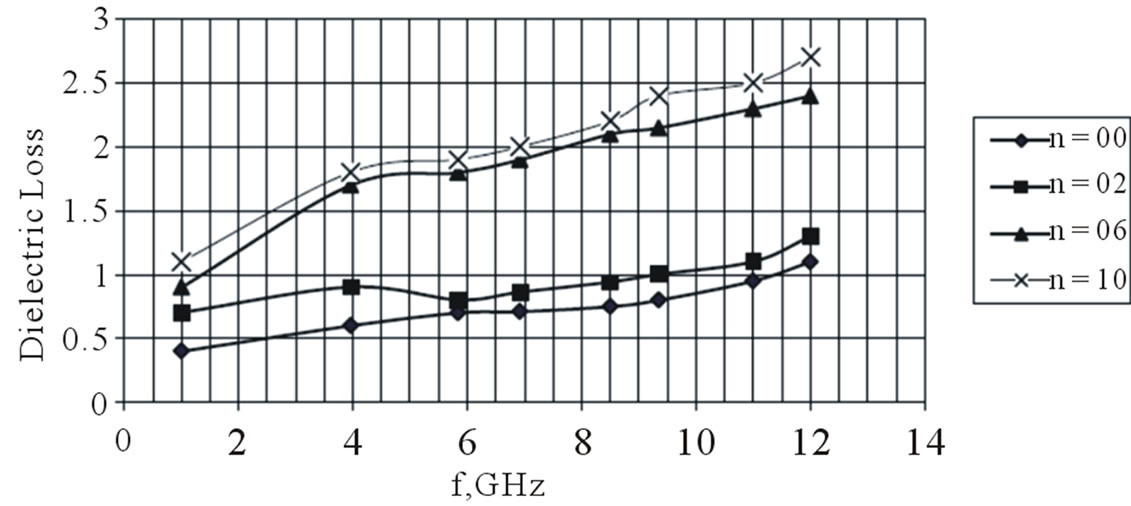
Figure 4. Frequency dependence of dielectric loss tanδε at various filler content (n-phr of graphene).
permittivity increases. On the other hand, the increase in er proves the lower polarization of the composite at higher frequencies.
The figure allows to calculate that the maximum difference within the range of 2 units is between the nonfilled composite and the one comprising 10 phr GNP at 12 GHz. Besides, at frequencies higher than 7 GHz the frequency dependence of dielectric permittivity for the filled composites is much closer to the linear one.
4.1.2. Complex Relative Dielectric Permittivity. Imaginary part (Dielectric loss)
Figure 4 shows the frequency dependence of the imaginary part of the relative complex dielectric permittivity, also known as the dielectric loss angle tangent (tanδε ) in the 4 - 12 GHz range. As expected, the increase in frequency and filler amount leads to an increase in tanδε values. The filler does not change the character of this dependence since it exists for the non-filled composite as well. Noteworthy is the fact that the addition of 2, 0 phr GNP has a relatively slight effect upon tanδε values of the composite which are close to the ones of the matrix. However, tanδε increases considerably at 6, 0 phr filler concentration. It is also seen that the frequency dependence of tanδε both for the non-filled composite and the filled ones has an almost linear character. In the case of composites comprising a higher filler amount the frequency dependence of this parameter is more marked.
4.2. Microwave Properties
Figures 5-7 summarize the microwave properties of the composites studied within the 1 - 12 GHz frequency range.
4.2.1. Coefficient of reflection
The coefficient of reflection is a complex number . For the aims of the present study it is enough to estimate its modulus |Г| that is the reflected part of the electromagnetic wave falling upon the sample. That allows determining the absorption properties of the tested material. Figure 5 shows the frequency dependence of |Г|. As seen the higher the frequency and filler amount the higher |Г| is. The figure also reveals that |Г| values do not exceed 0.60 within the entire frequency range. A connection should be made between the dielectric losses mentioned above (Figure 4) which smoothly increase, though in a relatively small range. That to a great extent explains the small changes in the attenuation coefficient. One should keep in mind the fact that the composite comprises a foaming agent making its structure porous what lowers its attenuation coefficient values. As a whole the attenuation coefficient slightly increases with the increasing frequency and filler amount. The increase is particularly in the 6 - 12 GHz region. In the 1 - 6 GHz region the effect of frequency and filler amount on the attenuation coefficient is less pronounced. The effect is in accordance with the one upon the real part of the complex dielectric permittivity (Figure 3).
4.2.2. Attenuation Coefficient
The frequency dependence of the attenuation coefficient
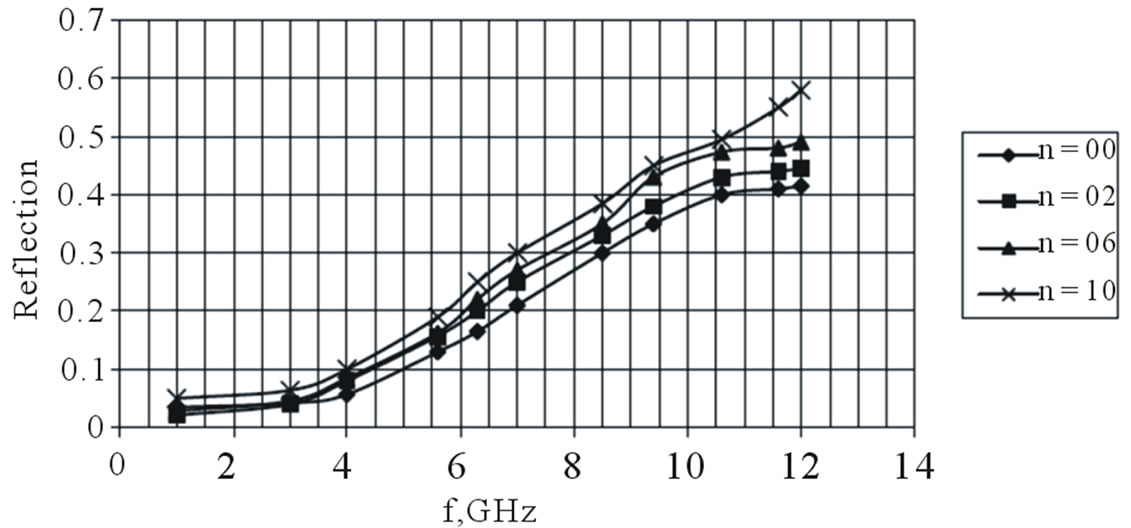
Figure 5. Frequency dependence of reflection |Г| at various filler concentrations (n-phr of graphene).
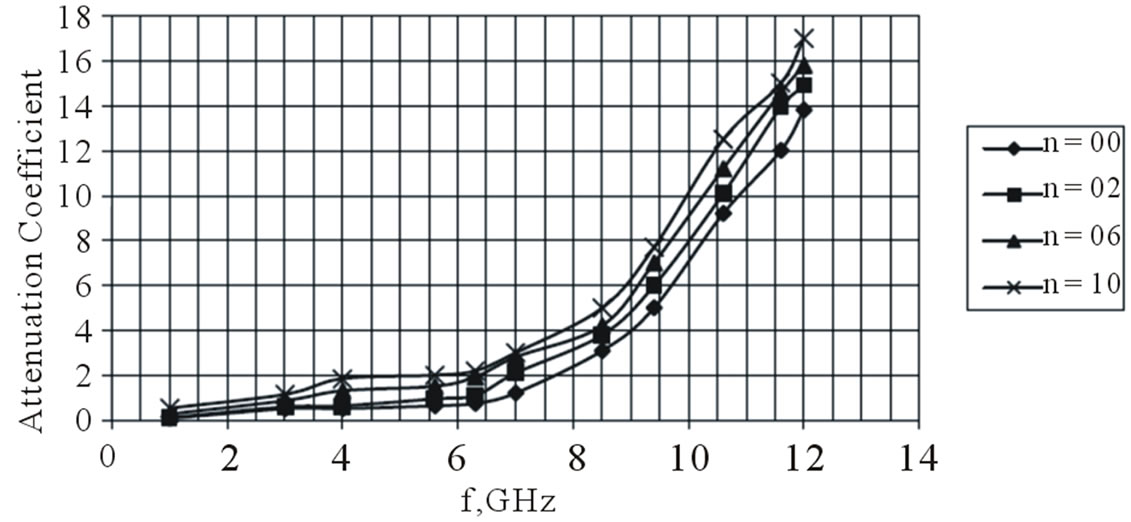
Figure 6. Frequency dependence of attenuation coefficient α of electromagnetic waves at various filler concentrations (nphr of graphene).
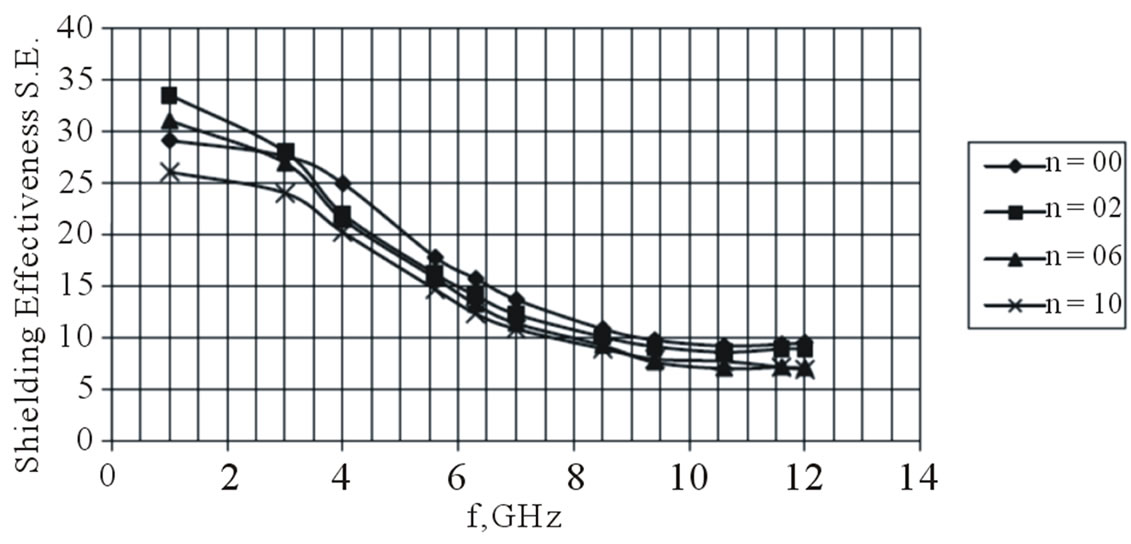
Figure 7. Frequency dependence of shielding effectiveness at various filler content (n-phr of graphene)
(α) could be studied in three frequency ranges: 1) 1 - 6 GHz; 2) 6 - 9 GHz and 3) 9 - 12 GHz (Figure 6). In the first range α £ 2.2 dB/cm; in the second 2.2 £ α £ 6 dB/cm and in the third 6 £ α £ 17. As the figures show in the first frequency range the attenuation remains almost unchanged, especially for the non-filled composites and for those with a small amount of filler.
There is a statistically significant attenuation increase with the increasing frequency and filler amount. This increase is considerable in the third frequency range especially for the filled composites. The effect is less pronounced for the non-filled ones. The comparison of the said dependence with those of the reflection coefficient and dielectric permittivity reveals a similarity that is obviously due to the same factor (the structure of grapheme and its specifics). It should be noted that the maximum attenuation of 17 dB/cm at 12 GHz is for a composite comprising 10 phr GNP.
4.2.3. Shielding Effectiveness
Figure 7 plots the frequency dependence of the electromagnetic shielding effectiveness (S.E.). At lower frequencies S.E. values are higher but decrease with the increasing frequency. In the (1 - 7) GHz the dependence has a character close to the linear one. There is also a range (7 - 12 GHz) of a relatively small effect of frequency and filler amount on S.E. values which remain in the 7 и 10 dB range. The initial values are due mainly to the return loss which are of interference nature. At the highest frequencies in the said range the attenuation in the sample is not great enough to compensate the increase in the reflection coefficient (Figure 5) and (Figure 6), hence the shielding effectiveness decreases.
5. Conclusions
1) The effect that graphene nanoparticles have upon the dielectric and microwave properties of natural rubber based composites filled at 2.0 up to 10.0 phr has been studied in the 1 - 12 GHz range.
2) It has been found that the dielectric permittivity increases slightly with the increasing frequency and filler amount. The effect is pronounced especially in the 9 - 12 GHz range. The tendency is the same in the case of dielectric loss angle tangent, although the impact of the filler amount is less marked, i.e. the imaginary part of the complex relative dielectric permittivity is less sensitive to alternations of the filler amount and frequency than the real part.
3) The reflection coefficient increases with the increasing filler amount and frequency. The effects are not well pronounced. The availability of a foaming agent contributes to the low reflection coefficient.
4) The attenuation coefficient has been found to be almost frequency and filler amount independent in the 1 - 6 GHz range, then in the 6 - 9 GHz range it increases slightly, while in the 9 - 12 GHz range its values increase drastically with the increasing frequency and filler amount. The dependence is almost a linear one.
5) The frequency and filler amount have an effect upon the reflection and attenuation coefficients as well as upon the electromagnetic shielding effectiveness. S.E. values are in the 10 - 34 dB range. The attenuation is not great enough to compensate the increasing reflectance. Therefore as a whole the shielding effectiveness decreases gradually with the increasing frequency, especially at frequencies up to 7 GHz.
6) The effect of graphene nanoparticles upon the dielectric and microwave properties of the composites studied occurs mainly in the 6 - 12 GHz range at a minimal filler amount of 6 phr.
7) The results achieved allow recommending graphene as a filler for natural rubber based composites to afford specific dielectric and microwave properties, especially when their loading with the much more expensive carbon nanotubes is not possible.
6. Acknowledgements
The present research is a result of an international collaboration program between the University of Tabuk, Tabuk 71491, Kingdom of Saudi Arabia and the University of Chemical Technology and Metallurgy, Sofia, Bulgaria. The authors gratefully acknowledge the financial support from the University of Tabuk.
REFERENCES
- S. Thomas and R. Stephen, “Rubber Nanocomposites Preparation, Properties and Applications,” Wiley, Singapore, 2010.
- P. M. Ajayan, “Single-Walled Carbon Nanotube-Polymer Composites: Strength and Weakness,” Advanced Materials, Vol. 12, No.10, 2000, pp. 750-753. doi:10.1002/(SICI)1521-4095(200005)12:10<750::AID-ADMA750>3.0.CO;2-6
- E. T. Thostenson, “Advances in the science and technology of Carbon Nanotubes and Their Composites: A Review,” Composites Science and Technology, Vol. 61, No. 13, 2001, pp. 1899-1912. doi:10.1016/S0266-3538(01)00094-X
- A. Krueger, “Carbon Materials and Nanotechnology,” Wiley, New York, 2010.
- K. S. Novoselov, “Electric Field Effect in Atomically Thin Carbon Films,” Science, Vol. 306, No. 5696, 2004, pp. 666-669. doi:10.1126/science.1102896
- H. J. Salavagione, G. Martínez and G. Ellis, “GrapheneBased Polymer Nanocomposites” in: S. Mikhailov, Ed., Physics and Applications of Graphene—Experiments, InTech, Rijeka, 2011, pp. 169-192.
- M. J. Allen, V. C. Tung and R. B. Kaner, “Honeycomb carbon: A Review of Graphene,” Chemical Reviews, Vol. 110, No. 1, 2010, pp. 132-145. doi:10.1021/cr900070d
- Y. Zhu, S. Murali, W. Cai, X. Li, J. W. Suk, J. R. Potts and R. S. Ruoff, “Graphene and Graphene Oxide: Synthesis, Properties, and Applications,” Advanced Materials, Vol. 22, No. 35, 2010, pp. 1-19. doi:10.1002/adma.201001068
- O. C. Compton and S. T. Nguyen, “Graphene Oxide, Highly Reduced Graphene Oxide, and Graphene: Versatile Building Blocks for Carbon-Based Materials,” Small, Vol. 6, No. 6, 2010, pp. 711-723. doi:10.1002/smll.200901934
- P. Mukhopadhyay and R. K. Gupta, “Trend and Frontiers in Graphene-Based Polymer Nanocomposites,” Plastics Engineering, 2011. www.4spe.org
- R. K. Prud’Homme, B. Ozbas, I. Aksay, R. Register and D. Adamson, “Functional Graphene-Rubber Nanocomposites,” US Patent No. 7745528, 2010.
- J. Liang, Y. Huang, Y. Ma, Z. Liu, J. Cai, C. Zhang, H. Gao and Y. Chen, “Electromagnetic Interference Shielding of Graphene/Epoxy Composites,” Carbon, Vol. 47, No. 3, 2009, pp. 922-925. doi:10.1016/j.carbon.2008.12.038
- I. M. De Rosa, F. Sarasini, M. S. Sarto and A. Tamburrano, “EMC impact of Advanced Carbon Fiber/Carbon Nanotube Reinforced Composites for Next Generation Aerospace Applications,” IEEE Transactions on Electromagnetic Compatibility, Vol. 50, No. 3, 2008, pp. 556- 563. doi:10.1109/TEMC.2008.926818
- I. M. De Rosa, R. Mancinelli, F. Sarasini, M. S. Sarto and A. Tamburrano, “ Electromagnetic Design and Realization of Innovative Fiber-Reinforced Broad-Band Absorbing Screens,” IEEE Transaction on Electromagnetic Compatibility, Vol. 51, No. 3, 2009 pp. 700-707. doi:10.1109/TEMC.2009.2018125
- I. M. De Rosa, A. Dinescu, F. Sarasini, M. S. Sarto and A. Tamburrano, “Effect of Short Carbon Fibers and MWCNTs on Microwave Absorbing Properties of Polyester Composites Containing Nickel-Coated Carbon Fibers,” Composites Science and Technology, Vol. 70, No. 1, 2010, pp. 102-109. doi:10.1016/j.compscitech.2009.09.011
- G. De Bellis, I. M. De Rosa, A. Dinescu, M. S. Sarto and A. Tamburrano, “Electromagnetic Absorbing Nanocomposites Including Carbon Fibers, Nanotubes and Graphene Nanoplatelets,” Proceedings of the 2010 IEEE International Symposium on Electromagnetic Compatibility, Fort Lauderdale, 25-30 July 2010, pp. 202-207. doi:10.1109/ISEMC.2010.5711272
- P. Banerjee and S. Biswas, “Dielectric Properties of EVA Rubber Composites at Microwave Frequencies,” Journal of Microwave Power and Electromagnetic Energy, Vol. 45, No. 1, 2011, pp. 24-29.
- A. Kornev, A. Bukanov and O. Sheverdiaev, “Technology of Elastomeric Materials,” in Russian, Istek, Moscow, 2005.