Journal of Modern Physics
Vol.5 No.2(2014), Article ID:42289,6 pages DOI:10.4236/jmp.2014.52015
X-Ray and VUV Spectra from the Laser Plasma Produced with “Kanal-2” Facility
P. N. Lebedev Physical Institute of RAS, Moscow, Russia
Email: starodub@sci.lebedev.ru
Received October 18, 2013; revised November 17, 2013; accepted December 19, 2013
ABSTRACT
The paper presents experimental results obtained on “Kanal-2” facility. Laser radiation focusing on the surface of plane magnesium targets created the high temperature plasma, which emitted X-ray and vacuum ultraviolet (VUV) radiation. This radiation spectrum was investigated with two spectrographs: the mica crystal spectrograph (working range 8.2 Å - 9.6 Å) and the grazing incidence VUV spectrograph (working rage 30 Å - 130 Å). A set of beryllium stepwise attenuators appended the diagnostic complex and allowed us to get an approximated picture of a continuous spectrum within the range of 2.2 Å - 6.2 Å. The estimation of the plasma electron temperature Te from the ratio between the intensity of the dielectronic satellites and the resonance line gives Te ~ 180 eV. The ratio between the intensity of the resonance and intercombination lines gives the electron density of the emitting zone ne ~ 2 × 1019 cm−3. Some lines observed within the spectral range of 8.5 Å - 9.1 Å belong to none of the transitions of Mg ions. Perhaps the observed spectrum is determined by the transitions in so-called hollow ions of Mg, i.e. in the ions with unfilled inner shells. The spectra obtained with the grazing incidence spectrograph and with the minimum-directioned discrepancy iteration method of spectrum reconstruction from the attenuation curve in the beryllium stepwise attenuators are also presented.
Keywords:Laser Plasma; X-Ray Spectra; VUV Spectra; Plasma Diagnostics
1. Introduction
Despite the fact that a lot of works have been devoted to the study of plasma X-ray radiation produced at focusing the high-power laser radiation on the solid target surface (e.g. [1-5]), many problems still remain to be unsolved. Such factors as small size of the studied object (10−1 - 10−2 cm), short lifetime (~10−9 s), high temperature (100 - 1000 eV) and density (1019 - 1022 cm−3) put forward strict requirements to the means of such plasma diagnostics. The study of hard (1 Å - 20 Å) and soft (20 Å - 200 Å) X-ray radiation is the most informative means of plasma diagnostics.
If at the stage of formation and heating of plasma produced with the laser radiation reshapes a quasi-equilibrium charge structure of ions, at the subsequent stages of retraction, it can appear essentially non-equilibrium. Besides, the model of a local thermodynamic equilibrium (LTE) and the corona model (CM) widely using at calculations have the restricted areas of feasibility, and both can appear unsuitable for values of electronic temperature and density having a place in experiment.
2. Experimental
The investigated spectra of plasma radiation from the targets made of different materials (Be, B, C, Mg, Al, Cu) were created with “Kanal-2” (“Channel-2”) facility [6]. The facility was constructed and the experiments were done in the Laboratory of Laser Influence on Matter of P. N. Lebedev Physical Institute of RAS. The targets were irradiated by the laser with controlled function of mutual coherence. The laser wavelength was 1.06 μm; pulse duration, 2.5 ns; beam divergence, 1.4 × 10⁻³. The laser pulse energy in this series of experiments varied within the limits of 5 - 40 J, the focusing spot diameter made ~170 μm, and, correspondingly, the flux density was ~(1 - 7) × 1013 W/cm2. In the present paper we consider the X-ray spectra of Mg target.
The diagnostic complex consisted of two spectrographs and a set of beryllium step attenuators. A detailed description of the complex was given in [7]. One of the spectrographs was arranged using a modified Johann scheme similar as described in [8]. We used a mica crystal with the interplanar spacing 2d = 19.84 Å as the working element. To improve the spectrograph optical efficiency the crystal was arched over the sphere with the radius of 10 cm. The distance between the target and the crystal was 52 cm. The X-ray radiation incidence angle was 22˚30'. The spectrum was registered by means of an “open” one-dimensional CCD (charge coupled device) TCD1304A, and its output signal was directed to the computer. With account for a concrete geometry, the spectrograph working range lied within the limits of 8.2 Å - 9.6 Å.
The second spectrograph was the GIS-S spectrograph (Grazing Incidence Spectrograph-Small) specially made for the experiments with “Kanal-2” facility. The dispersant in this spectrograph presented a concave grating (600 grooves per mm; the curvature radius, 1 m; W-Re coating; grazing angle, 4˚). This spectrograph had a NonRowland scheme of spectra registration, where the spectrum was registered in the plane perpendicular to the diffracted beams. So, the precise focusing takes place just for one wavelength, which corresponds to the cross point of the registration plane and the Rowland circle. However, due to the spectrograph small angular aperture, the beam defocusing in the non-Rowland geometry is small. Thus, the spectrum can be registered in a rather wide spectral range (±50 Å from the precise focusing point). One should note that from the shortwave side the registration range is limited by a sharp drop in the reflection coefficient of λ < 30 Å. The fact that the grating effectively suppresses the second order diffraction turned to be useful for facilitating correct measurement of the wavelengths. The measurements of the intensity of the line Ly α of the ion B V (λ = 48.41 Å) in the diffraction first and second orders made in the same series of experiments have shown that in the diffraction second order the intensity is ~15 times smaller than in the first one. Such a high efficiency of the second order diffraction suppression allows one to neglect it, and take into account only the diffraction first order for the ranges 30 Å - 60 Å and 60 Å - 90 Å. Only for the range higher than 90 Å one should take into account the third order, and for the range higher than 120 Å, the fourth order (the attenuation coefficients for the third and fourth orders make ~1.7 of the first order). The spectrograph working range was 30 Å - 130 Å, and the precise focusing was observed at the wavelength of 80 Å. The spectrum was registered using one-dimensional CCD (charge coupled device) TCD- 1304A coated with Р-46 phosphor. The spectral resolution in this scheme of registration was 0.33 Å. The output signal was directed to the computer.
The diagnostic complex also contained a set of beryllium stepwise attenuators. The filter thickness varied from 1.8 to 5.0 mm. The obtained dependence of the coefficient of X-ray radiation attenuation on the filter thickness was treated numerically by the minimum-directioned discrepancy method [9,10]. This has allowed one to get an approximated picture of a continuous spectrum within the range 2.2 Å - 6.2 Å.
3. Results
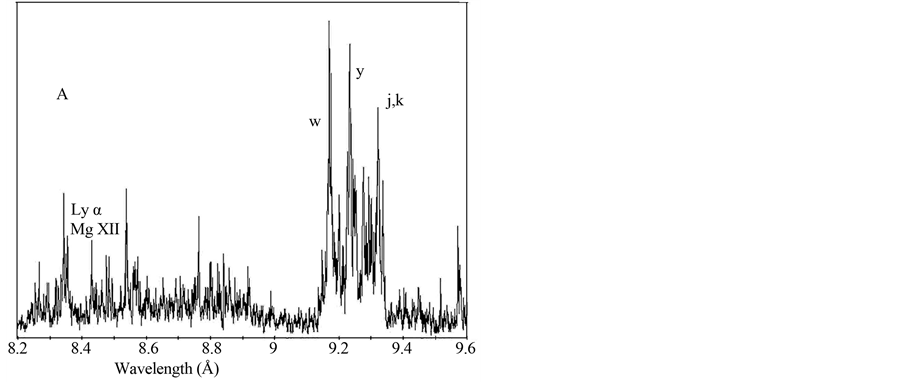
Figure 1(A) illustrates the spectrum obtained by means of a modified Johann spectrograph. Observing the spectrum one can see the resonance (w, λ = 9.1678 Å) and intercombination (y, λ = 9.2314 Å) lines of He-like Mg XI ion, as well as the dielectronic satellites (j, k) (we use universally recognized system of line and satellite notation, see, e.g., [11]). Because of small difference in the wavelengths of the satellites j and k (λ = 9.3213 Å and 9.3182 Å, correspondingly), the lines are not resolved in the spectrogram. One can estimate the plasma temperature from the ratio between the sum intensity of the dielectronic satellites (j, k) and the resonance line w. In our case the plasma temperature was 180 eV. This value should be considered as the space and time averaged one. It is obvious that there are the regions with higher and lower temperature. The ratio between the intensity of the resonance and intercombination lines (w and y) gives a possibility to find the electron density ne of the emitting zone. Our estimates give ne ~2 × 1019 cm−3.
The resonance doublet Ly α of H-like Mg XII ion (λ = 8.4174 Å and 8.4228 Å) is present in the spectrum. Due to a small difference in the wavelength, the mentioned lines are not resolved as well. Note that the intensities of those lines are significantly smaller as compared to the intensity of the resonance line w of He-like Mg XI ion, and this is indicative of the fact that the number of Mg XII ions in the plasma is essentially smaller than the number of Mg XI ions. Since the ionization potentials of Mg XII and Mg XI constitute 1963 eV and 1762 eV correspondingly, then the observed effect seems to be unexpected.
Note that within the spectral range of 8.5 Å - 9.1 Å there are observed the lines, which belong to none of the transitions of Mg ions (see Figure 1(A)). In this regard the paper [12] is of interest. The authors of the mentioned paper have also observed the spectral lines in the noted range. In the discussed paper, the plasma was produced by an excimer Xe-Cl laser (the wavelength, 0.308 μm; the energy, 2 J; pulse duration, 12 ns). The laser flux density was ~4 × 10¹² W/cm2. The authors assumed that


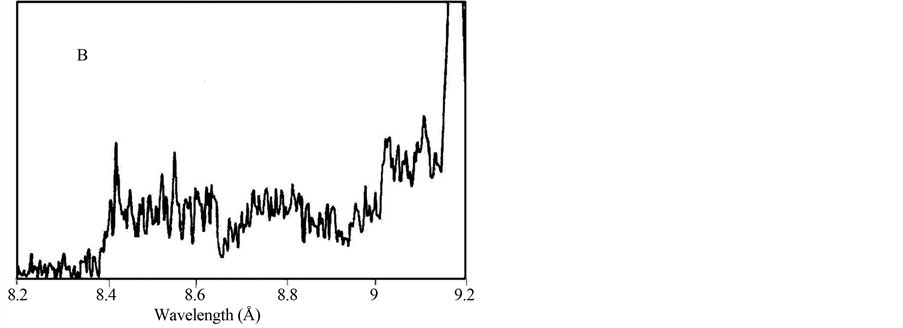
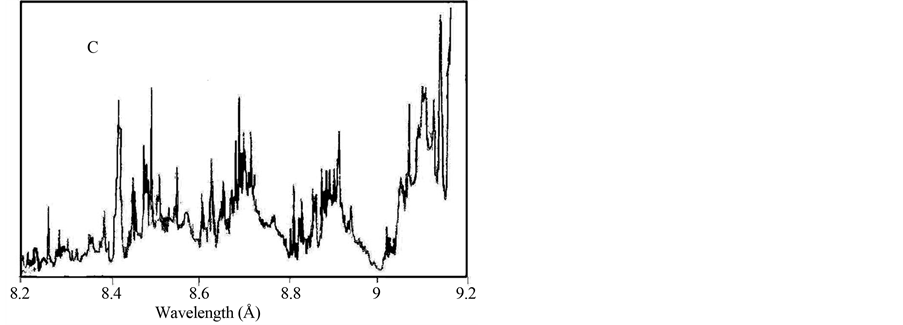
Figure 1. The experimental and theoretical spectra of Mg plasma within the range of 8.2 ÷ 9.6 Å: A) the present paper; B) paper [12], experimental spectrum; C) paper [12], calculation. The diagrams are brought to the same scale.
the observed spectrum is determined by the transitions in so-called hollow ions of Mg, i.e. in the ions with unfilled inner shells. The results from the paper [12] are shown in Figures 1(B) (experiment) and (C) (calculation). Since the A, B and C spectra in Figure 1 are brought to the same scale, one can see that the spectra slightly correspond to each other. That fact merits attention, that some peaks obtained in calculations of article [12] (for example, on a wavelength close to 8.7 Å and 8.9 Å), are watched in our experiments while on the experimental spectrum obtained in the article [12], these peaks are not watched. The possible cause of this phenomenon is very small width of the indicated peaks. The general view of the spectrum shown in Figure 1(B) allows one to suppose that spectral resolution of the spectrograph used in article [12] is not enough for registration of so narrow peaks.
Using the grazing incidence spectrograph GIS-S, we obtained the spectrum for the range of 30 Å - 80 Å. The spectrum is presented in Figure 2. The observed lines have been identified and the results are listed in Table1 As seen from the above data, the main contribution into the radiation is made by Mg X and Mg IX lines, i.e. by Liand Be-like ions. However, from the above it does not follow that the number of Mg XI ions is small. The point is that there are present only two lines of Mg XI within the range of 30 Å - 90 Å, which correspond to the transition 1s2s - 1s3p, and, according to the data from [13], the intensity of those lines is more than an order smaller as compared to the intensity of the resonance and intercombination lines. Since one of the lines (the brighter one) we have registered, one may conclude that the number of Mg XI ions is comparable to the number of Mg X and Mg IX ions.
Since the Mg X and Mg IX ions (the ionization potentials 367.5 eV and 328.2 eV, correspondingly), possess the highest intensity registered with the GIS-S spectrograph, we can come to a conclusion that the electron temperature of plasma (Te), which makes the greatest contribution into the noted spectral range, lies within the interval 100 - 200 eV. Remember, the electron temperature found from the ratio between the intensity of dielectronic satellites and the intensity of the resonance line of Mg XI ion constituted ~180 eV, and this falls within the noted spectral range.
It is of interest to compare the spectra obtained in our experiments on the GIS-S spectrograph with the results

Figure 2. The spectrum of the magnesium plasma obtained on the grazing incidence spectrograph GIS-S.
Table 1. Interpretation of the spectra shown in Figure 2.
obtained approximately in the same spectral range on the “Delfin-1” laser facility in [14]. In those experiments, the authors used a targets made of glass (SiO2). Despite the fact that the laser energy (641 J) was much higher than in our case, the main input into the radiation was made by the Si XII and Si XI ions, that is, the lithiumand beryllium-like ions (the ionization potentials of 523.5 eV and 476 eV, respectively).
One may explain this unexpected effect with a suggestion of a so-called “freezing” of the ionization degree. The phenomenon was considered in detail in [15]. It had been assumed in that paper that if an expanding plasma is being cooled down rather slowly, after the laser pulse cessation, then the ionization degree should tend to a constant nonzero value, at which the recombination should not proceeds to a final point (the ionization is “freezing”). It seems that the above phenomenon takes place in both cases (in the experiments described in [14] and in our studies), and we have observed the radiation of the “freezing” ions approximately at the same stage.
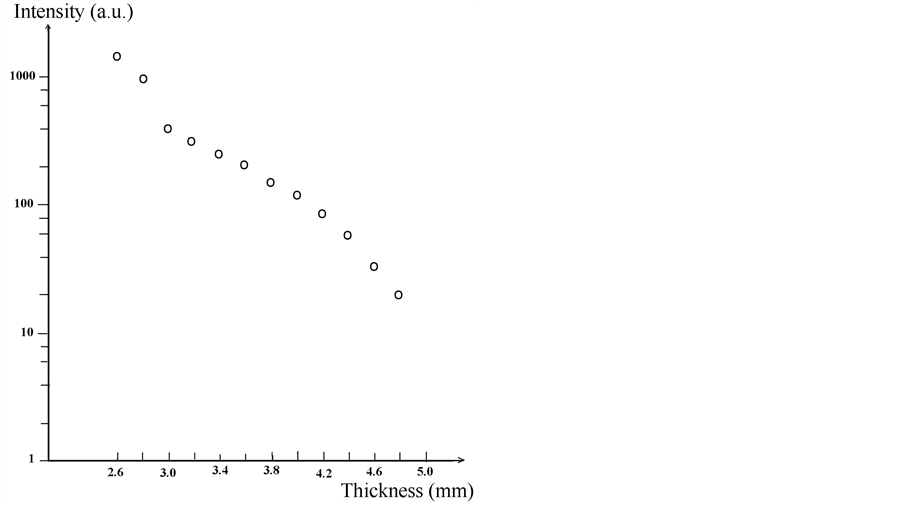
To explore a hardest spectral region (~2 Å - 6 Å), we used a stepwise attenuator consisting of 13 beryllium filters. Thickness of the filters varied within the range of 2.6 to 5.0 mm with a 0.2-mm step. But since a signal magnitude behind a 5 mm-thick filter was smaller than the apparatus sensitivity threshold, actually the greatest thickness of the filter was 4.8 mm. The attenuation curve in relative units is depicted in Figure 3.
Before treatment of these data by the minimum-directioned discrepancy iteration method described in [9] we had performed a preliminary estimation of the spectral range boundaries, within which the spectrum could be reconstructed by the attenuation curves.
We considered the dependence of the ratio of the radiation attenuation coefficients at the given wavelength for the beryllium filters of 4.8 and 2.6 mm thickness, as shown in Figure 4. The data for an estimation of the given dependence had been borrowed from the X-ray spectrum handbook [16]. Since the upper limit in the number of X-ray ions is not higher than ~1017, the field of applicability of the method is restricted by the long wavelength region of ~6.2 Å. The short wavelength

Figure 3. The X-ray radiation attenuation versus thickness of a beryllium absorption layer.

Figure 4. The calculated wavelength dependence of the radiation reduction factor for the beryllium filters of 2.6 and 4.8 mm thickness.
boundary is determined from a condition where the difference of the filter signal magnitudes is noticeably higher than the amount of noise. One can see from Figure 4 that at short wavelengths this difference becomes very small even for the filters of the greatest and the smallest thickness. As a result, the short wavelengths boundary was taken to be of 2.2 Å.
The results of the spectrum reconstruction by the minimum-directioned discrepancy iteration method are represented in Figure 5. As a first approximation, we considered a Maxwell distribution at Te = 240 eV, because the parameters of inconsistency of the calculated and experimental values of attenuation factors are minimal under these conditions. The number of the iterations is 250. A further increase in the iterations does not lead to a decrease in the inconsistencies.
One can see from Figure 5 that the reconstructed spectrum in the range of 2.2 Å - 2.8 Å is close to the Maxwellian one corresponding to Te = 150 eV. To compare, we have also represented the Maxwellian spectra corresponding to Te = 180 eV (achieved at relative intensities of dielectronic satellites and the resonant line of MgXI ion) and to Te = 240 eV (the parameters of inconsistency of the calculated attenuation factor with the experimental data are the smallest).
4. Conclusions
To conclude, let us note the following. By using different methods, we obtained that the electron temperature achieved 150 - 240 eV and the electron density defined by the ratio of intensities of resonant and intercombination lines of the MgXI ion was ~2 × 10¹⁹ сm−3. It means that the main contribution into the integrated of time and space picture of radiation is given by cooling plasma at late stages of retraction. Under these conditions, it is rather difficult to compare the experimental and theoretical results because neither the local thermodynamic equilibrium (LTE) model nor the corona model (CM) could be applied (see Table 2).
Data in this table were obtained from the follows equ-

Figure 5. The X-ray radiation spectrum reconstructed from the attenuation curve in the range of 2.2 Å - 6.2 Å (1) and the spectra corresponding to the Maxwell distribution at Te = 150 eV (2), 180 eV(3), and 240 eV(4).
Table 2. Fields of applicability of the LTE and CM models for the ionizing plasma calculated for Te = 200 eV.
ations (see [17,18]):
For LTE:

For CM:

Here ne and Te are the electron concentration and the temperature in сm−3 and eV, respectively; ΔEz−11,2, the energy of the excited ion level with the charge z – 1; and Ry, the Rydberg constant, in eV.
So, the main contribution into the plasma radiation is made by the magnesium ions from MgXI (helium-like) to MgIX (beryllium-like) within the range of 30 Å - 80 Å. The brightest line of Ly α of the hydrogen-like MgXII is weak, which shows that the amount of MgXII ions is negligible. Within the spectral range of 8.6 Å - 9.1 Å, one can observe the lines that may be due to the transitions in so-called hollow ions of magnesium, i.e. the ions with unfilled inner shells. Moreover, in the hard region of 2 Å - 6 Å, the spectrum is quite different from the Maxwellian one.
REFERENCES
- D. T. Attwood, L. W. Coleman and M. J. Boyle, “Spatially and Temporally Resolved X-Ray Emission from Imploding Laser Fusion Targets,” Report UCRL-78434, 1976.
- M. N. Key and R. J. Hutcheson, “Spectroscopy of Laser Produced Plasmas,” Advances in Atomic and Molecular Physics, Vol. 16, 1980.
- N. G. Basov, Yu. A. Bykovskiĭ, A. V. Vinogradov, A. A. Galichiĭ, M. P. Kalashnikov, V. L. Kantsyrev, Yu. P. Kozyrev, M. Yu. Mazur, Yu. A. Mikhaĭlov, V. P. Puzyrev, A. V. Rode, G. V. Sklizkov and I. Ya. Frondzeĭ, Quantum Electronics, Vol. 12, 1982, p. 977. http://dx.doi.org/10.1070/QE1982v012n08ABEH005741
- M. C. Richardson, “X-Rays from Laser plasmas” Proceedings of SPIE, Vol. 831, 1988, pp. 150-153.
- J. Abdallah, I. Yu. Skobelev, A. Ya. Faenov, A. I. Magunov, T. A. Pikuz, F. Flora, S. Bollanti, P. DiLazzaro, T. Letardi, E. Burattini, A. Grilli, A. Reale, L. Palladino, G. Tomassetti, A. Scafati and L. Reale, Quantum Electronics, Vol. 30, 2000, p. 694. http://dx.doi.org/10.1070/QE2000v030n08ABEH001793
- S. I. Fedotov, L. P. Feoktistov, M. V. Osipov and A. N. Starodub, Journal of Russian Laser Research, Vol. 25, 2004, p. 79. http://dx.doi.org/10.1023/B:JORR.0000012486.89881.d8
- V. A. Burakov, B. L. Vasin, A. A. Kologrivov, M. V. Osipov, V. N. Puzyrev, A. N. Starodub, A. A. Fronya, M. L. Chernodub and O. F. Yakushev, “X-Ray Diagnostic Complex at the ‘KANAL-2’ Experimental Setup,” P N Lebedev Physical Institute RAS, Preprint No 3, Moscow, 2012. (in Russian)
- I. Yu. Skobelev, A. Ya. Faenov, B. A. Bryunetkin, V. M. Dyakin, T. A. Pikuz, S. A. Pikuz, T. A. Shelkovenko, V. M. Romanova and A. R. Mingaleev, Journal of Experimental and Theoretical Physics, Vol. 81, 1995, p. 692.
- А. А. Коlogrivov, G. V. Sklizkov and A. S. Shikanov, “Reconstruction of a CW X-Ray Laser Plasma Spectrum from the Attenuation Curves,” P N Lebedev Physical Institute RAS, Preprint No 142, Moscow, 1981. (in Russian)
- E. L. Kosarev, Computer Physics Communications, Vol. 20, 1980, p. 69. http://dx.doi.org/10.1016/0010-4655(80)90110-1
- L. P. Presnyakov, Soviet Physics Uspekhi, Vol. 19, 1976, pp. 387-399. http://dx.doi.org/10.1070/PU1976v019n05ABEH005259
- I. Yu. Skobelev, A. Ya. Faenov and T. A. Pikuz, “The Spectra of Multi-Charged Hollow Ions in the X-Ray Emission of Hyper-Dense Laser Plasma,” Proceedings of the VIIth Russian Conference on Up-to-Date Methods for Plasma Diagnostics and Their Application in Matter and Environment Control, Moscow, 2010, p. 131. (in Russian)
- R. L. Kelly, “Atomic and Ionic Spectrum Lines below 2000 Angstroms,” Report No ORNL-5922, 1982.
- А. А. Коlogrivov, A. M. Maksimchuk, Yu. A. Mikhailov, A. V. Rode, A. A. Rupasov, G. V. Sklizkov, S. I. Fedotov, V. V. Frolov and A. S. Shikanov, Plasma Physics, Vol. 13, 1987, p. 826. (in Russian)
- O. B. Anan’in, Yu. V. Afanasiev, Yu. A. Bykovsky and O. N. Krokhin, “Laser Plasma. Physics and Applications,” Мoscow, 2003. (in Russian)
- M. A. Blokhin and I. G. Shveitser, “X-Ray Handbook” Мoscow, 1982. (in Russian)
- H. R. Griem, “Plasma Spectroscopy,” New York, 1964.
- R. W. P. McWhirter, “Spectral Intensities,” In: R. H. Huddlestone and S. L. Leonard Eds., Plasma Diagnostic Techniques, Academic Press, New York, 1965.


