Applied Mathematics
Vol.4 No.11C(2013), Article ID:38694,5 pages DOI:10.4236/am.2013.411A3004
The Relative Biologic Effectiveness versus Linear Energy Transfer Curve as a Cell Trait
1Department of Radiation Oncology, Stanford University, Stanford, USA
2Department of Mathematics, Colorado State University, Fort Collins, USA
Email: qluu@stanford.edu, pauld@math.colostate.edu
Copyright © 2013 Quoc T. Luu, Paul Du Chateau. This is an open access article distributed under the Creative Commons Attribution License, which permits unrestricted use, distribution, and reproduction in any medium, provided the original work is properly cited.
Received August 20, 2013; revised September 20, 2013; accepted September 27, 2013
Keywords: RBE-LET Curve; Cell Trait; Systems Biology; Fourier Analysis; Stochastic Differential Equation
ABSTRACT
The magnitude of biological response varies with different radiation types. Using Linear Energy Transfer (LET) to differentiate types of incident radiation beam, the Relative Biologic Effectiveness (RBE) as a function of LET (RBE-LET) was found to have a characteristic shape with a peak around LET values 100 - 200 eV/nm. This general feature is believed to be a property of the incident beam. Our systems engineering model, however, suggests that the shape of the RBE-LET curve is a cell trait, a property of the cell. Like any other trait, phenotypic variations result from interactions of the genes and their context. State-space block diagram of the differential equation model suggests the genes are those in the DNA double strand break (dsb) repair pathway; and the context is cellular stress responsing to DNA damage by both external stimuli and internal redox state. At a deeper level, the block diagram suggests cell using mathematical calculations in its decision-making when facing a stress signal. The MRN protein complex, in particular, may perform addition to count the degree of DNA twisting for the homeostatic regulation of DNA supercoiling. The ATM protein may act as a feedback amplifier.
1. Introduction
Textbook of radiation biology such as [1] explains the RBE-LET curve in terms of the spacing of energy deposition near DNA diameter. Most effective DNA damage occurs when energy is deposited to break both DNA strands. Energy deposition densities below this critical value would cause single strand break, which is easily repaired. Energy deposition densities above this critical value would simply be over-killed and wasted. So the effectiveness of the radiation would be decreased. Attempts to measure DNA dsb as a function of LET, however, failed to show an optimal LET value [2].
Another model based on microdosimetry explains the RBE-LET curve in relation to the “clustered damage site”. Microdosimetry is the study of how radiation field interacts with detector in the size range of living cells. The discrete nature of the energy transfer in microscopic volume requires quantitative description with random variables, whose probability distributed and associated means and variance. Microdosimetry, however, utilizes cluster analysis, a statistical method for pattern recognition that is more appropriate in the exploratory phase of data analysis [3]. A pattern found by cluster analysis should be validated. Instead, a pattern found along radiation track has been taken as final and without subjecting to further validation.
In addition, the biochemical steps between the initial DNA damage and the final phenotype are largely ignored in these models. These inadequacies, along with the growing body of knowledge on the molecular biology of the radiation response, call for a new direction in radiobiological modeling, one which acknowledges the cell’s active response to external stress such as irradiation.
2. Methods & Results
Recently, we reported a model based on control systems engineering concepts [4]. This model sees cells as system, different types of radiation as input, and cellular response as output (Figure 1).
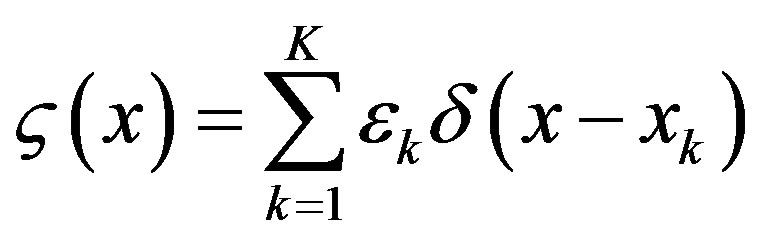
An incident particle interacts with the detector, in this case, a living cell, at discrete transfer points. For K transfer points in a cell of length L, and uniformly-distributed
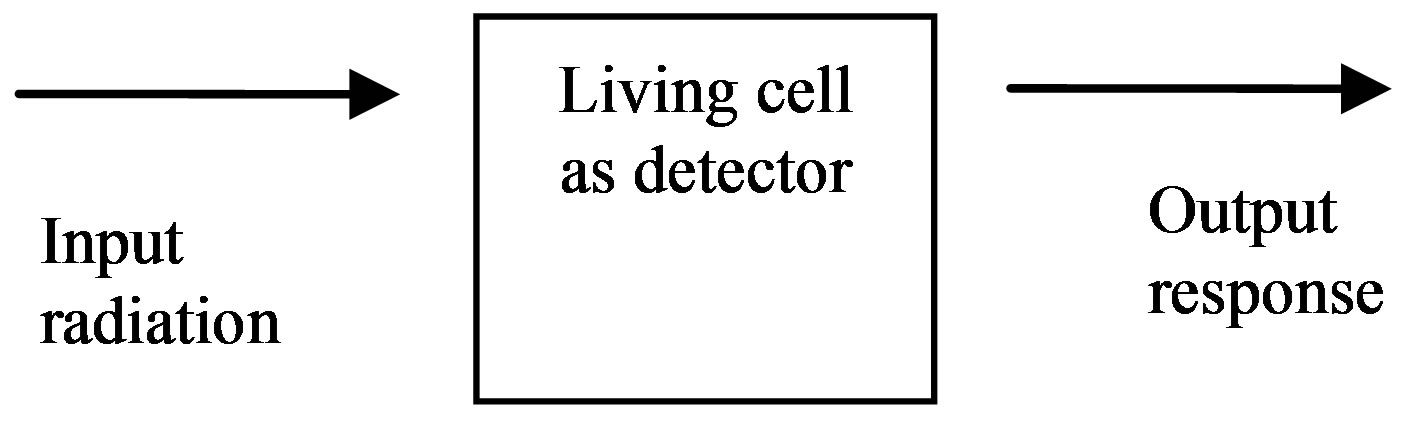
Figure 1. Conceptual block diagram of the systems engineering model.
transfer point xk, the energy transfer pattern  is represented as a series of random delta pulse trains
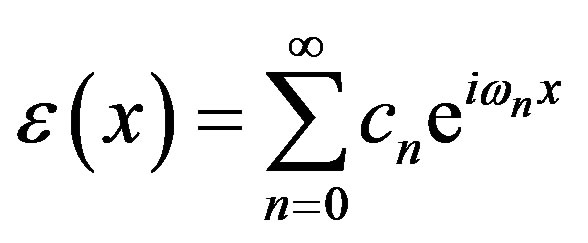
Its Fourier representation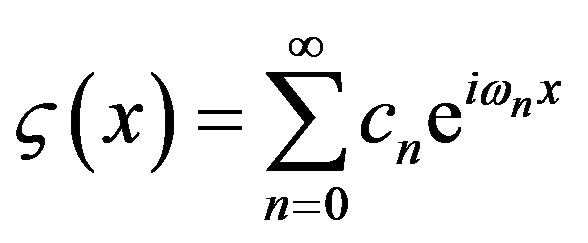 , where
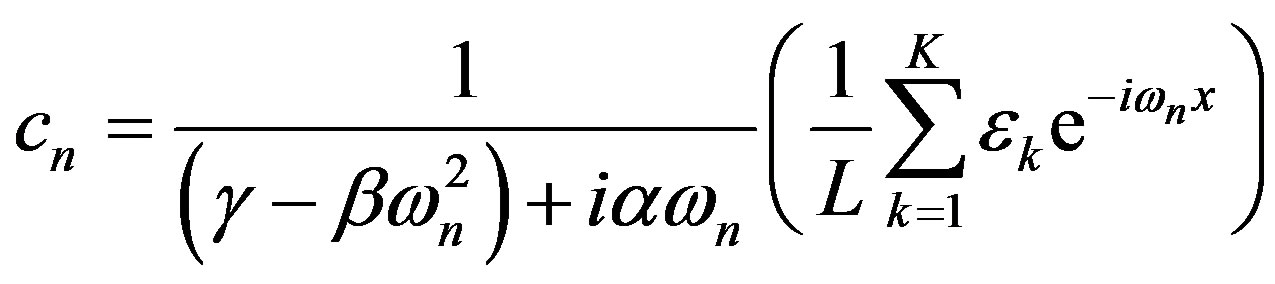
 , has Fourier coefficients
For a given radiobiological experiment, not one but an ensemble of incident particles bombard a detector. Given the Fourier coefficients, we can compute the means and variance of such an ergodic ensemble [5]. The means is the first Fourier coefficient. We should emphasize that the Fourier coefficient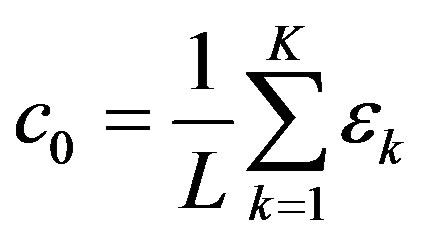 , like LET, gives no information on the spacing of energy transfer. LET becomes a useful description of spacing of energy transfer only when used with the assumption that there is a certain amount of energy transfer per interaction. An example was given in the textbook [1]: assuming an energy transfer per interaction of 60 eV, an α-particle with LET 120 eV/nm would have an average spacing of 120 eV/60 eVnm = 2/nm. In this way, LET and
  both measure the spacing (i.e., spatial frequency) of energy transfer. With suitable averaging, the variance is given by the power spectrum
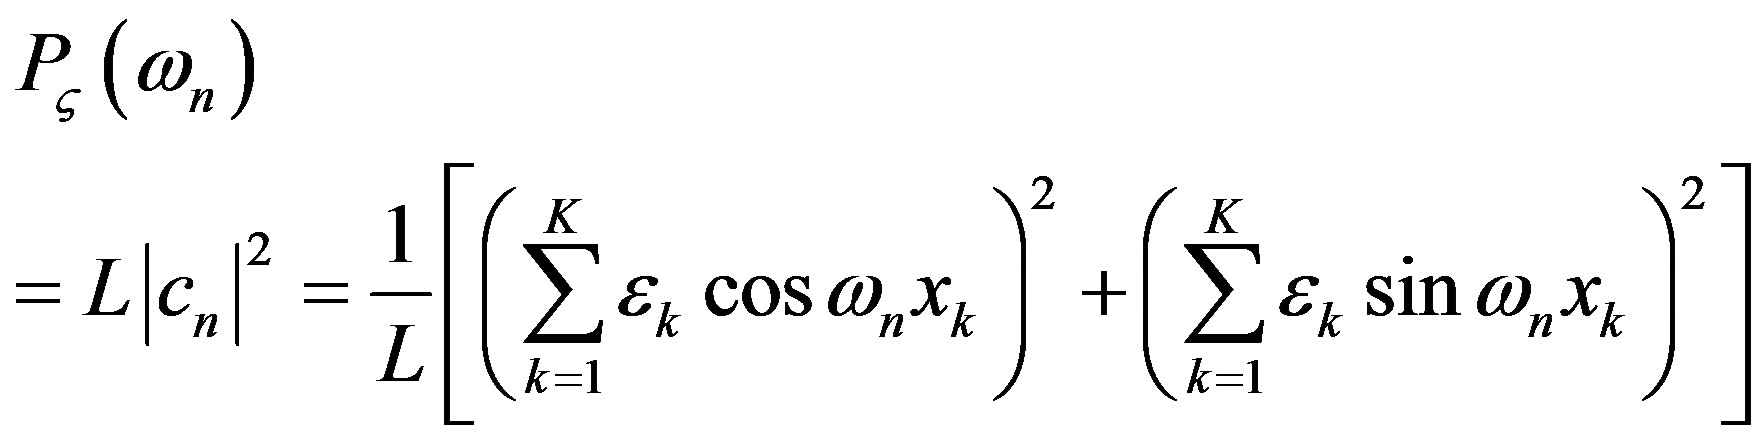
Information on the discrete spacing of energy transfer is contained in the variance spectrum, which measure the amount of energy in the random pulse train. We have reported the variance spectrum of a 14 MeV α-particle to show no clustering along its track [5].
To derive the output response, we consider the nature of the detector, in this case, a living cell. We assume the detector response to be proportional to the detector’s energy state ( ). In our model, the random pulse train input drives the perturbation of the cell’s spatial energy state
 , according to a 2nd order ordinary differential equation
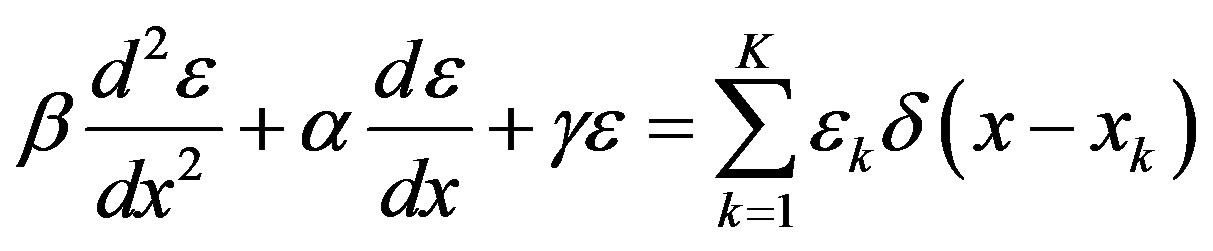
In this equation, the parameter β represents molecular DNA dsb repair; α represents antioxidant response; γ relates to radiolysis of cellular water. This model, while incomplete, is a start to acknowledge the active biochemical steps between the initial lesion and final phenotypic outcome.
The solution  has Fourier representation
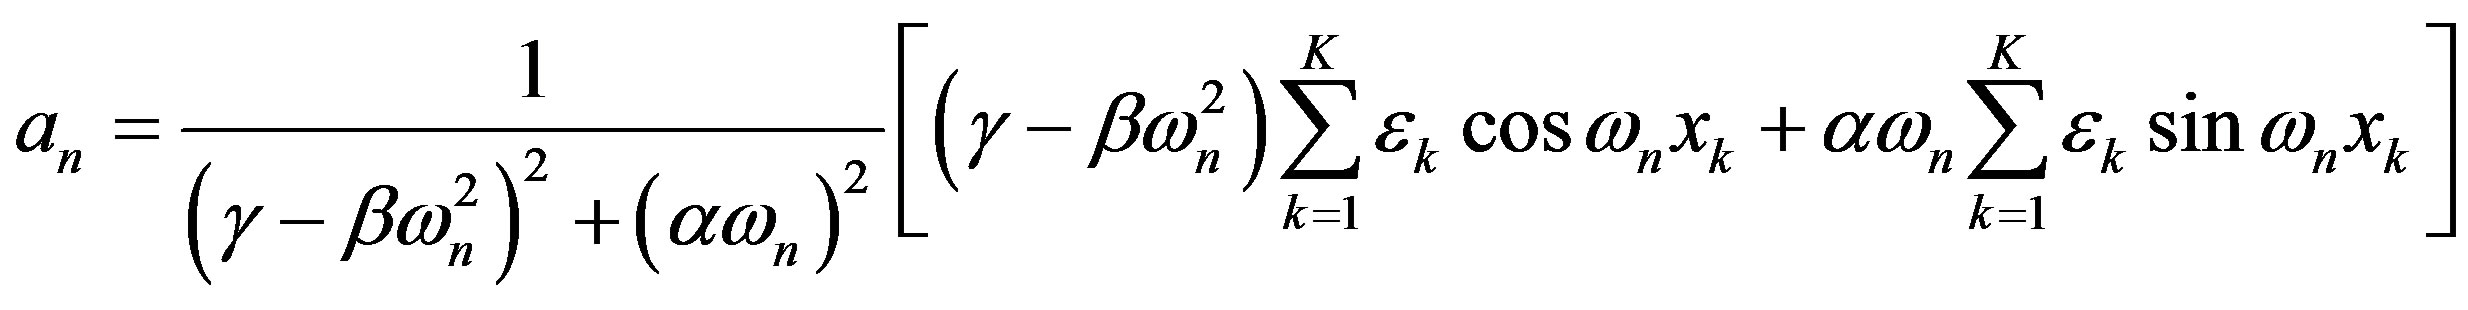
The real and imaginary parts of the Fourier coefficient cn are
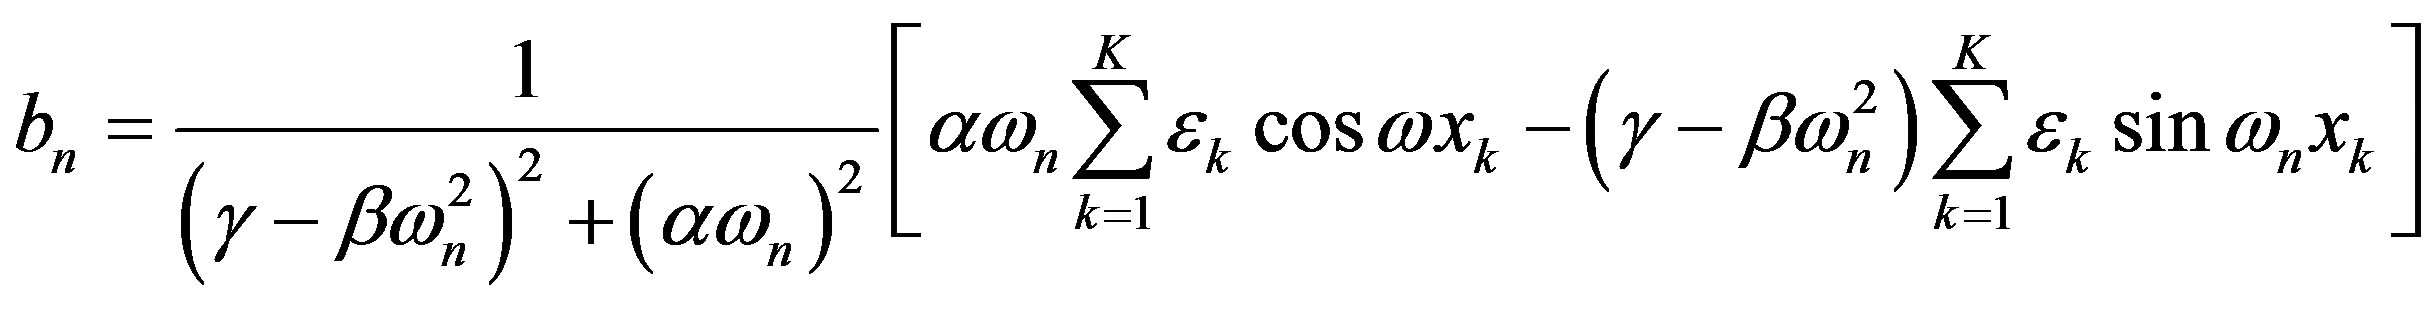
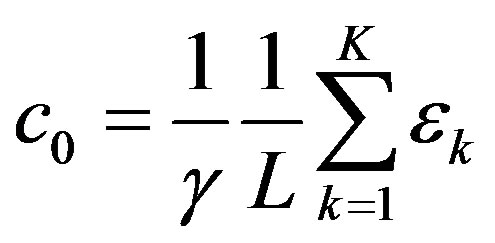
To explain human-scale experimental data, we need to compute the macroscopic response from this microscopic model. Here, we improve on a previous model [4], by consistently applying the same Fourier technique to both the input and output. The means of the output response is the first Fourier coefficient
This result was used to explain the measurable difference in the magnitude of biological response when two different radiation types of the same LET are used [5].
With suitable averaging, variance power spectrum is given by
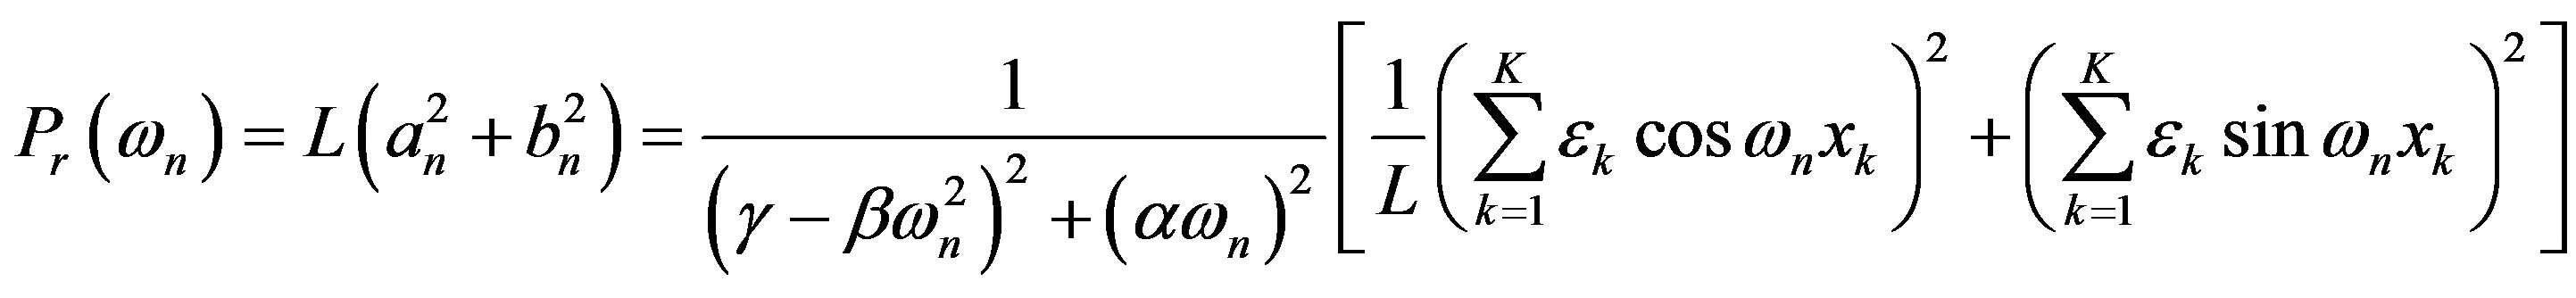
The output response in terms of the input is
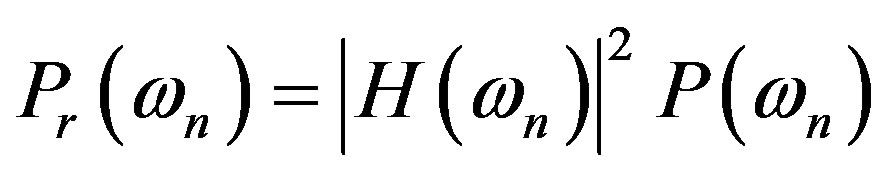
With the detector response defined as
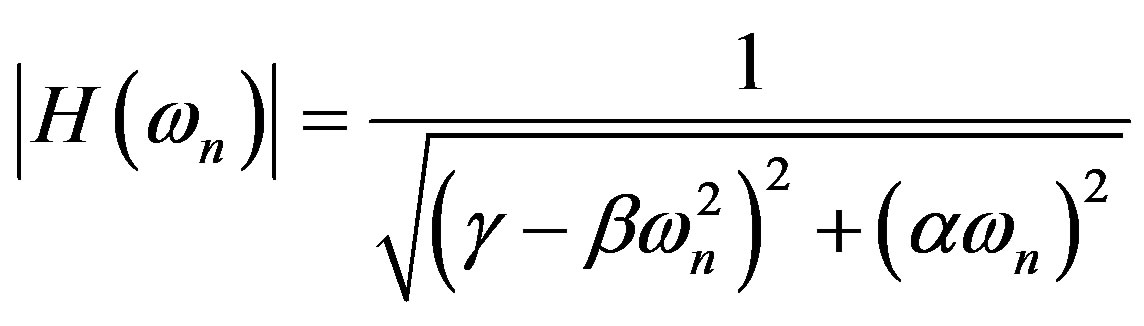
If we also assume negligible cells’ collective interaction, parameters in the detector response  can be found to fit experimental RBE-LET data [4].
The result here indicates that the RBE-LET curve is a property of the cell and not a property of the incident beam, as suggested by the name, Relative Biologic Effectiveness itself. Biologically speaking, this property is a cell trait. Like any trait, such as eye color, the RBELET shapes should correspond to various phenotypes, depending on the genes and environment of gene expression. To elucidate the genes and their environment, we trace the state-space block diagram (Figure 2) for the 2nd order ordinary differential equation model.
The diagram suggests that DNA dsb repair genes underlie the RBE-LET trait. DNA dsb repair consists of two main pathways. The physiological, replication-associated DNA dsb is repaired by homologous recombination of sister chromatid. On the other hand, non-homologous end-joining repair pathway responds to pathological DNA dsb, such as those damages due to irradiation. From this viewpoint, genetic mutation in the non-homologous end-joining repair pathway should give rise to variations of the RBE-LET phenotype. Indeed, experiments with gene mutations of this pathway, such as ATM, Ku76, Ku80, DNA-PK, and ligase IV, demonstrated a flattened RBE-LET curve compared to the phenotype of the normal cell strains [6-11] (Figure 3).
The summing junction in the block diagram suggests that the triggers for DNA dsb repair response include environmental factors both external and internal to cell. Beside external stress with ionizing radiation, endogenous sources of DNA damage depend on the redox state. The degree of oxidative stress is determined by the balance between antioxidant defense and reactive oxygen species production from both hydrolysis and metabolism by various enzymes in mitochondria and other organelles. The model predicts that changes in these endogenous factors should change the phenotypic shape of the RBE-LET curve. Indeed, experimental data found consistent RBELET phenotypic variations for cells in different degrees of oxidative stress [12-16]. In addition, a phenotype with a right-shift of the RBE peak was found corresponding to a greater recombination of radiolytic free radicals generated by high LET radiations [17], as predicted by the model.
At a deeper level, the block diagram suggests that the cell behaves like an analog computing device that represents model the differential equation. When faced with damage signals, cell decision-making closely mimics performing mathematical operations. Analogy to the manmade devices hints at the design principles underlying cell decision-making. In Table 1, we list some analogous elements for various analog devices.
In the history of computing, mechanical and electronic analog devices were engineered to solve differential equations. The component of these machines can be grouped roughly into two categories: components that perform mathematical operation and components that interconnect between the computational units. Components of the second kind are usually feedback amplifiers.
To explore the possibility of a biochemical component that performs mathematical operation, we trace the block diagram to the summing junction, where external and internal stress signals converge. It corresponds to the initial DNA damage. The detail of how the cell detects DNA damage is incomplete, but the MRN protein complex appears to be a first responder. This protein complex has a subunit, Rad50, with sequence homology and unique 3D coiled coil shape of the SMC protein class [18]. The SMC proteins can induce positive supercoils into DNA and thus, plays a central role in maintenance of DNA topology during major genetic processes such as replication and recombination [19]. Other genetic processes in which DNA topology is altered include telomere length regulation and DNA repair. Both of these processes require the presence of the MRN protein complex [20]. Furthermore, a counting mechanism was proposed for telomere length regulation [21]. Base on these considerations, we propose that the MRN protein complex has a counting mechanism for the homeostatic control of DNA supercoiling. Single-molecule technique such as a magnetic tweezer may be used to study the proposed mechanism.
An interconnecting elements suggested by the block diagram may be found by studying the ATM protein. This protein autophosphorylates rapidly and amplify the small DNA dsb signal. A mathematical model has been
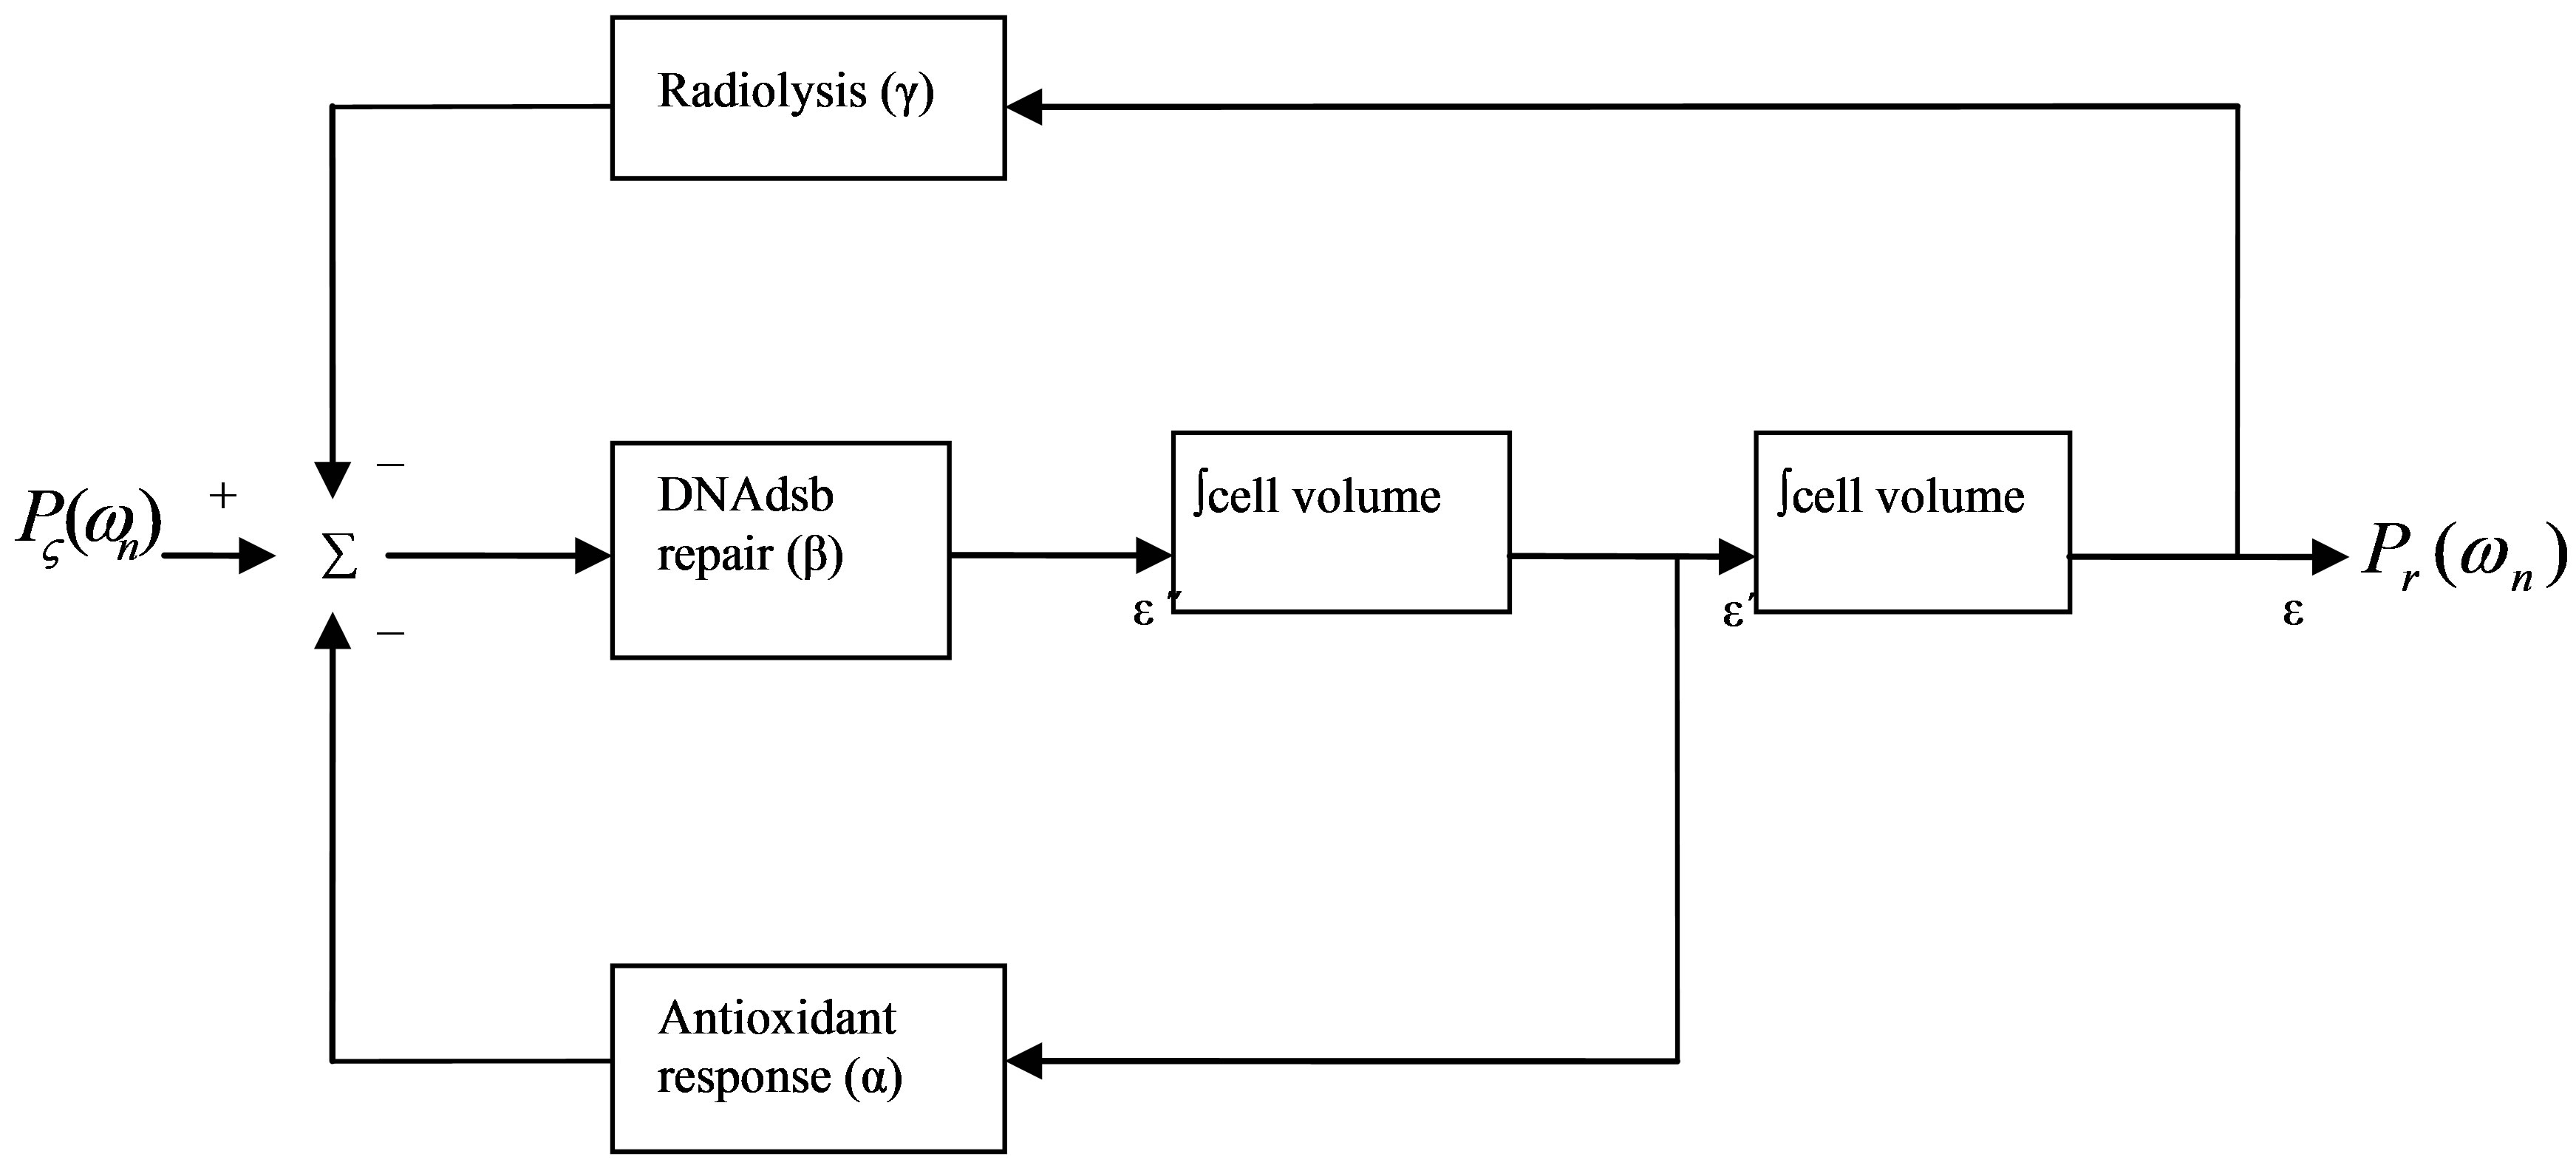
Figure 2. Cell components involved in DNA damage response.
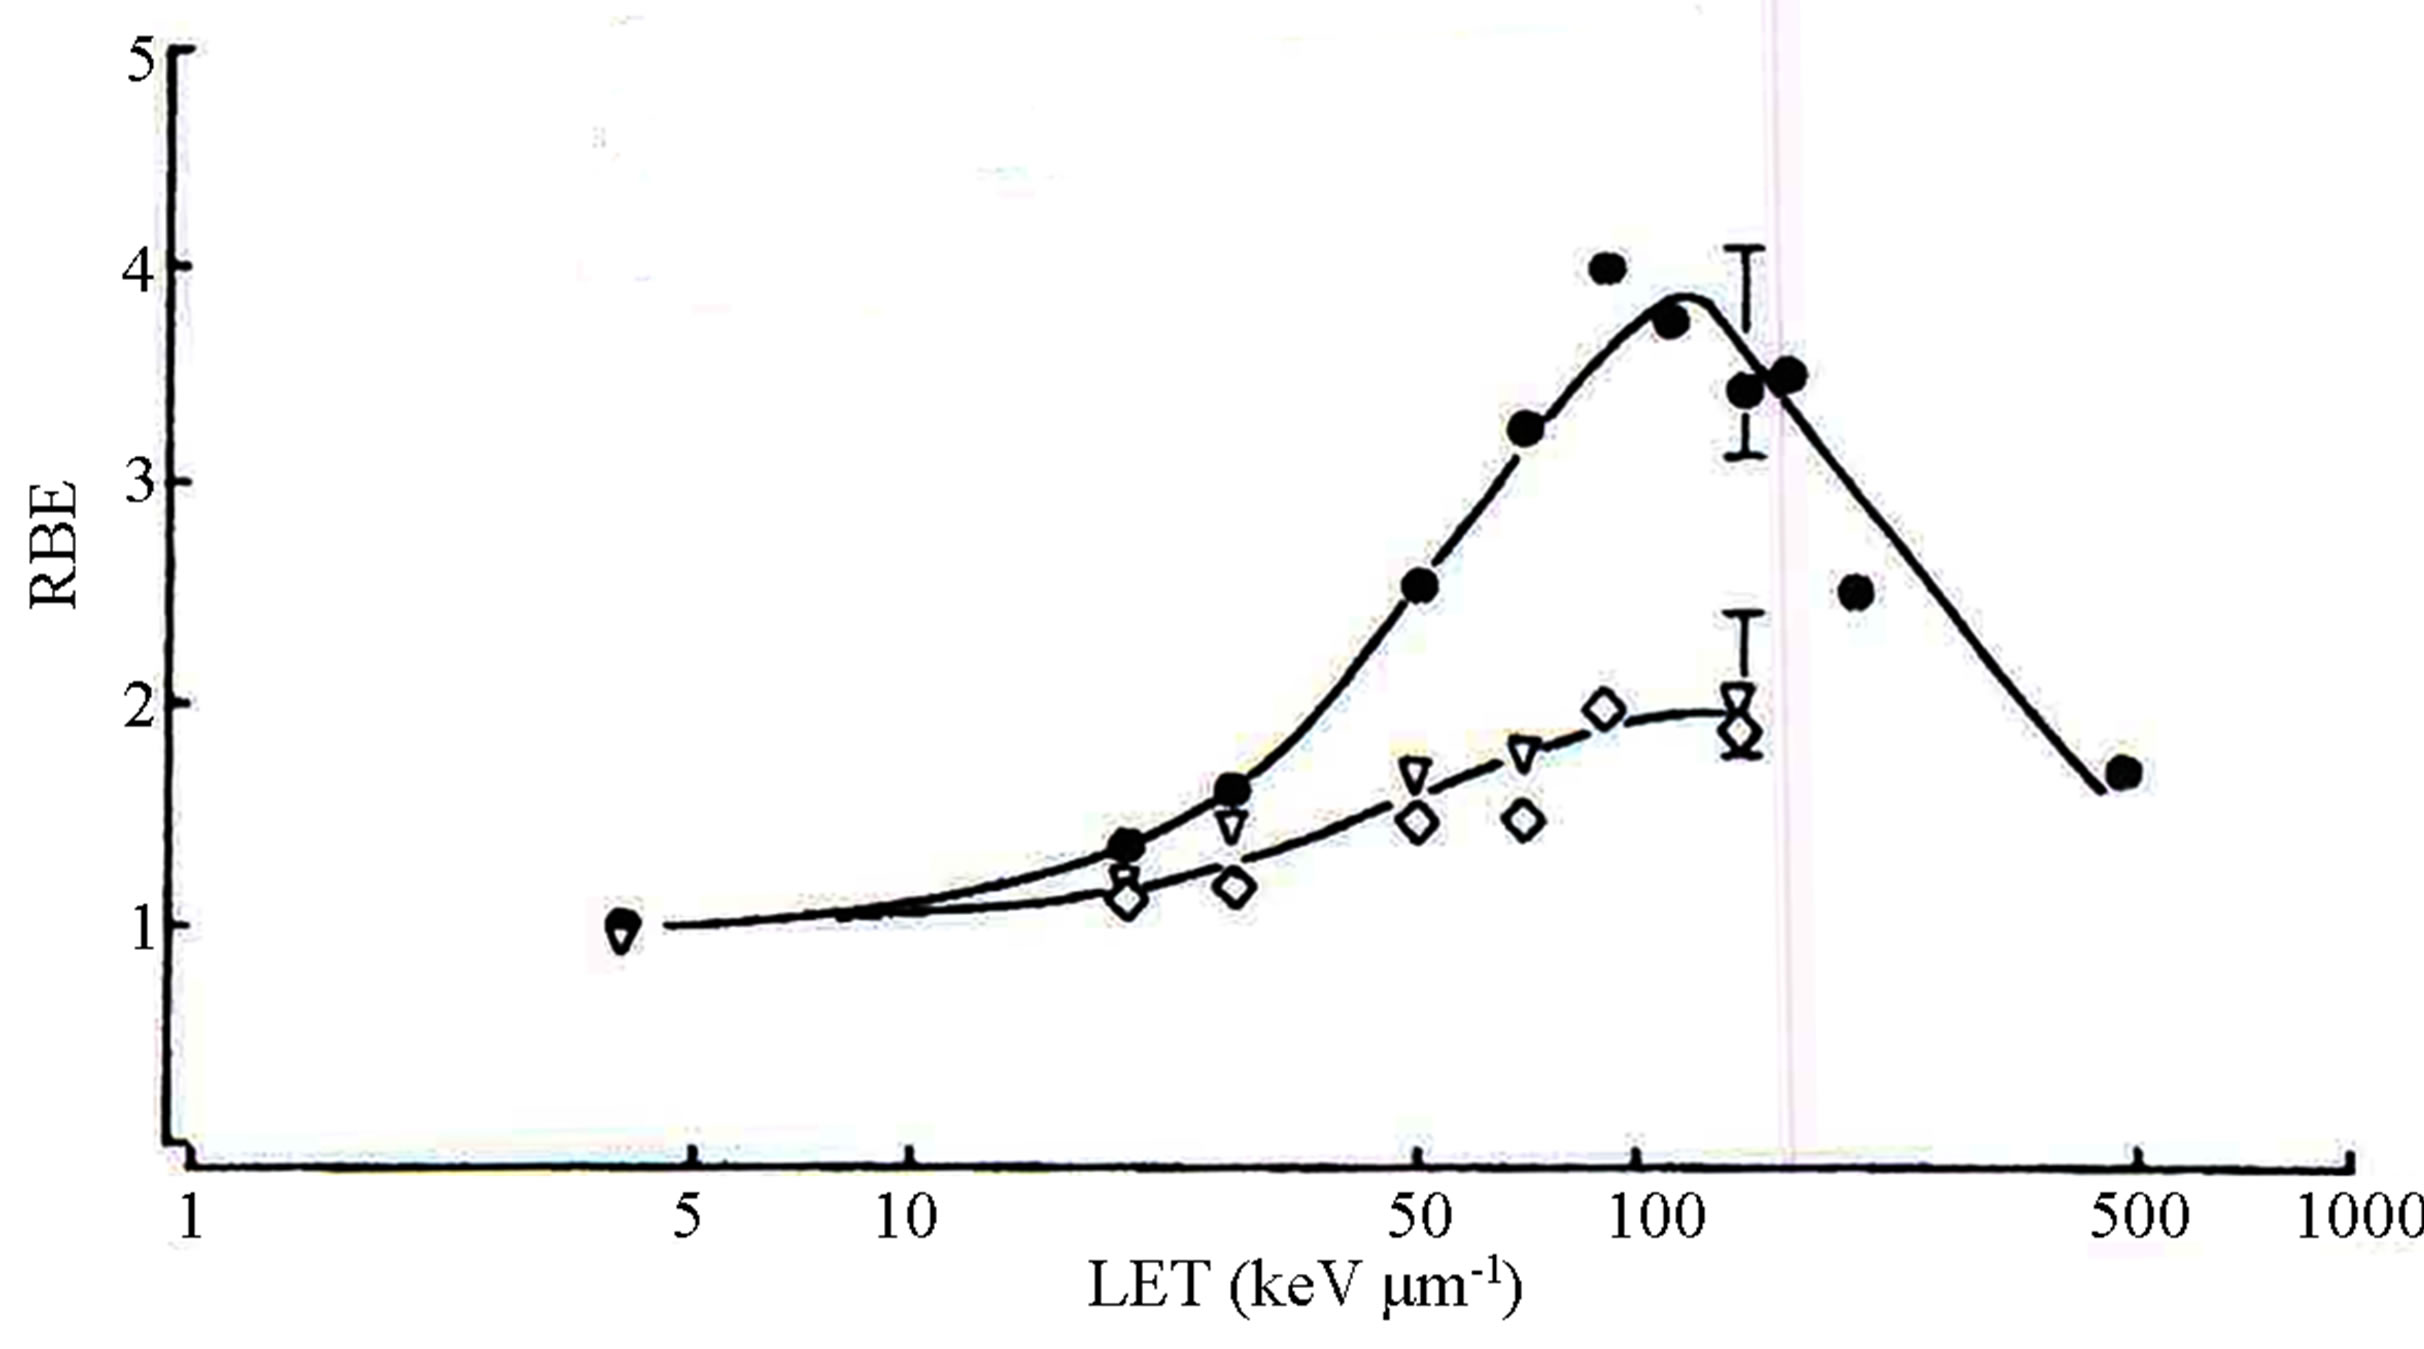
Figure 3. Two phenotypes of normal cells (closed) and ATM mutants(open) (taken from [6]).
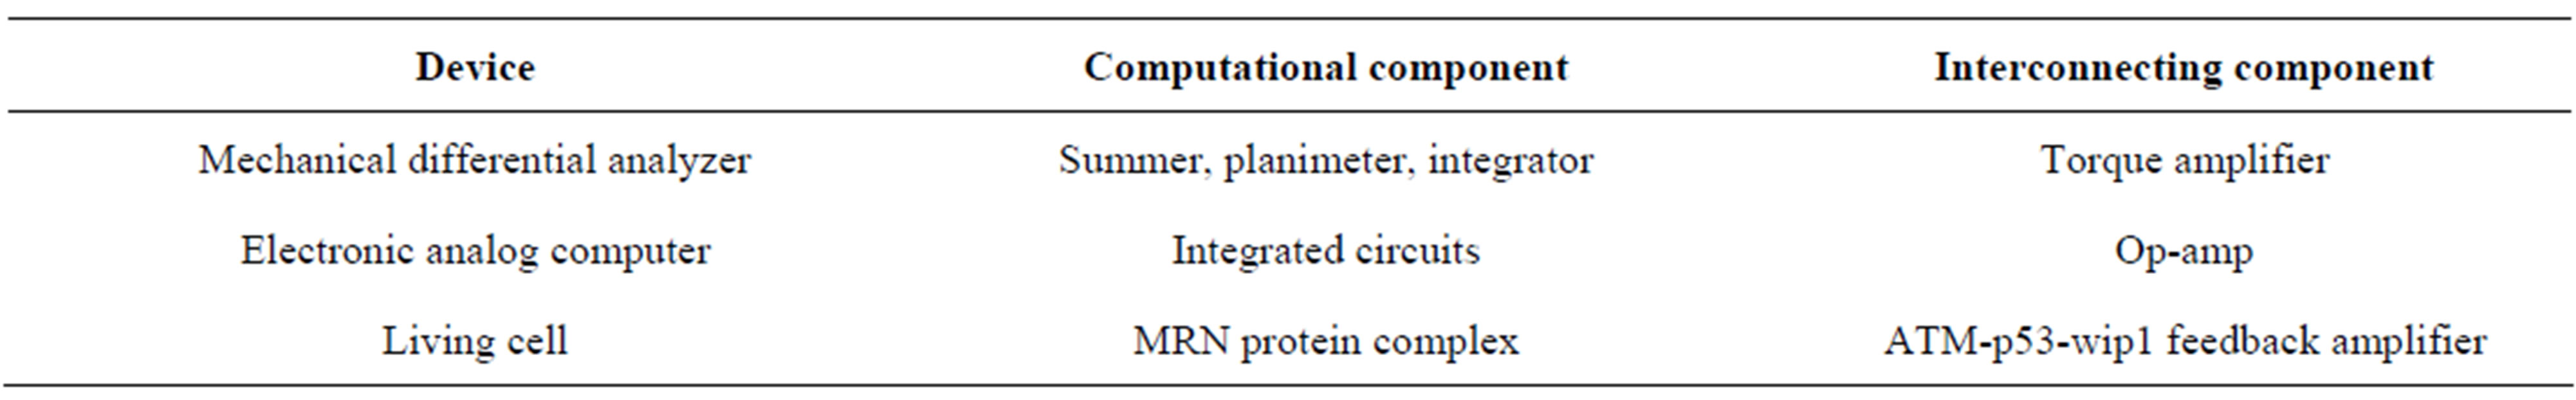
Table 1. Analogous components of cell and man-made devices.
proposed for the ATM protein acting as an amplifier [22]. Moreover, the ATM-p53-wip1 network has a feedback loop [23]. Therefore, this network may behave as a feedback amplifier. The characteristics of an engineered feedback amplifier, such as robustness to internal and external perturbation, low output impedance, and enhancement of signal-to-noise ratio, could be tested.
3. Conclusion
In summary, control systems engineering approach shows that the RBE-LET curve is a cell trait. Block diagram analysis of the underlying genotype and context for this trait suggests cell making decision by performing mathematical operations.
REFERENCES
- E. L. Alpen, “Radiation Biophysics,” Prentice-Hall, Inc., Englewood Cliffs, 1990.
- K. M. Prise, G. Ahnstrom, M. Belli, J. Carlsson, D. Frankenberg, J. Kiefer, M. Lobrich, B. D. Michael, J. Nygren, G. Simone and B. Stenerlow, “A Review of dsb Induction Data for Varying Quality Radiations,” International Journal of Radiation Biology, Vol. 74, 1998, pp. 173-184.
- B. Everitt, S. Landau and M. Leese, “Cluster Analysis,” 4th Edition, Arnold Publishers, London, 2001.
- Q. T. Luu and P. DuChateau, “The Relative Biologic Effectiveness versus Linear Energy Transfer Curve as an Output-Input Relation for Linear Cellular System,” Mathematical Biosciences and Engineering, Vol. 6, 2009, pp. 591-602.
- Q. T. Luu, P. DuChateau and M. Dingfelder, “Fourier Analysis of Energy Transfer Data Obtained by Simulating 14- MeV α-Particle in Water,” Nuclear Instruments and Methods in Physics Research Section B, Vol. 268, 2010, pp. 219-222.
- R. Cox, “A Cellular Description of the Repair Defect in Ataxia-Telangiectasia,” In: D. G. Harnden, Ed., Ataxia Telangiectasia: A Cellular and Molecular Link between Cancer, Neuropathology, and Immune Deficiency, John Wiley and Sons, 1982, pp. 141-153.
- C. Lucke-Huhle, “Similarities between Human Ataxia Fibroblasts and Murine SCID Cells: High Sensitivity to - Rays and High Frequency of Methotrexate-Induced ZDHFR Gene Amplification, but Normal Radiosensitivity to Densely Ionizing α-Particles,” Radiation and Environmental Biophysics, Vol. 33, 1994, pp. 201-210.
- H. Nagasawa, J. B. Little, W. C. Inkret, M. Carpenter, R. Raju, D. Chen and G. F. Strniste, “Response of X-Ray Sensitive CHO Mutant Cells (xrs-6c) to Radiation,” Radiation Research, Vol. 126, 1991, pp. 280-288.
- R. Okayasu, M. Okada, A. Okabe, M. Noguchi, K. Takakura and S. Takahashi, “Repair of DNA Damage Induced by Accelerated Heavy Ions in Mammalian Cells Proficient and Deficient in the Non-Homologous End-Joining Pathway,” Radiation Research, Vol. 165, 2006, pp. 59- 67.
- C. A. Tobias, E. A. Blakely, P. Y. Chang, L. Lommel and R. Root, “Response of Sensitive Human Ataxia and Resistant T-1 Cell Lines to Accelerated Heavy Ions,” British Journal of Cancer, Vol. 49, 1984, pp. 175-185.
- W. K. Weyrather, R. Ritter, M. Scholz and G. Kraft, “RBE for Carbon Track Segment Irradiation in Cell Lines of Differing Repair Capacity,” International Journal of Radiation Biology, Vol. 75, 1999, pp. 1357-1364.
- G. W. Barendsen, “The Relationships between RBE and LET for Different Types of Lethal Damage in Mammalian Cells: Biophysical and Molecular Mechanism,” Radiation Research, Vol. 139, 1994, pp. 257-270.
- E. A. Blakely, C. A. Tobias, T. C. H. Yang, K. C. Smith and J. T. Lyman, “Inactivation of Human Kidney Cells by High-Energy Monoenergetic Heavy-Ion Beams,” Radiation Research Vol. 80, 1979, pp. 122-160.
- R. A. Britten, H. M. Warenius, R. White, P. J. Browning and J. A. Green, “Melphalan Resistant Human Ovarian Tumor Cells Are Cross-Resistant to Photons, but Not to High LET Neutrons,” Radiotherapy and Oncology, Vol. 18, 1990, pp. 357-363.
- J. D. Chapman, S. Doern, A. P. Reuvers, C. J. Gillespie, A. Chatterjee, E. A. Blakely, K. C. Smith and C. A. Tobias, “Radioprotection by DMSO of Mammalian Cells Exposed to X-Ray and to Heavy Charged-Particle Beams,” Radiation and Environmental Biophysics, Vol. 16, 1979, pp. 29-41.
- P. Todd, “Heavy-Ion Irradiation of Cultured Human Cells,” Radiation Research, Vol. S7, 1967, pp. 196-207.
- G. Kraft, “Radiobiological Effects of Very Heavy Ions: Inactivation, Induction of Chromosome Aberrations and Strand Breaks,” Nuclear Sciences and Applications, Vol. 3, 1987, pp. 1-28.
- E. Kinoshita, E. van der Linden, H. Sanchez and C. Wyman, “Rad50, an SMC Family Member with Multiple Roles in DNA Break Repair: How Does ATP Affect Function?” Chromosome Research, Vol. 17, 2009, pp. 277-288.
- K. Kimura and T. Hirano, “ATP-Dependent Positive Supercoiling of DNA by 13S Condensin: A Biochemical Implication for Chromosome Condensation,” Cell, Vol. 90, 1997, pp. 625-634.
- Y. Wu, S. Xiao and X. D. Zhu, “Mre11-Rad50-Nbs1 and ATM Function as Co-Mediators of TRF1 in Telomere Length Control,” Nature Structural & Molecular Biology, Vol. 14, 2007, pp. 832-840.
- S. Marcand, E. Gilson and D. Shore, “A Protein-Counting Mechanism for Telomere Length Regulation in Yeast,” Science, Vol. 275, 1997, pp. 986-990.
- K. Mouri, J. C. Nacher and T. Akutsu, “A Mathematical Model for the Detection Mechanism of DNA Double Strand Breaks Depending on Autophosphorylation of ATM,” PloS One, Vol. 4, 2009, Article ID: e5131.
- S. Shreeram, O. N. Demidov, W. K. Hee, H. Yamaguchi, N. Onishi, C. Kek, O. N. Timofeev, C. Dudgeon, A. J. Fornace, C. W. Anderson, Y. Minami, E. Appella and D. V. Bulavin, “Wip1 Phosphatase Modules ATM-Dependent Signaling Pathways,” Molecular Cell, Vol. 23, 2006, pp. 757-764.