Applied Mathematics
Vol.4 No.10B(2013), Article ID:37457,17 pages DOI:10.4236/am.2013.410A2004
The “3 Genomic Numbers” Discovery: How Our Genome Single-Stranded DNA Sequence Is “Self-Designed” as a Numerical Whole
IBM Emeritus, Bordeaux, France
Email: jeanclaudeperez2@gmail.com
Copyright © 2013 Jean-Claude Perez. This is an open access article distributed under the Creative Commons Attribution License, which permits unrestricted use, distribution, and reproduction in any medium, provided the original work is properly cited.
Received May 22, 2013; revised June 22, 2013; accepted June 28, 2013
Keywords: Genetic Code; Codon Populations; Junk DNA; Cancer Genomics Chromosomal Translocations; Genomes Diversity; Chromosomes Diversity; Whole Human Genome DNA Sequence; “Phi” the Golden Ratio; Fibonacci Numbers; Information Theory; Symmetry; Cellular Automata; Chargaff’s Codon Level Symmetry Principle; Fractal Self-Similarity; “e” Euler’s Number; “Pi”; form and Substance; Redundancy; Encryption
ABSTRACT
This article proves the existence of a hyper-precise global numerical meta-architecture unifying, structuring, binding and controlling the billion triplet codons constituting the sequence of single-stranded DNA of the entire human genome. Beyond the evolution and erratic mutations like transposons within the genome, it’s as if the memory of a fossil genome with multiple symmetries persists. This recalls the “intermingling” of information characterizing the fractal universe of chaos theory. The result leads to a balanced and perfect tuning between the masses of the two strands of the huge DNA molecule that constitute our genome. We show here how codon populations forming the single-stranded DNA sequences can constitute a critical approach to the understanding of junk DNA function. Then, we suggest revisiting certain methods published in our 2009 book “Codex Biogenesis”. In fact, we demonstrate here how the universal genetic code table is a powerful analytical filter to characterize single-stranded DNA sequences constituting chromosomes and genomes. We can then show that any genomic DNA sequence is featured by three numbers, which characterize it and its 64 codon populations with correlations greater than 99%. The number “1” is common to all sequences, expressing the second law of Chargaff. The other 2 numbers are related to each specific DNA sequence case characterizing life species. For example, the entire human genome is characterized by three remarkable numbers 1, 2, and Phi = 1.618 the golden ratio. Associated with each of these three numbers, we can match three axes of symmetry, then “imagine” a kind of hyperspace formed by these codon populations. Then we revisit the value (3-Phi)/2 which is probably universal and common to both the scale of quarks and atomic levels, balancing and tuning the whole human genome codon population. Finally, we demonstrate a new kind of duality between “form and substance” overlapping the whole human genome: we will show that—simultaneously with the duality between genes and junk DNA—there is a second layer of embedded hidden structure overlapping all the DNA of the whole human genome, dividing it into a second type of duality information/redundancy involving golden ratio proportions.
1. Introduction
“The beginning (1) is the middle (2) of the whole (Phi).” Here is my interpretation of this famous sentence from Pythagoras [#]. In line with the last Sergey Petoukhov paper published in Symmetrion [1], we show here how codon populations forming the single-stranded DNA sequences can constitute a critical approach to the understanding of junk DNAfunction. Having devoted an entire book “Codex Bio-genesis” [2]—a French edition—to the analysis of single-stranded DNA codon populations of the entire human genome [3], after improving various methods of analysis, it seemed interesting to revisit a subset of these methods. The reader will find a summary of these methods in [4], and in [5] particularly.
Indeed, the focus of this article will be based on the study of the diversity of genomes and chromosomes by analyzing them across codon populations. For this, we consider comprehensively the single stranded DNA sequences forming chromosomes and genomes.
Until now, the genomic diversity has been studied on other genetic scales, most often analyzing the variability:
-At the genes level.
-Then across the respective proportions of nucleotides TCAG based from Chargaff’s second law, we recall here the following statement: The second parity rule holds that both %A ~ %T and %G ~ %C are valid for each of the two DNA strands. This describes only a global feature of the base composition in a single DNA strand [6].
-Among other approaches, we can mention for example the original research of Professor Giorgio Bernardi on “isochores” [7,8].
-Presently, human genome variability is considered from the SNP populations variability analysis (“1000 genomes project” [9]). On this subject, we should also mention the “Stanford Human Genome Diversity Project”, [10] and also [11].
-Finally, we mention some other original research as “the Z curve” approaches: The Z curve is one of such tools available for visualizing genomes. The Z curve is a unique three-dimensional curve representation for a given DNA sequence in the sense that each can be uniquely reconstructed given the other [12].
The benefits resulting from a chromosome and genome level codon analysis will be amazing as well as significant:
1) Junk DNA and DNA strands atomic mass tuning: Obviously, our paper will reveal the strong utility of unknown junk DNA function. We show that this role most likely contributes to the fine tuning of the atomic masses of the huge double-stranded DNA molecule.
2) Universal genetic code table “lens” and “matrix”: Second, everyone knows that the main function of the universal genetic code table is the correspondence between the 64 codons of DNA and RNA, on the one hand, and the 20 possible amino acids, on the other hand. Yet, as demonstrated by our 2010 paper [13] and then by Professor Petoukhov’s research [1], we will demonstrate throughout this article a second function, equally important: Its role as a “filter” or “matrix” which determines the relative proportions of each of the 64 codons in single stranded DNA sequences of chromosomes or genomes.
3) Numerical DNA constraints: Third, our results demonstrate that the relative proportions of codons in DNA are “forced”, constrained and controlled—one might even say “weighted” and “fine-tuned”—by laws of numerical mathematical nature, which is radically innovative.
4) The 3 genomic numbers species diversity: Fourth, the analysis of populations of codons obeys three numbers characterizing each specific chromosome or genome: “the 3 genomic numbers”. This law is universal.
5) Human genome and chromosome’s genomic numbers diversity: Fifth, the methods and results presented here are related simultaneously to both the scale of whole genomes with each chromosome individually considered. This again is a universal character of these laws. Particularly, it appeared, in the human genome case, this dual level of strong mathematical constraints led to remarkable genomic numbers across all 24 chromosomes as well as across the entire genome. This result is remarkable.
6) Some 3-D speculations: Sixth, we thought about possible potential conceptualizations and materializations of these billion codons of the human genome unfolding in three-dimensional mathematical spaces determined by the three genomic numbers values.
7) “Form and Substance”, “information and redundancy” in the human genome (Figure 1): Seventh, we will demonstrate that—simultaneously with the duality between genes and junk DNA—there is a second hidden level of structure sharing all the DNA of the human genome, dividing it into a second type of duality information/redundancy.
8) Another genomic number even stranger: Is (3-Phi)/2 a universal value? Finally, this tuning of the whole human genome adjusted on the outstanding value of (3-Phi)/2 leads us to the question of a possible universality of this number, well beyond genomics.
2. Symmetries and Numerical Structures of the Whole Human Genome
In his 2013 paper [1], Prof. Petoukhov computes whole human genome codon populations, illustrating his Symmetry Principle No 3. Then he provides evidence of Chargaff’s second rule at the scale of the whole human genome. Then he provides T <==> A and C <==> G symmetry operator. Meanwhile, in [2] chapter 6, and in [13], we demonstrate from the same data (S0 level in Petoukhov matrix genomics) the existence of 3 other singular whole human genome symmetries.
In this Figure 2 showing the 64 sorted codons frequencies, there is evidence of 3 facts:
-the first, as reported by Petoukhov in his paper, is the extended diversity range of these frequencies.
-the second strange fact is the perfect symmetry of codons which appear sorted by pairs.
-the third even stranger fact is a perfect symmetry of codons within each pair.
This twin codons curve will be very informative because it already contains the “trace” and the precursors of the 3 genomic numbers and their association with 3 axes of symmetry that we discover progressively throughout this paper.
Thus, apart from the first mirror symmetry (§2.2)
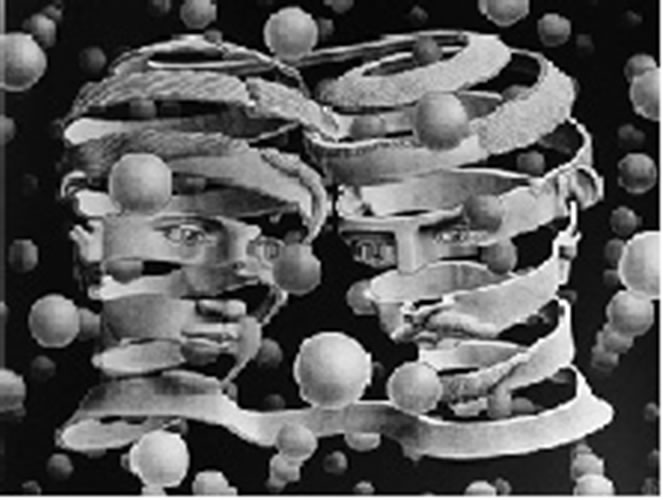
Figure 1. “Form and substance” by M. C. Escher (copyright [22]).
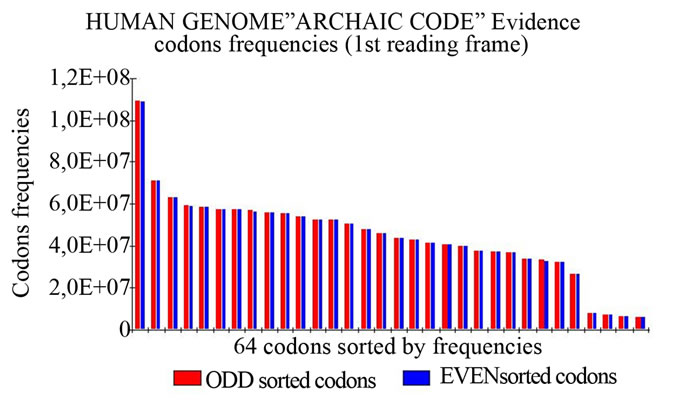
Figure 2. Evidence of a gradation of codon pairs (odd/even) in the hierarchy frequency of 64 codons throughout the whole single-stranded DNA human genome (copyright [2]).
emerging from the side partition between 32 master codons and the 32 linked twin codons—this will be the first of three symmetries—we will find successively:
A second vertical symmetry dividing the ranking sorted populations codon partition the 32 most frequent codons and 32 less frequent codons. If we combine the first 2 partitions, we then obtain a clustering into 4 quartiles as shown in §2.3.
A third symmetry appears observing the twin codons curve: in this curve, there is a sharp break between the first 56 codons and the last 8 codons (Figure 2). These 8 codons are the last 8 codons “octave” of this hierarchy. By exploiting this information we discover the rich potential of a partition of the populations of 64 codons in 8 octaves of 8 codons each.
But before examining these three nested symmetries, we will introduce this article with a very curious discovery [2], chapter 1, which we state as follows: the ratio between the combined population of the 64 codons and the population of the two most frequent codons (TTT + AAA) is equal to the number “13”. This ratio is checked for each of the three reading frames of the codons.
The corollary is, of course: the relationship between the cumulative population of 62 codons other than TTT and AAA and the combined population of these two codons.
AAA and TTT is the number “12”.
But many other surprises awaited us in this study …
Notes: For readability of this article, I must add here these professor george church’s (http://arep.med.harvard.edu/gmc) advices: “you are using terminology in a way that may confuse biologists. For example using the words “triplet” and “codon” interchangeably (rather than restricting the latter to “reading frames” = genomic regions known to be translated by ribosomes). Also using the term “mirror” instead of “reverse-complement”. Mirror typically means same sequence but different chirality”. So, I considere here triplets of nucleotides as codon reading frames overlapping whole genomic DNA independently with genes-coding restricted world amino acids translations.
2.1. “13 and 144”: The TTT and AAA Fibonacci Symmetry
In [2], Chapter 5, Figure 5.1 presents the 3 sets of 64 codons populations related to each of the 3 possible codons reading frames. Then, observe that the 3 cumulated values of codons related to these 3 codons reading frames are:
3 frames: 947803867 947803881 947803864 On the other hand, the 2 × 3 populations of codons TTT and AAA for these 3 codons reading frames are summarized in the following Table 1:
Speculations on these results: The reader will observe that 13 and 144 are both Fibonacci numbers. In addition, if the Fibonacci sequence is 1 2 3 5 8 13 21 34 55 89 144 ... We note that the differences from 1 to 13 as 13 to 144 are equidistant and = Phi*5 (with Phi the golden ratio). See details in the following Table 2 synthesis.
2.2. The First Symmetry Axis
First, when we analyze the detailed values of these codons, it appears to have a perfect “mirror codons property”: each codon couple within the pairs has a complementary mirror reverse codon; example: TTC <==> GAA. In fact, we extend Chargaff’s second rule from the domain of single TCAG nucleotides to the larger domain of codon triplets; please see details in [2], particularly in Chapter 6.
In Figure 2, we see that there is indeed a formal relationship between each codon ranked odd and its even ranked alter-ego: thus, in the front line TTT faces AAA, then, in the second line, AAT faces ATT, then, in the third line, AGA faces TCT, etc... It will be the same for each of the 32 pairs of codons... the formal relationship
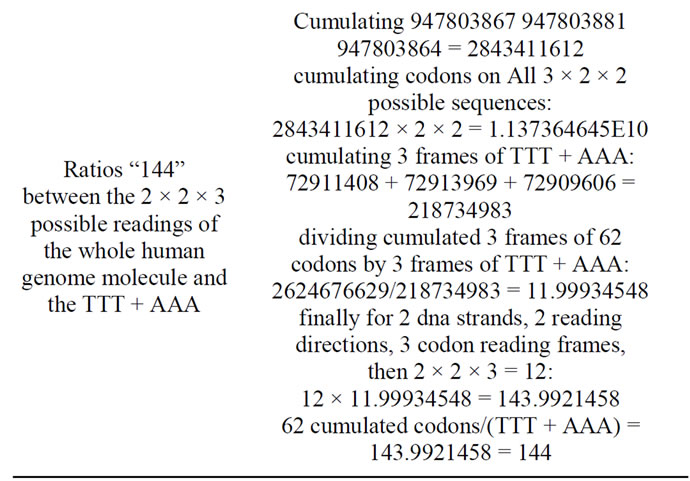
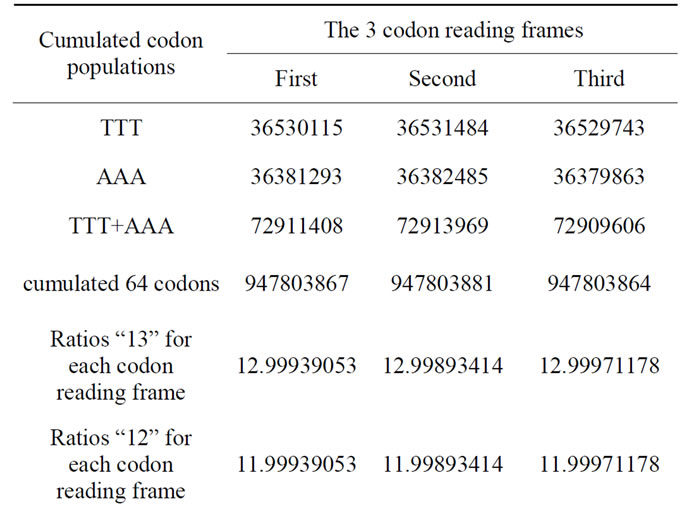
Table 1. The number “13” and the human genome.
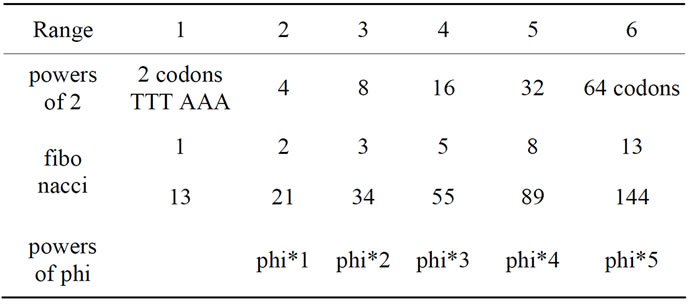
Table 2. 1 13 144 and fibonacci numbers from the human genome.
between each codon and associated mirror codon is so trivial that it can even make the algorithm:
Consider “codon master” and “codon mirror” for any one of 32 pairs of codons matched by mirror symmetry. We compute the function: “codon mirror F (codon master)”, by example TCG <==> CGA, DO:
Step 1: with a palindrome, turn the master codon on itself: exp TCG ==> GCT Step 2: complement the results of step 1 using the Watson/Crick law of complementary bases: exp GCT ==> CGA The final result is now the mirror codon.
Then, to summarize: TCG ==> GCT ==> CGA Step 1 Step 2 Thus, each codon facing a mirror codon is obtained simply by turning codon symmetry on itself (exp TCG <==> GCT) then doing Watson/Crick law of complementarity bases: T <==> A or C <==> G (exp GCT <==> CGA). Then, to summarize, see Table 3:
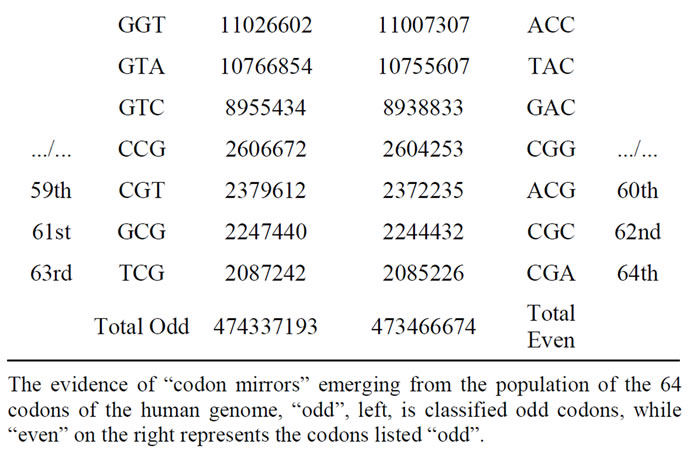
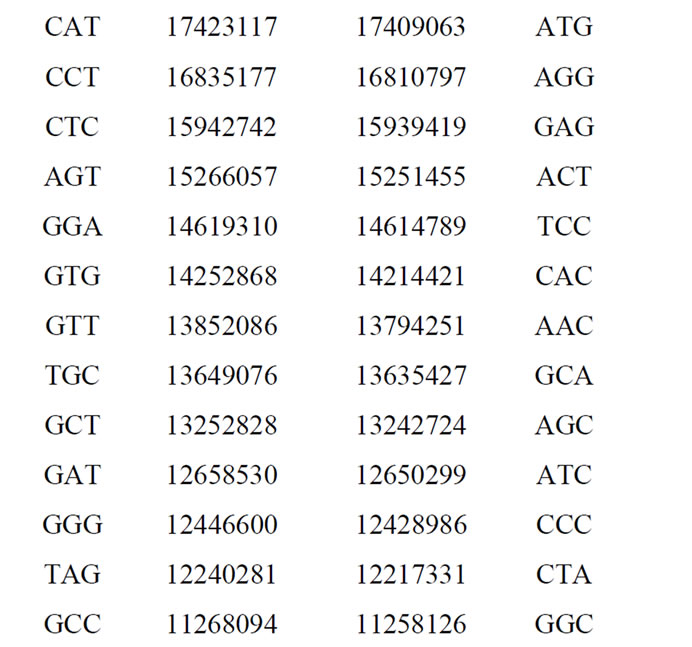
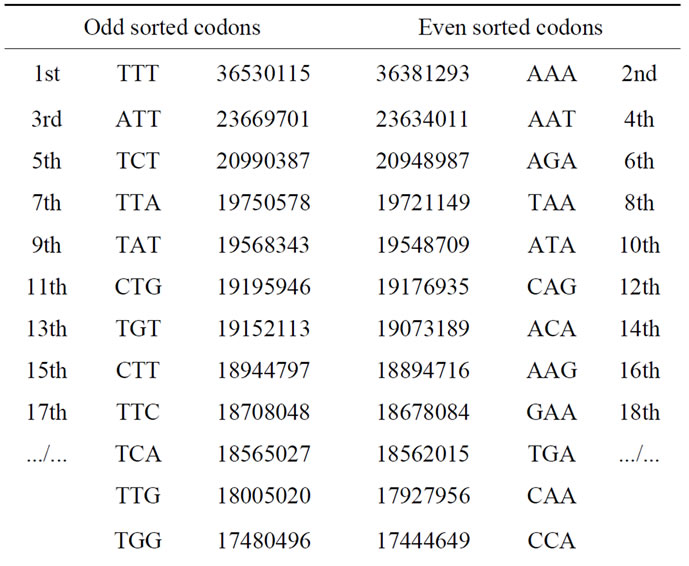
Table 3. Populations of the 64 codons sorted in descending order in the case of the first codons reading frame.
The odd and even cumulated codon populations are: 474337193 473466674. Then the odd/even ratio is: 474337193/473466674 = 1.001838607. It is even a real “partition” of the whole human genome as shown in Table 3, the two respective populations of codons forming the two partitions of the genome are correlated to 99.9995%.
2.3. The Second Symmetry Axis
Furthermore, this ratio = 2, Table 4 and the summary Table 5 shows how the various ratios combining these four quartiles highlight several notable integers. We can conclude—already—the evidence of high level of numerical constraints structuring codon populations of the whole human genome.
As demonstrated by Table 4, the population of the 32 most frequent codons is exactly twice as large as the population of the 32 codons remaining in this case, the least frequent. The exact ratio is:
631430091/316373776 = 1.995835745.
If we consider 2 clusters of 32 codon populations each, the most frequent (Q1 + Q2) is exactly 2X as numerous as the least frequent of the 32 codons (Q3 + Q4).
Exact ratio is 1.995859355.
The “Human Genome’s PEACE SYMBOL” or “Cross of Nero”
An immediate consequence of this discovery: We provide here, for the first time in the history of genetics, the formal proof of the existence of a mathematic global organizational law of a whole genome: the human genome. This law is both digital (revealing and accurately reporting adjusted integers) and symbolic (through the graphical analogy with the universal and highly symbolic “PEACE SYMBOL” of the Figure 3).
2.4. The Third Symmetry Axis
SYMMETRY CG: the next table, Table 6, will focus on the 2 × 4 = 8 last codon arrangements of sorted codon populations from single-stranded DNA of the human genome, all containing a subset of two nucleotides formed of the sequence CG. This comment will be included later in this article when we will reorganize the 64 populations of codons following 8 successive octaves of 8 codons each.
3. Predicting Genome Level Codon Populations: The 3 Genomic Numbers
In Chapter 19 of the “Codex Biogenesis” book [2], we show how the combined population of the 24 chromosomes of the human genome can be modeled with correlations over 99% (99.99% in the case of human genome) from three characteristic numbers: we call these numbers “the three genomic numbers”. In [14], the researcher
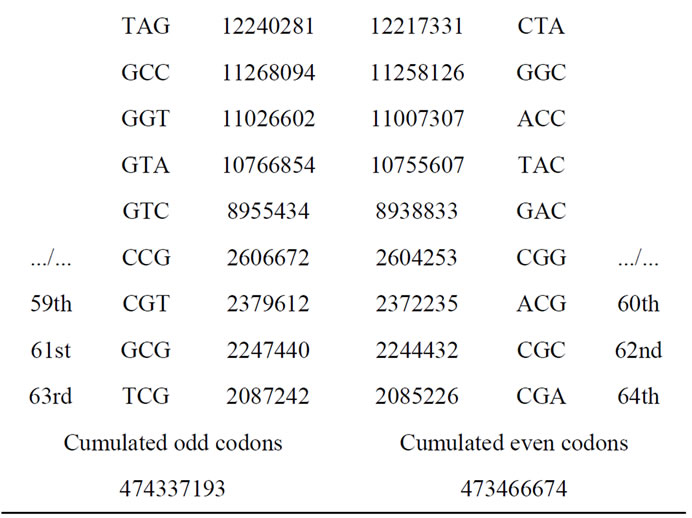
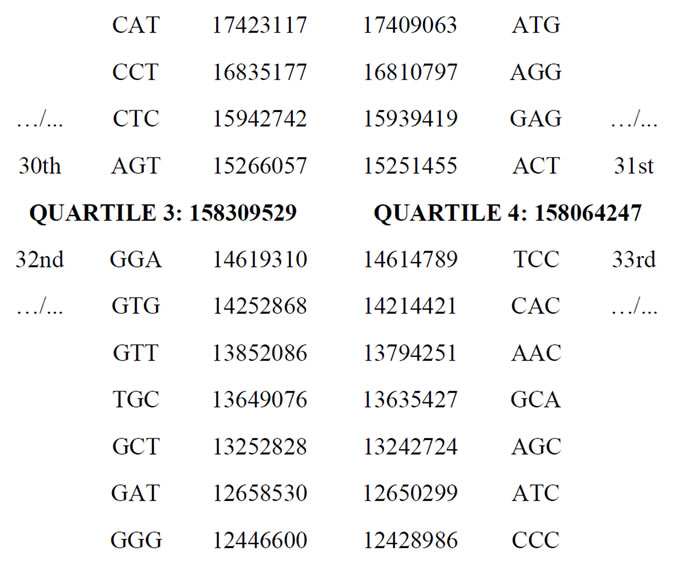
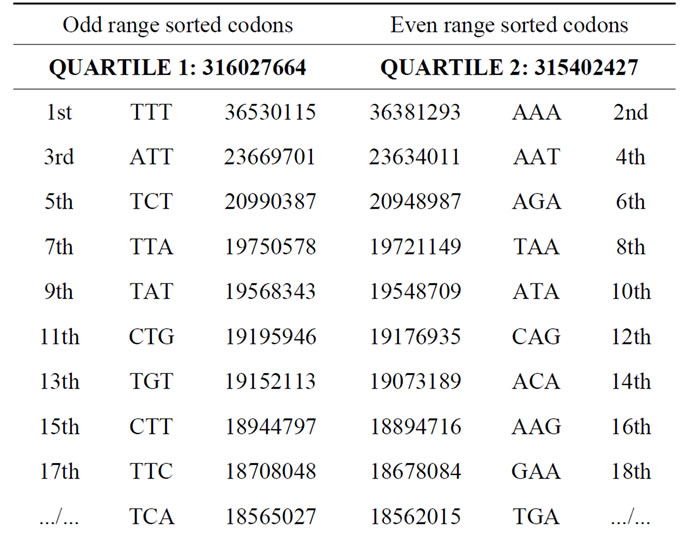
Table 4. Four “quartiles” Q1, Q2, Q3 and Q4 clustering codon populations of the human genome.
Jordi Sola Soler from IBEC Barcelona summarizes and reproduces this very colorful and educational demonstration. However, his results were based on a very redun
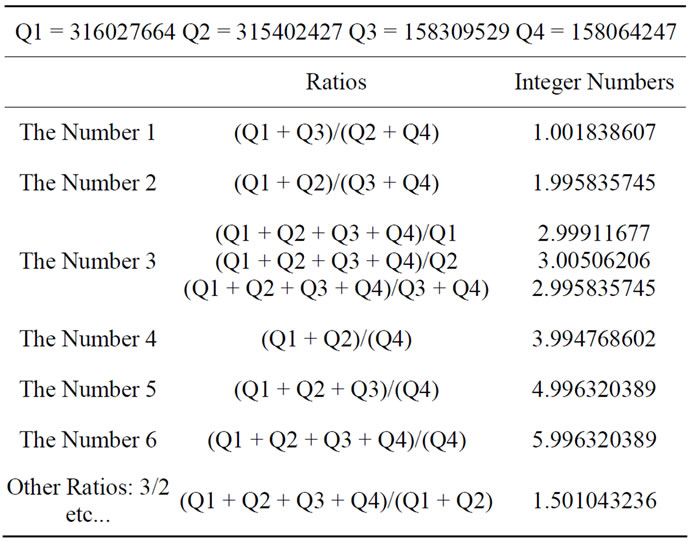
Table 5. The emergence of “integer numbers codes” connecting 4 quartiles.
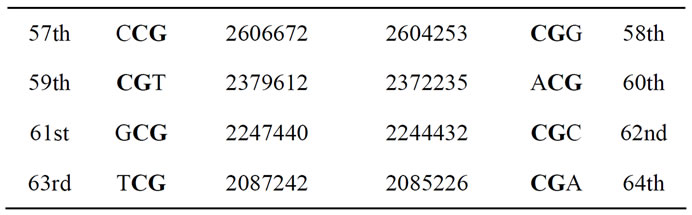
Table 6. A subset of Table 3 focusing on the last CG octave.
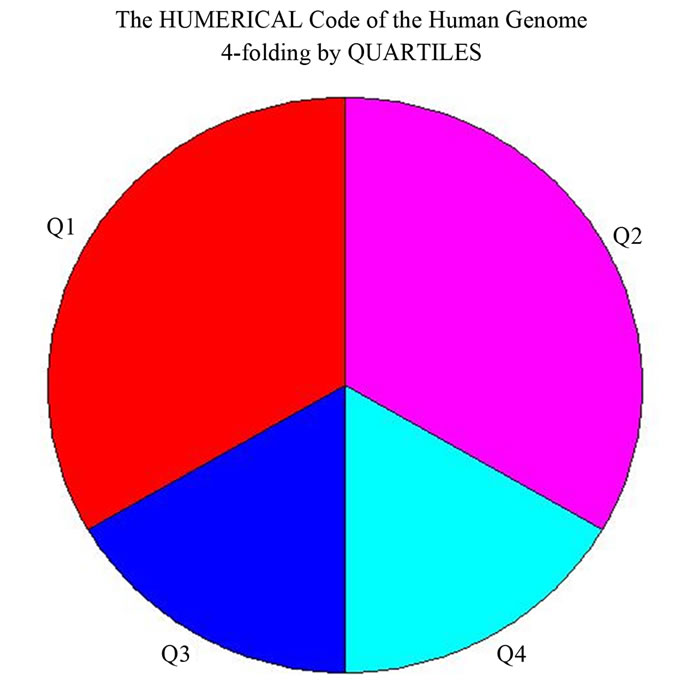
Figure 3. The “PEACE SYMBOL” springs from the geometric representation of the 4 quartiles (copyright [2]).
dant version of the genome in which we had accumulated 12 = 2 × 2 × 3 DNA strands: 2 reading directions, the two strands of the molecule and the three reading frames of the codons. It was only natural that some level of redundancy emerged from this type of analysis. We will show here how and why the analysis of one singlestranded DNA, representing the concatenation of the 24 chromosomes, also produces—exactly the same 3 genomic numbers characterizing the human genome. Now, we consider the single-stranded DNA corresponding to the first of three codon reading frames. The concatenation of the 24 human chromosomes is 947,803,867 combined codons.
The Table 7 below shows the 64 populations of codons corresponding to this first basic codon reading frame.
The codon populations are analysed through the well known Universal Genetic Code matrix of Figure 4.
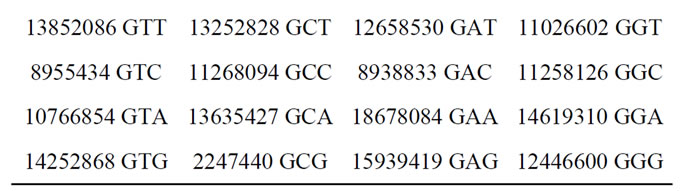
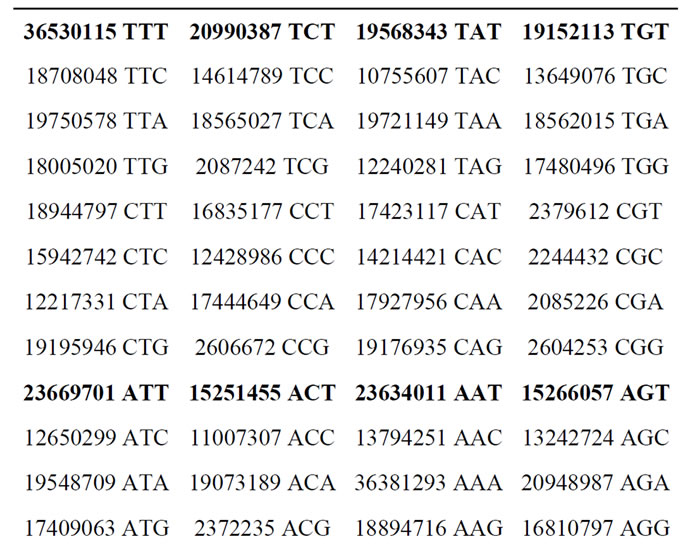
Table 7. The 64 cumulated codon populations of the first codon reading frame single-stranded human genome DNA.
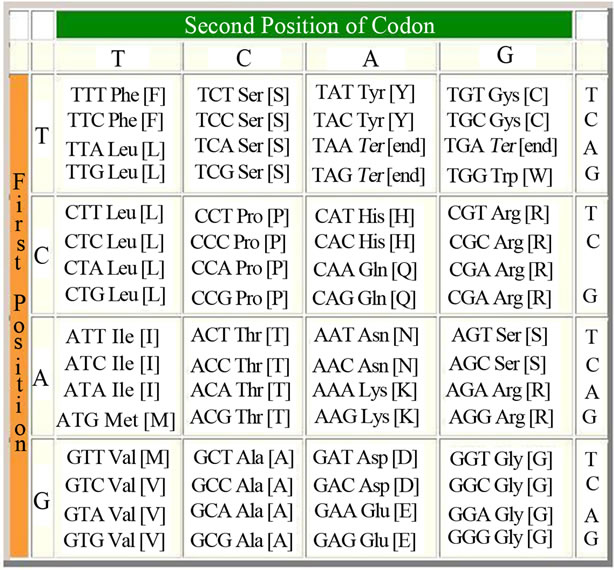
Figure 4. The universal genetic code starting matrix.
The following Table 7 corresponds to the conventional representation of the genetic code; it contains 16 rows and 4 columns. We then split the table between lines 8 and 9 (lines 1 and 9 in bold), then pick up the entire second half and obtained the right of the top half of the table. The resulting new Table 8 is square and thus obtained contains 8 rows and 8 columns. Here is, for example, the first line that we call “octave1” TCT TTT TAT TGT ATT ACT AAT AGT.
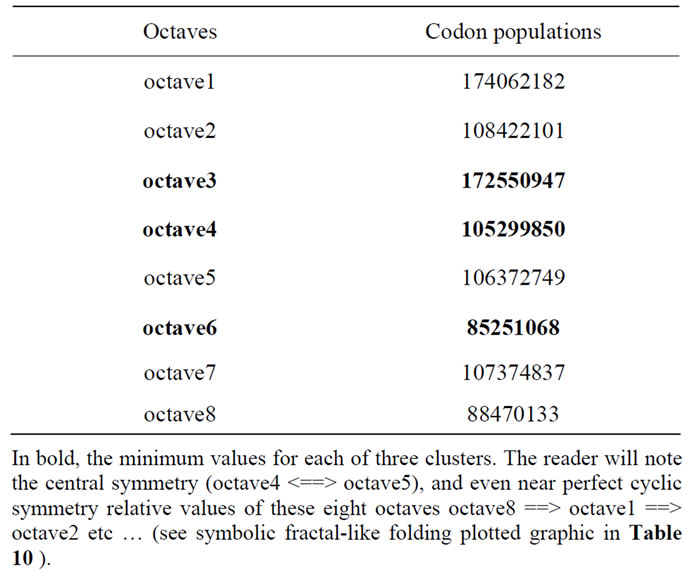
For each of the eight octaves built, we cumulate the values of the eight columns in each of the 8 lines. Observe the values thus obtained for the 8 octaves (Table 9).
Observe also the high level of symmetry emerging from the global structure of these 8 octaves, sorting them in 3 clusters “low/medium/high” (Table 10). Effectively, Table 10 demonstrates evidence of fractal-like embedded symmetries between these 8 octaves long range structures of codon populations.
By analyzing these eight values, we see that they could be reduced to only 3 numbers: O1 = O3O2 = O4 = O5 = O7and O6 = O8.
We also note that these values are remarkable because their proportions are very close to 1, 2 and Phi the golden ratio. ThenO1/O3 = 1 = 1.008758196.
O3/O6 = 2 = 2.024032673 O1/O7 = Phi = 1.621070512 To be more specific we can do the same calculations on the average of each of these three “numerical attractors”.
==== averages ====
OCTA 1,3 = average octaves [1,3] = 173306564.5 OCTA 2,4,5,7 = average octaves [2,4,5,7]
= 106867384.3 OCTA 6,8 = average octaves [6,8] = 86860600.5
=== average ratios ===
“two” = 2 = OCTA 1,3/OCTA 6,8 = 1.995226415
“Phi” = 1.618033989 = OCTA 1,3/OCTA 2,4,5,7
= 1.62169745 Other complementary ratios:
OCTA 2,4,5,7/OCTA 1,3 = 0.6166378323 = 1/Phi OCTA 2,4,5,7/OCTA 6,8 = 1.230332091 = 2/Phi
= 1.236067978.
Then finally, the 64 whole human genome codon populations of the single stranded DNA could be modeled by matrix based logical combinations from only the 3 characteristic numbers, “the three genomic numbers”:
Notes: First, we note a very strange analogy: the 8 octaves clusters values are analog with an (a + b)*2 polynomial development = a*2 + 2ab + b*2, where “a” is the major cluster (2 times), “b” is the minor cluster (2 times) and “2ab” is the medium cluster (2 × 2 = 4 times).
We must discuss this redundancy nature of genomic DNA in Conclusion §5.7.
Secondly, in chapter 19 of the book “Codex Biogenesis” [2], we show the algorithm based on a cellular automata, which automatically computes the 64 modeled codon populations from only the 3 genomic numbers set: effectively, if the 8 octaves could be modeled from only 3 numbers, then, what about ratios between the 3 ones (1’s), the 5 remaining (redundancy) and the whole (8 octaves)?
If V3 = 173306564.5 + 106867384.3 + 86860600.5 Then cumulated octaves/V3 = 2.582328745 = Phi*2 (near 2.618033...)
(5 redundancy octaves)/V3 = 1.582328745 = Phi (near Phi=1.618033...).
Thus, at the level of cumulated codon populations, the ratio of numbers (Fibonacci) 3, 5, 8, is the golden ratio based scale: 1, Phi, Phi*2. So, we must revisit this strange property in §5.7 conclusions...
Then, if in the above Table 11, we replace the 9 real values by 9 ideal modeling values, there is a strong correlation between these two vector’s 9 elements: 0.9999791052.
Finally, we show here 3 ways to build the 3 × 3 matrix:
-the above Table 11 studying one single DNA strand.
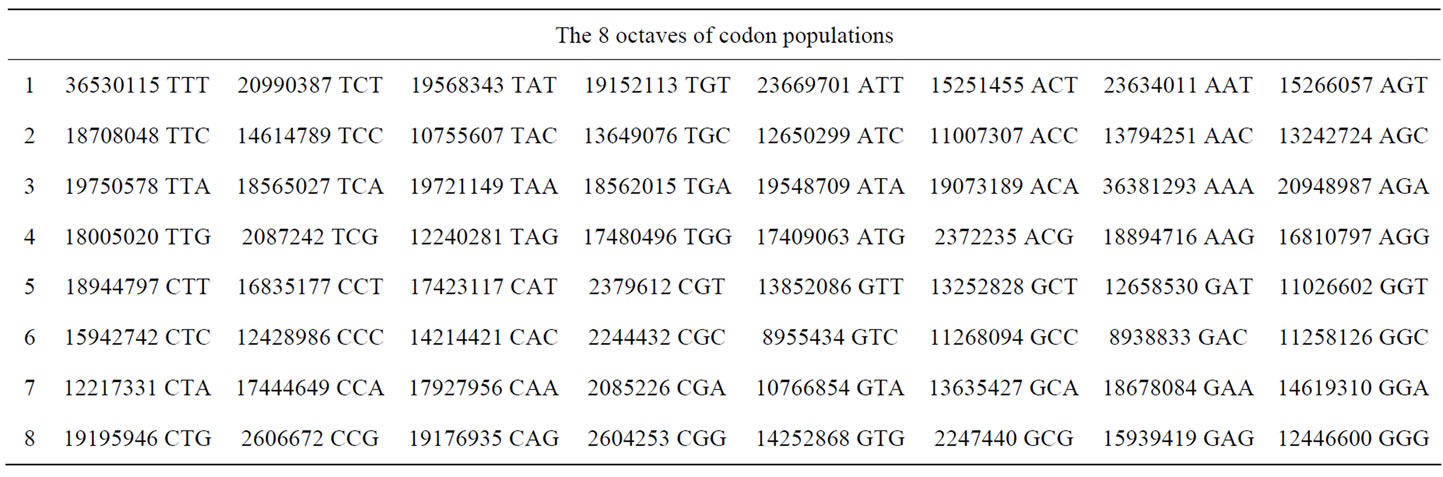
Table 8. The reshaping of 8 × 8 octaves of codon populations.
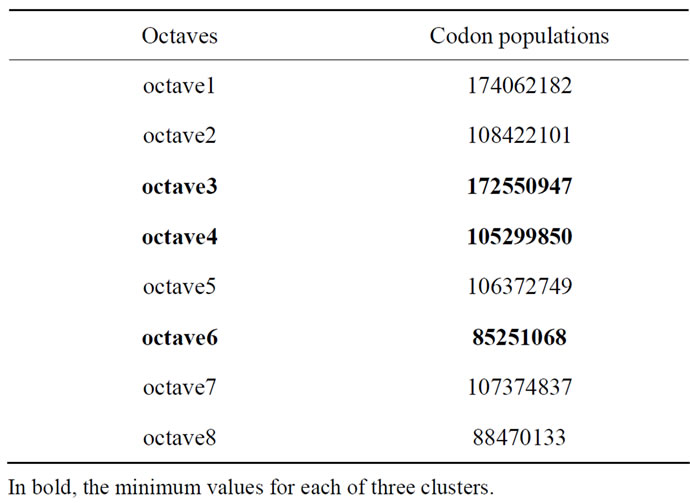
Table 9. The 8 octaves of cumulated codon population values.
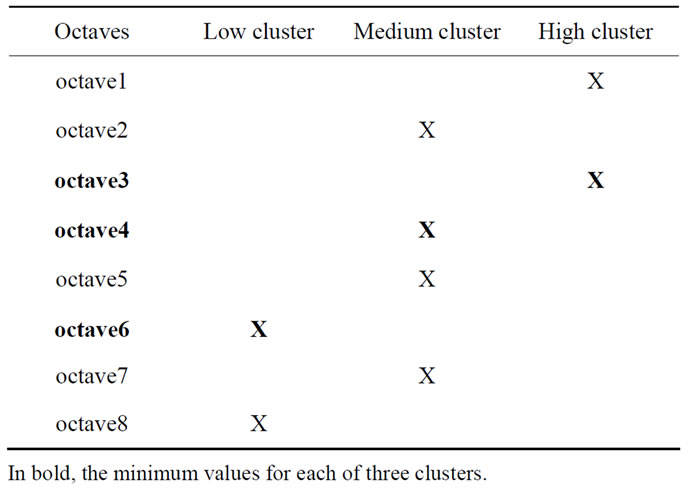
Table 10. The 8 octave clusters, symmetries and fractal-like folding evidence.
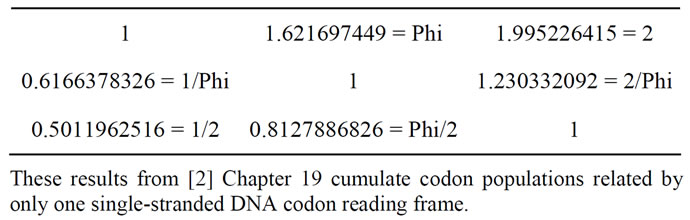
Table 11. The famous 3 × 3 human genomic numbers matrix.
-the below Table 12 unifying 12 DNA strands reading directions.
-the Jordi Sola Soler’s Table 13 from [14], unifying, also, 12 DNA strands reading directions.
As shown by (Table 13) below, Dr Jordi Sola Soler [14] presents analog results in his “Phi and music in DNA” website (Table 12 referenced in his website).
We can therefore conclude that three numbers are sufficient to completely characterize the interrelationships between the respective populations of the 64 codons. For each chromosome in each genome for each species, these numbers vary with the exception of one: the number “1” —always present—which translates Chargaff’s second law. Thus, in the human genome, if three numbers are 1, 2 and Phi across the entire genome, they will differentiate significantly when considering each of the 24 individual chromosomes, see details in [5]. The summary array above (Figure 5) shows the calculated values of the 3 “genomic numbers” for specific genomes of 12 different species ... In this Figure 5, we have listed all the data related to various whole genomes: label genome, chromosome number, total bases, values derived from each of the 3 genomic numbers and genomic correlation model/ real as defined in [2], chapter 19.
Despite the great diversity of genomes studied, we observe that:
-In all cases, the correlation between model prediction and actual measurement is greater than 99%, and often to 99.999% (HIV1 virus and H5N1, yeast, plant Arabidopsis and Plasmodium falciparum).
-For all genomes, the genomic number “1” continues.
-For each of the genomes, two of the three genomic numbers are specific to the genomes and species.
On the other hand, if the chimpanzee is as remarkable as the man he shares the same 2 genomic numbers (2, Phi and more) with, the correlation model/reality is even better than for man. There is also evidence that some
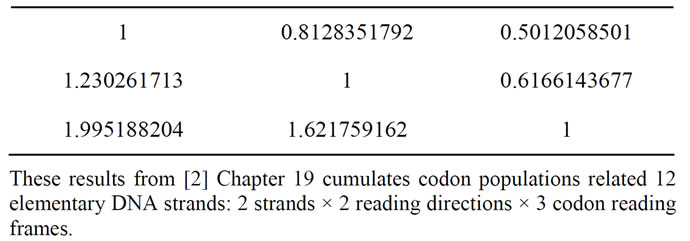
Table 12. The famous 3 × 3 human genomic numbers matrix from [2] (Chapter 19).
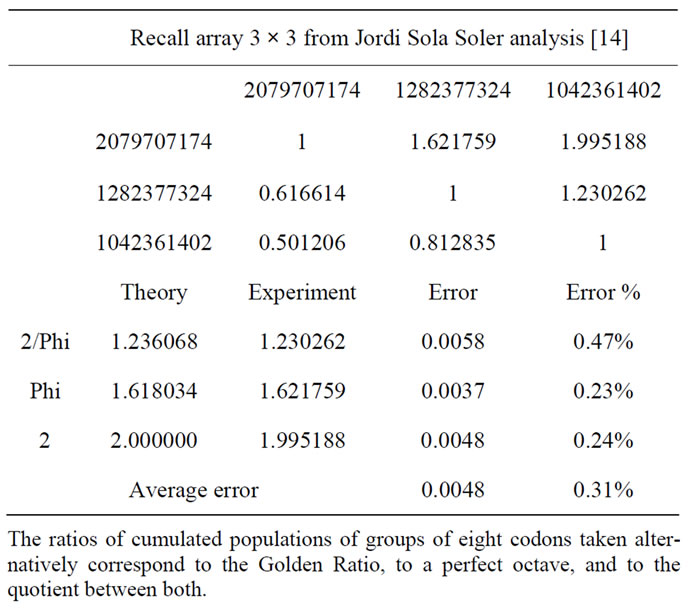
Table 13. The 3 × 3 human genomic numbers matrix [14].
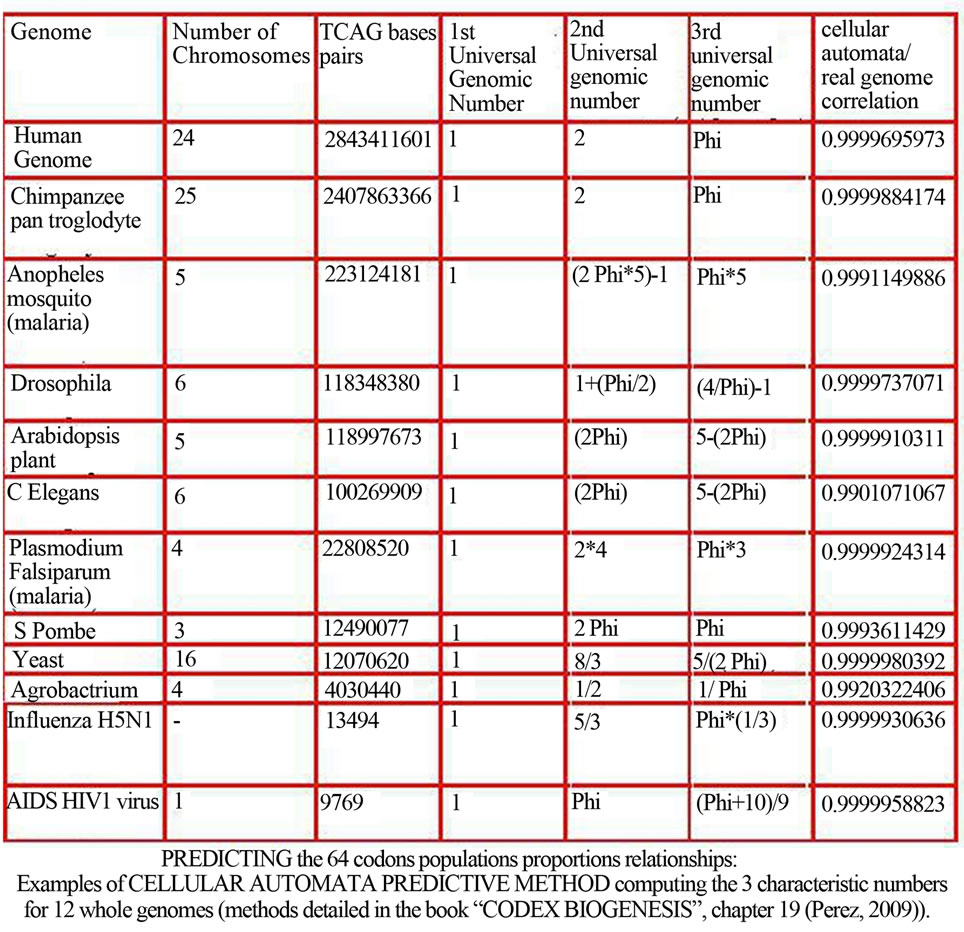
Figure 5. Generalizing the “3 GENOMIC NUMBERS” in the cases of various main complete genomes and species (copyright [2]).
species share exactly the same model, that is to say the same genomic couple of numbers: if it seems “natural” between humans and chimpanzees, it seems “strange” between the plant Arabidopsis and the worm C. elegans ...!
Finally, it seems—but it would take additional refining —that the 2 genomic numbers specific to each genome are always a simple expression related to the golden ratio, Phi.
4. Another Genomic Number Even Stranger; Is (3-Phi)/2... a Universal Value?
In [13], we showed that the population of the 64 codons of the whole human genome, when reorganizing the universal genetic table using the successive transformed fractal “dragon curve”, self-organized codon populations around 2 attractors: 1 and (3-Phi)/2 = 0.6909830056. When publishing this article, I was very interested in the presence or the golden ratio, Phi: I already thought that this precise tuning certainly corresponded to an overall balance at the whole genome scale. You understand my surprise when I discovered that my article and especially the value 0.6909830056 is quoted in a web site dedicated to the intimate structure of atoms, quarks or Higgs boson [15]… (please visit http://quarks-divided.over-blog.fr/pages/Pi_e_Phi_and_1381976-7937512.html). We find this value of 0.69098 in various other quark studies: CERN, Washington University TeraScale project. (see http://www.phys.washington.edu/groups/ptuw/FlavorWorkshop.html). But this astonishment was transformed into amazement when I discovered that “my” constant (3-Phi)/2 is related to Phi but why also Pi and “e” (Euler’s constant), all 3 universal constants? In addition, it would be connected to a key value of the geometric structure of the atom, (see http://quarks-divided.over-blog.fr/pages/Pi_e_Phi_and_1381976-7937512.html). I then had the intuition that this constant is hiding perhaps even greater universality, hence the need for revisiting its role in DNA and genome… The reader can verify for himself that as noted by Dr Gielen. (see http://quarks-divided.over-blog.fr/pages/Pi_e_Phi_and_1381976-7937512.html ). If AB = Pi * e * Phi = 13.817580227... then R = 6.9087901135... Details: to synthesize this, a main radius in the theory of quarks is R = 6.9087901135 because it matches the radius of a sphere of volume = 1381,976 ... and lot of other geometric properties (surface, etc.). One then finds that the radius is (3-Phi)/2 ... which leads to a volume of a sphere = 4 × Pi (R * 3)/3 = 1.381944838 ... which is none other than ... (Pi × Phi × Euler)/10 = 1.381758023!! The approximation error is only of the order of 1/10000 = 1.381944838 − 1.381758023 = 0.0001868152823 more precisely. We also note that:
Pi × Phi × Euler/20 = 0.6908790114 = (3-Phi)/2 = 0.6909830056...
But let us now look at the value VOLUME SPHERE = 4 × Pi (R * 3)/3 = 1.381944838 ... We see that it is very close to 3-Phi = 1.381966011. We deduce a remarkable discovery: if the radius of a sphere is (3-Phi)/2 then the volume of this sphere is 3-Phi... The error is only 0.0000211732501. Secondly, we note also that the SECTION of the SPHERE is Pi × R*2 = 1.499977019 = 3/2. The error is 0.000022981. Thirdly, we note that the surface of this same sphere is = SURFACE SPHERE = 4 × Pi × R*2 = 5.999908074 = 6 = 2 × 3 with an error = 6-5.999908074 = 0.000091926. Finally, the circumference of the sphere is equal to 2 × PI × R = 4.341574268. This is very close to 3 times the reverse of (3-Phi) / 2. Effectively: 6/(3-Phi) = 4.341640786, with an error = 0.00006651754558.
In conclusion: “A sphere of volume 3-Phi has radius (3-Phi/2), which is half the same volume”.
Corollary: a sphere whose volume is equal to the diameter, the section is 3/2, the circumference is 3 times the reverse of (3-Phi)/2 and the surface is equal to 6 has a radius = (3-Phi)/2.
Finally, if the radius of a specific sphere is (3-Phi)/2 then:
the diameter is 3-Phi the circumference is 3 × (2/(3-Phi))) = 6/(3-Phi)
the section is 3/2 = 6/4 the surface is 6 = 2 × 3 and the volume is … 3-Phi... Then to summarize, Table 14:
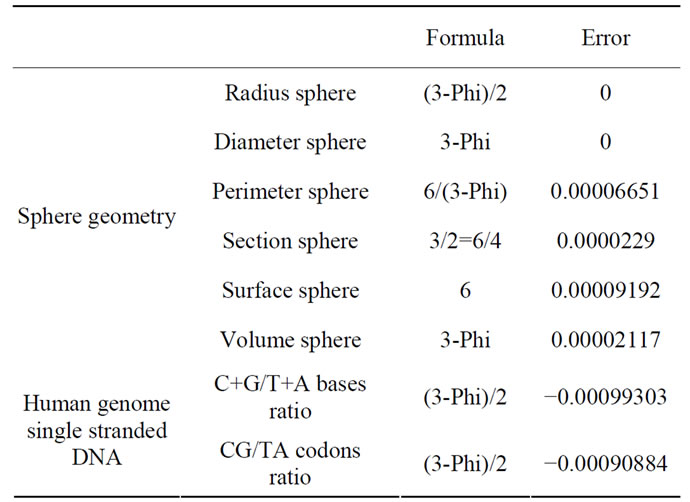
Table 14. The (3-Phi)/2 ratio in sphere geometry and human genome.
We note particularly a kind of “NUMERICAL RESONANCE”: effectively, ALL ratios are related to the same 3 basic initial numbers: 2, 3, and Phi.
Yes (3-Phi)/2 looks good as a universal value! Here are the proportions of codon and nucleotide populations within the whole single stranded human genome DNA! We decided to revisit this value (3-Phi)/2 applied again on the human genome. But here we explore a new structure of the 64 codons. Perry Marshall [16] suggested that I study populations of codons by analogy with the famous Rubik’s cube. To do this we reshaped the genetic code and corresponding codon populations following a 3-dimensional space of 4 × 4 × 4 codons. Here are the results of the second codons reading frame (see Table 1) from single-stranded DNA formed by the concatenation of the 24 human chromosomes. Previously, a preliminary remark: we focused on the ratio (3-Phi)/2 = 0.69098300... but also its inverse 2/(3-Phi) = 1.44721359…
Tables 15-17 analysis following each of three dimensions of the cube will reveal a high stability of equilibrium of the respective populations of codons.
A similar analysis also provides perfect results on the second attractor “1”. We do not detail here. However, if we show that a perfect balance is shown here at codon populations ... it will be the same for the “people of nucleotides” as shown by Table 18!
We will show in the conclusion that (3-Phi)/2 and the 3 human genome genomic numbers have one and the same genomic organization.
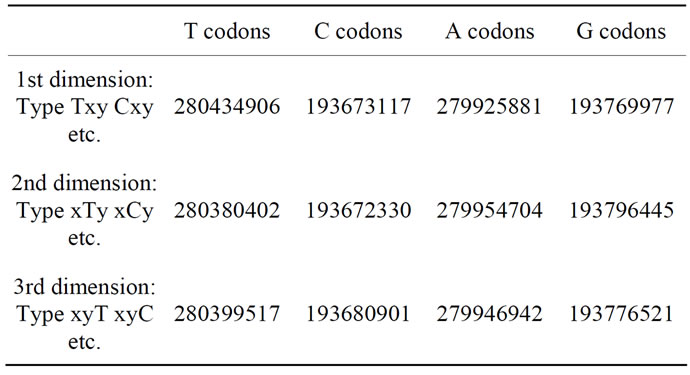
Table 15. Codon populations from a 4 × 4 × 4 reshaped codon populations genetic code cube.
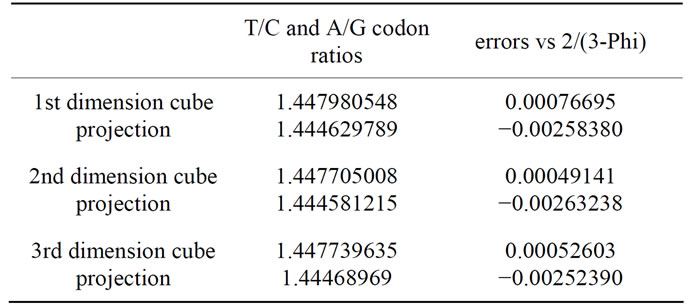
Table 16. Codon populations ratios T/C and A/G from a 4 × 4 × 4 reshaped codon populations genetic code cube.
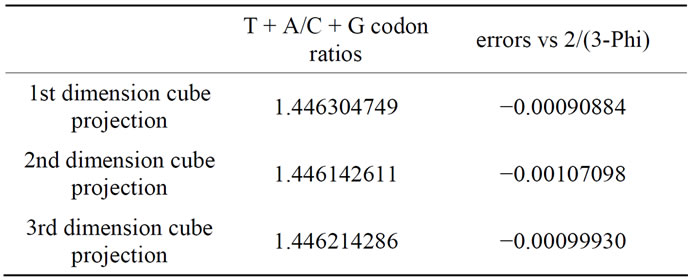
Table 17. Codon populations ratios T + A/C + G from a 4 × 4 × 4 reshaped codon populations genetic code cube.
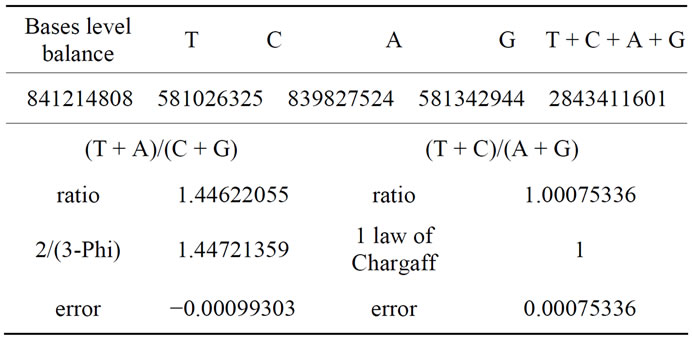
Table 18. TCAG nucleotides level 2 attractors tuning evidence.
5. Conclusions
To conclude, we emphasize the following points:
The benefits resulting from a chromosome and genome scale level codon analysis will be amazing as well as significant:
-Naturally, this tuning of the whole human genome adjusted on the outstanding value of (3-Phi)/2 leads us to the question of a possible universality of this number, well beyond genomics.
We will now conclude on the following seven other notable results:
1-Junk DNA and DNA strands atomic mass tuning;
2-Universal genetic code table “lens” and “matrix”;
3-Numerical DNA constraints;
4-The 3 genomic numbers species diversity;
5-Human genome and chromosomes genomic numbers diversity;
6-Some 3-D speculations;
7-“Form and substance” in the human genome.
5.1. Junk DNA and DNA Strands Atomic Mass Tuning
Obviously, our paper will reveal the strong utility of unknown junk DNA function. We show that this role most likely contributes to the balance and fine tuning of the atomic masses of the huge double-stranded DNA molecule.
And, if this perfect codon populations balance was the ultimate goal, to ensure “the optimal balance of masses” of the DNA double helix within whole chromosomes and genomes...
It is interesting to look now at this huge DNA molecule comprising the human genome looking for balanceing and tuning atomic masses or even at the quantum level [17]... Finally, I state that: the multiple equilibria that we have explored in this article are only achieving a main goal: securing and maintaining the costs and using these cute thousand tricks, each as beautiful as the other, TO BALANCE THE WEIGHTS simultaneously across the huge but fragile double-stranded DNA molecule, and across chromosomes and whole genome... We find some evidence of this subtle balance in my book “Codex Biogenesis” Chapters 12 and 13 particularly Table 19 below (from page 156 in book [2]) reports the perfect balance that we calculated by comparing the atomic masses of the two DNA strands accumulated throughout the human genome.
5.2. Universal Genetic Code Table “Lens” and “Matrix”
Secondly, everyone knows that the main function of the universal genetic code table is the correspondence between the 64 codons of DNA and RNA, on the one hand, and the 20 possible amino acids, on the other hand. Yet, as demonstrated by our 2010 paper [10] and then by Professor Petoukhov’s research [1], we demonstrate throughout this article a second function, equally important: its role as a “filter” or “matrix” determines the relative proportions of each of the 64 codons in single-stranded DNA sequences of chromosomes or genomes.
GENETIC CODE “coherent sunlight” reveals
GENOMIC DNA “holographic like” CODING
Then, a main conclusion is the following: In the difficult process of finding possible structures of singlestranded DNA sequences forming chromosomes and genomes, the universal genetic code table can play a central role as a “filter” or “matrix”, revealing the HIDDEN CODES of DNA. So any method—particularly that of Pr. Petoukhov—will “reveal” fragments and “views”. This kind of unattainable holographic-like “information hydra” is still DNA genomes. By analogy, the projections
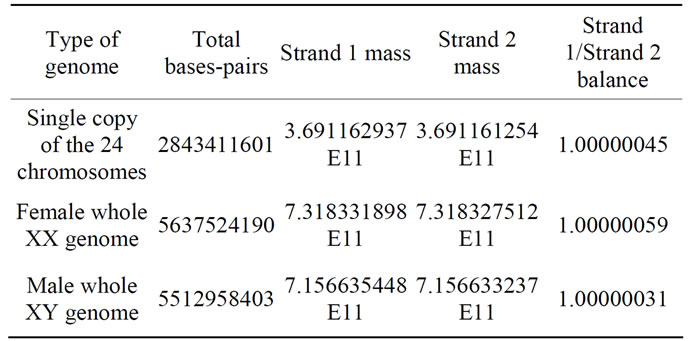
Table 19. The perfect balance between the two DNA strand’s atomic masses within the whole human genome.
along the 64 codons of the genetic code table by their numerical consistency play the role, in the image of coherent laser light. It is therefore sufficient that the method of analysis is mathematically consistent as is the case in Petoukhov’s genomatrix method. Finally, the synthetic Table 20 below shows how we successively “sailed” between various dimensions of exploration of this hyperspace in the population of these 947803881 codons of the whole single stranded DNA human genome.
5.3. Numerical DNA Constraints
Third, our results demonstrate that the relative proportions of codons in DNA are “forced”, constrained and controlled—one might even say “weighted” and “fine tuned”—by laws of numerical mathematical nature, which is radically innovative.
Now, take a step back: The universal genetic code table as a kind of “filter” or “genomic lens” to explore and discover the many dimensions and “views” of the genome.
Here we will limit ourselves to the study of the human genome. In this study, we first considered this kind of hyperdimensional space, equal to 64 respective populations of each of the 64 codons constituting the entire human genome. It then revealed relationships and remarkable symmetry of codon mirrors, but also curious ratios as sharing the same four (4) parts, which characterize the famous figure of the “peace symbol”. The key then appeared as 64 codons sorted in descending order of populations of these codons (Figure 2). Then we discovered the ranking of the 64 populations; the clustering of 8 (“eight”) octaves of cumulated codon populations (Table 9).
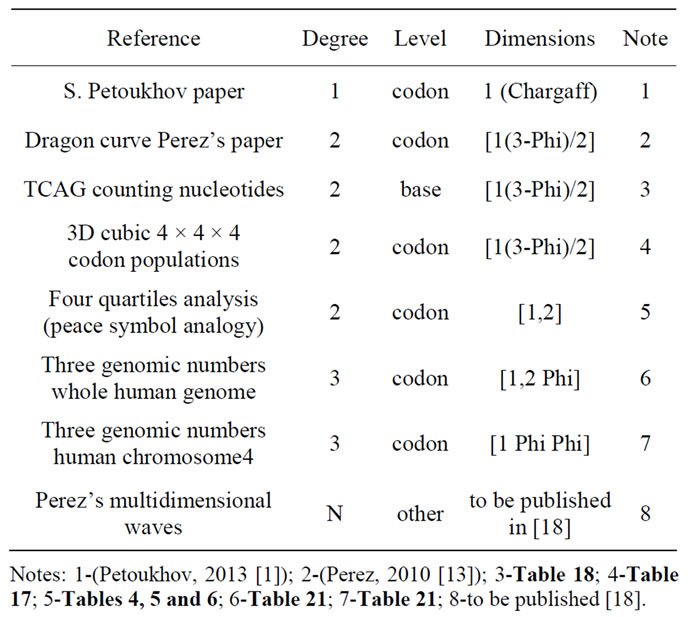
Table 20. “Sailing” within the human genome...
5.4. The 3 Genomic Numbers Species Diversity
Fourth, the analysis of populations of codons obeys three numbers characterizing each specific chromosome or genome: “the 3 genomic numbers”. This law is universal, then in light of what has been demonstrated here, we can state the following three laws:
• The First Law: Law of “computability genomes”. The codon composition of any genome is “computable”.
• The Second Law: “3 genomic numbers law”: We discovered that three numbers determine genomic relationships between specific codon populations identified from the 64 positions within the universal genetic code array. This universal predictive model— running a cellular automata—is correlated with the real codon populations, revealing correlations above 99% (and often 99.999%) for all genomes analyzed (We recall that the technological consensus error from DNA sequencers is of the same order: one nucleotide TCAG false or indeterminate in 10000). For example, for the entire human genome (24 chromosomes and 3 billion bases TACG), 3 genomic numbers are “1, 2, and Phi = 1.618033…” These three numbers generate a square modeling matrix with 64 codon positions, with an accuracy of 0.9999695973 compared to the real codon populations! For the Arabidopsis Thaliana plant genome (5 chromosomes and 120 million bases, TACG), these genomic numbers become the triplet [1, 5-2Phi, 2Phi] ... and the accuracy of the model is 0.9999910311 ... To simplify, it means that the respective populations of the 64 codons of any genome are calculable from 3 numbers, 2 are specific to the genome.
• Finally, faced with the evidence of such a strong DETERMINISM of the HUMAN GENOME in particular and in general all genomes, we even went on to explore the way that populations of codons of the human genome could be reduced to the solving a system of linear equations or non-linear ...? or inequalities?
It is unfortunate that if the system can be put into equation—I realized that—the equations may be redundant, superfluous and over determined. This line of research: “a system of equations of the human genome” is very promising. It will be explored and deepened. I’m sure of its potential, imagine: “The system of equations of the human genome”!
5.5. Human Genome and Chromosome’s Genomic Numbers Diversity
Fifth, the methods and results presented here are related simultaneously to both the scale of whole genomes with each chromosome individually considered. This again is a universal character of these laws. Particularly, it appeared in the case of the human genome. This dual level of strong mathematical constraints led to remarkable genomic numbers across all 24 chromosomes as well as across the entire genome. This result is quite remarkable. Thus, the ratio (3-Phi)/2 appears to us now as unifying the UNIVERSAL billion codons in the single-stranded DNA genome world. But what happens to these ratios at the individual level of each of the 24 chromosomes?
In [8], we have generalized a population analysis of codons across all 24 human chromosomes. It appears extremely DIVERSIFIED between these 24 chromosomes. We were able to establish a structure of order, a hierarchy between these 24 chromosomes. Curiously, the genomic ratios will—with great precision—range from 1/Phi (chromosome 4) to 1/Phi + 1/Pi (chromosome 19). The amplitude of variability is equal to 1/Pi. In a forthcoming paper [18], we explore the extraordinary properties of chromosome 4, which seems to be completely built around the Golden ratio, Phi... Figure 6 below illustrates the variability between populations of codons of the 24 chromosomes. Particularly, chromosome 4 and chromosome 19 constitute the end terminals of the hierarchy whose amplitude is 1/Pi (see details in [8]).
It also shows how the genomic numbers of chromosomes 4 and 19 adjust to new values. The remarkable fact of the human genome is that it tunes its codon populations simultaneously at the individual level of each of its 24 chromosomes, on the one hand, and the overall scale of the whole genome, on the other.
From “the 3 genomic numbers” to “the MASTER GENOMIC NUMBER”... We computed each of these 3 genomic numbers for both cases of the two chromosomes most extreme in this classification: chromosomes 4 and 19. See details in the following Table 21.
We then discover that the “master genomic number” and the “3 genomic numbers” are linked by the following formula:
If G1, G2 and G3 are the 3 genomic numbers, and MG is the “master genomic number”, then: MG = (G1 + G2 – G3)/G2.
Examples: in the case of human chromosome 4: MG = (1+Phi-Phi)/Phi = 1/Phi.
Another example from Figure 5: lines 5 and 6 report the 3 genomic values for the plant Arabidopsis thaliana and the worm C-elegans, their common 3 genomic numbers are 1, 2 Phi and (5 - 2 Phi). Then we could compute their “Master Genomic Number” doing:
MG = 1 + 2 Phi − 5 + 2 Phi
= −4 + 4 Phi = 2( Phi-1)/Phi = 2/Phi*2.
Then MG common to Arabidopsis plant and C. elegans worm = 2/Phi*2.
One note: we observe that the Master Genomic Code corresponds to the scale of nucleotide populations expressing the ratio (T + A)/(C + G). We can easily verify, for example on the genome of Arabidopsis that this report is also 2/Phi*2. Instead, the 3 genomic numbers reflect a more subtle level of organization that verifies a balance between codon populations.
5.6. Some 3-D Speculations
Sixth, we thought about possible potential conceptualizations and materializations of these billion codons of the
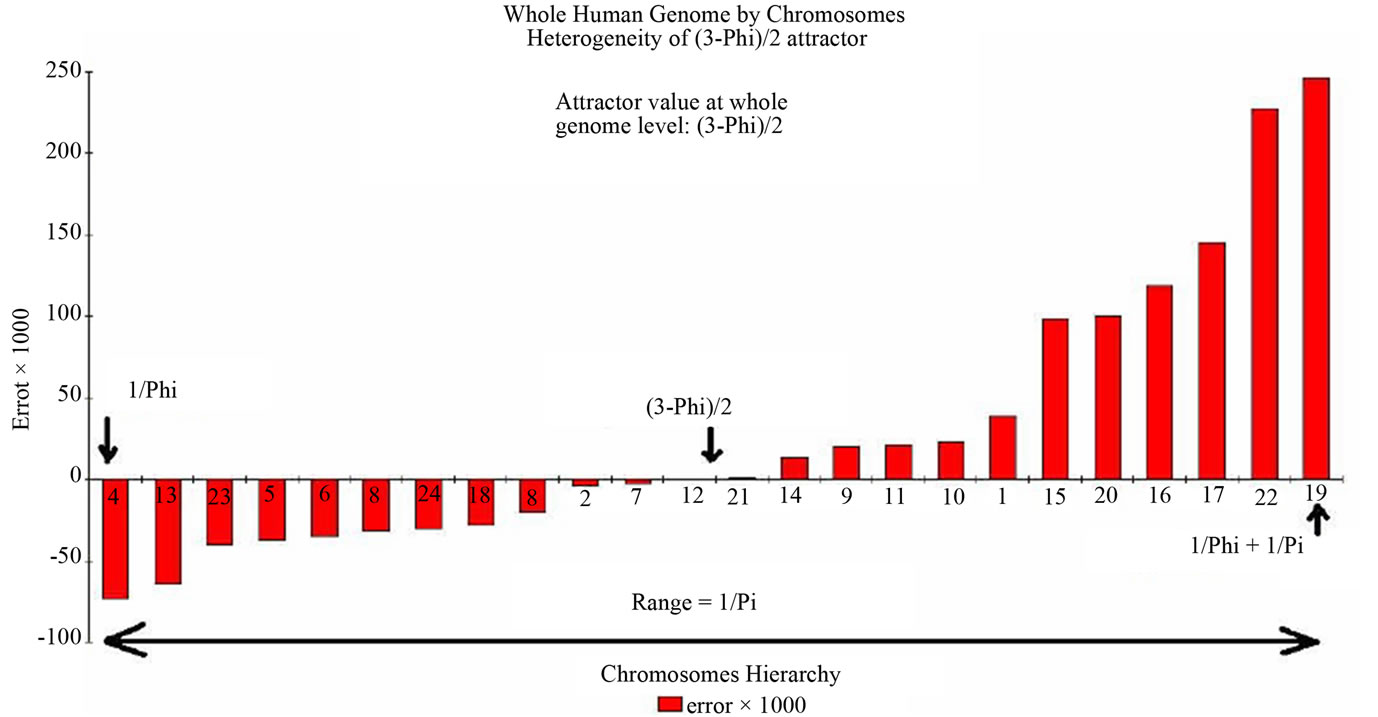
Figure 6. The variability of the genomic ratio for each human chromosome.
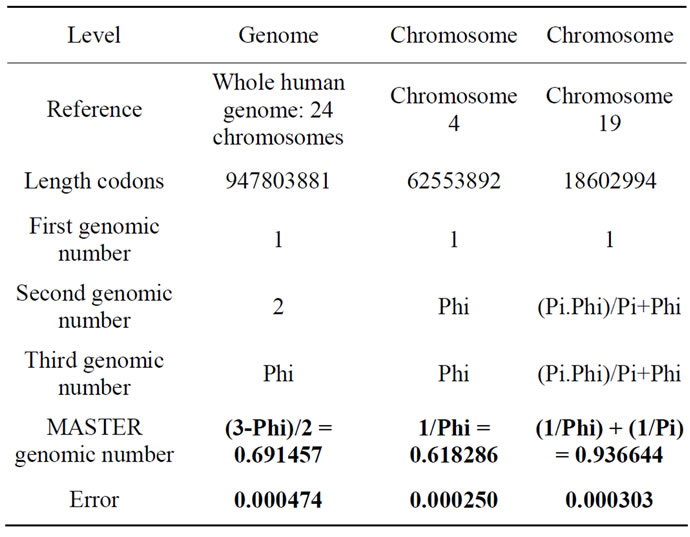
Table 21. The 3 genomic numbers and the MASTER genomic number in the human genome and chromosomes.
human genome unfolding in three-dimensional mathematical spaces determined by the three genomic numbers values. 3 dimensional considerations...
I suggest thinking now about a possible three-dimensional representation of the space of codons ... Of course, the 3 genomic numbers will guide us in this sketch. For example, an “egg” can be represented by the numbers [1, 1, and Phi], which correspond to each of the three axes of symmetry: 1 and 1 for its cut in a circle and one for the other and Phi sectional proportions the golden number. We mention the analysis of Joost Gielen [15] on this topic (see http://quarks-divided.over-blog.fr/pages/PiePhi_3_Pifie_the_egg-8265900.html). Similarly we could draw this hyperspace for the entire human genome: [1,2, Phi]. Or for chromosome 4: [1, Phi, Phi]...
Now, we return for a moment to the three genomic numbers managing the whole human genome: the triplet [1,2 Phi]. Then I’ll suggest you consider the strong links that could connect each of these three genomic numbers with different symmetries encountered at the beginning of this article:
-on the first three dimensions, it will seem realistic to associate the number “1” with the symmetry 32/32 twin mirror codons. I recall here the remarkable ratio balancing the 32 populations odd/even on each of the 32 pairs of codons:
1.004090619 1.001510112 1.001976229 1.001492256 1.001004363 1.000991347 1.004137955 1.002650529 1.001604233 1.000162267 1.004298538 1.002054899 1.000807281 1.001450258 1.000208477 1.000957417 1.000309344 1.002704788 1.004192689 1.001000995 1.000762985 1.000650657 1.001417171 1.001878479 1.000885405 1.001752926 1.001045687 1.001857178 1.000928865 1.003109726 1.001340205 1.000966802
I imagine this first axis of symmetry as a kind of “backbone” sharing billions of codons; two symmetric families of 32 pairs of codons ...
-the second of three dimensions, it will appear consisting of associating the number “2”. It is obtained by forming the partition between the 32 most frequent codons and 32 less frequent codons. Remember this ratio:
-accumulated populations first 32 codons: 631,430,091.
-accumulated populations last 32 codons: 316,373,776.
Then, the ratio between these two populations of codons is: 1.995835745 or a perfect value of the number “two”.
Finally, on the third of the three dimensions, it will seem realistic to associate the number “Phi” ... How?
We could propose the ratio 3/5 involving two successive Fibonacci numbers is in fact obtained by computing the ratio between the last 3 quarters (the last 24 lines of twin codons in Table 3) and the first quarter of the codon population (the first 8 lines of twin codons in Table 3). This gives the following proportion: (2nd, 3rd, 4th quarters/1st quarter = 1.668509717, which is very close to the ratio 5/3 = 1.66666666.
But the same proportion is also obtained by calculating the ratio of the first quarter (the first 8 rows of twin codons in Table 3) and the third quarter of the population of codons (lines 17 to 24 twin codons in Table 3). Either quarter 1/quarter 3 = 1.661511389 ... Strange! Isn’t it?
But it will be more realistic to propose the following approach: in § 3, we showed how to calculate each of the three genomic numbers. The ratio Phi = 1.618 was obtained by computing the ratio between the cumulative octaves 1 and 7. Table 22 is a reminder of these values So:
Accumulated octave 1 = 174 062 182 codons.
Accumulated octave 7 = 107 374 837 codons.
Ratio octave 1/octave 7 = 1.621070512, very close to Phi value = 1.618033 ...
This corresponds to the relationship of codons between lines 1 and 9 accumulated, divided by lines 7 and 15 accumulated (on the table of the universal genetic code in Figure 4 with four columns by 16 lines). We will let each reader try to imagine the projection of this golden ratio on the chessboard of 64 squares of codons of the famous universal genetic code map ... This is the third and last of the three dimensions of the hyperspace of codons, 3 genomic footprints of the whole human genome 3 genomic numbers set!
5.7. “Form and Substance”, “Information and Redundancy” in the Human Genome
We will demonstrate that—simultaneously with the dual

Table 22. Subset of octaves 1 and 7 from Table 8 (the 8 × 8 octaves codon populations reshaping).
ity between genes and junk DNA—there is a second hidden level of structure sharing all the DNA of the human genome, dividing it into a second type of duality information/redundancy (background).
Table 23 revisits the eight values of 8 octaves Table 9.
Here we have eight (8) numbers that can be reduced to three (3) major numbers, the remaining five (5) minor numbers are redundant.
Well (!?): 3 5 8, it is very similar to three consecutive Fibonacci numbers ...
We then had the intuition to calculate three populations corresponding to this trilogy of values.
At first, we used the minimum value for each of three sets of redundant values. The result is:
cumulating the 8 octaves: 947803867 FORM: cumulating the 3 minimums from each set (octaves 3 4 6): 363101865 SUBSTANCE (Background): cumulating the 5 remaining redundancy octaves (octaves 1 2 5 7 8): 584702002 ratio SUBSTANCE/FORM = 584702002/363101865 = 1.610297435 This value is very close with Phi the Golden ratio, the error is: Phi-1.610297435 = 0.007736554.
Similarly, the ratio between the whole of the 8 octaves (947803867) and the form of the 3 significant octaves (363101865) is:
947803867/363101865 = 2.610297435.
This value is very close Phi*2 = 2.61803399.
The reader may verify that the same calculation is performed by selecting the maximum values in each of the three redundant sets or the mean value leads to near results.
So we come to this fascinating result: It was thought for many years that significant “form” encoding human life is reduced to 2% to 5% of the DNA encoding genes. Then, the scientific world gradually discovered that 98% of junk DNA (i.e. the “substance”) had a function, particularly in the case of cancer cells [18,19]... We could then say that of the entire DNA housed in genomic DNA, the substance corresponds to 98% (junk-DNA), while the form consists of 2% housed in genes. What we find here forces us to revisit the fundamental question beyond redundancy of information in the DNA in general and in the human genome specifically. Indeed it appears that only THREE of the EIGHT octaves convey enough of any meaningful information. The other remaining FIVE octaves are repeating—like a sort of harmonic wave-form-like “echo” [20]—the same modulated
information. What we find there is another “partition” between the substance and the form, controlling the entire human genome: the billion codons forming our singlestranded DNA genome, when partitioned according to the eight octaves through the matrix of the universal genetic code table, bring out a harmonic structure which can be summarized as follows:
Eight (8) octaves are divided into three (3) Form octaves and Five (5) Substance (background) octaves.
The ratio of substance over form is adjusted to the Golden ratio Phi.
The ratio of whole over the form is adjusted to the square of the Golden ratio Phi * 2.
This is absolutely fascinating ... like described in the Douglas Hofstadter’s major book “Godel, Escher, Bach” [21], the great painter M. C. Escher who, after Kurt Godel in Mathematics, Jean-Sébastien Bach in music, had the genius to think about the paradoxical relationship of substance and form (Figure 1) in painting [22]! “The form and substance” here is the next step in our long research path for over 24 years running between DNA, Golden ratio, genomes and Fibonacci numbers [23-29]... Phi the Golden ratio, are Human and Nautilus very close? Although not a Golden spiral, the shape of the Nautilus shell exhibits multiple Golden ratio harmonics in its design [30], The Human genome too?
6. Acknowledgements
First, best thanks to 2008 Medicine Nobel prize Professor Luc Montagnier and his UNESCO foundation team that helped to promote the publishing of this article—Pr Luc Montagnier, President Fondation Mondiale Recherche et Prévention SIDA UNESCO 1, rue Miollis 75732 Paris Cedex 15
Web site: http://montagnier.org/index.php
Thanks to Sergey Petoukhov (Biophysics, Biomathematics, Gold medal of the Exhibition of Economic Achievements of the USSR, Academician, Moscow University Russia), György Darvas (Interdisciplinary research, Institute for Research Organization of the Hungarian Academy of Sciences, Budapest Hungary), Négadi Tidjani (computational chemistry, Oran University Algeria), Joost Gielen (Physics, Netherlands), Andras J. Pellionisz (Fractal Genomics, Silicon valley USA), Jordi Solà Soler (Biomedical signal processing, IBEC Barcelona Spain), Perry Marshall (Internet google adwords pioneer, Chicago USA) and Claudio Martinez Debat (Biology, espacio interdisciplinario, Universitad de la Republica Montevideo Uruguay [31]) for various informal discussions on this topic.
Thank Richard Morgan (English Professor, Toulouse University France), Delphine Gabillard (Biostatistician, Bordeaux University France), Robert Friedman MD (Nutritional Medicine and Golden ratio writer, http://goldenratiolifestyle.com, Santa Fe, New Mexico USA [30]), and artist Aya (sacred geometry, Sedona Arizona USA [32]) for English language help.
Strong thanks to individual genomics pioneer Professor George Church (http://arep.med.harvard.edu/gmc, MIT, Boston University, Cambridge University, UK) for his highly critical analysis reviewing of this paper, particularly on the human genome 13 and 2 numerical ratios possible understanding and explanations.
REFERENCES
- S. V. Petoukhov and V. I. Svirin, “Fractal Genetic Nets and Symmetry Principles in Long Nucleotide Sequences,” Symmetrion, Vol. 23, No. 3-4, 2013, pp. 303-322 http://symmetry.hu/scs_online/SCS_23_3-4.pdf
- J. C. Perez, “Codex Biogenesis,” 2009. https://sites.google.com/site/codexbiogenesis
- International Human Genome Project Sequencing Centers and Verified by NCBI and UCSC, “Human Genome Finalized BUILD34. Build 34 Finished Human Genome Assembly,” 2003. http://genome.ucsc.edu/FAQ/FAQreleases.html
- A. J. Pellionisz, R. Graham, P. A. Pellionisz and J. C. Perez, “Recursive Genome Function of the Cerebellum: Geometric Unification of Neuroscience and Genomics,” In: M. Manto, D. L. Gruol, J. D. Schmahmann, N. Koibuchi and F. Rossi, Eds., Handbook of the Cerebellum and Cerebellar Disorders, 2012, pp. 1381-1423. http://fr.scribd.com/doc/111439455/BOOK-Unification-of-Neuroscience-and-Genomics-Pellionisz-Et-Al-in-Section-4
- J. C. Perez, “Decoding Non-Coding DNA Codes: Human Genome Meta-Chromosomes Architecture,” BIT Life Sciences’ 3rd Annual World Vaccine Congress, Beijing, 23-25 March 2011. http://fr.scribd.com/doc/57828784/jcperezBeijing032011
- Website Dedicated to DNA Pioneers, “Chargaff in Linus Pauling and the Race of DNA”. http://osulibrary.oregonstate.edu/specialcollections/coll/pauling/dna
- G. Bernardi, Website Dedicated to Pr Bernardi Research. http://www.giorgiobernardi.it
- G. Bernardi, “Isochores,” In: Encyclopedia of Life Sciences, John Wiley and Sons, Ltd., Chichester, 2012. http://onlinelibrary.wiley.com http://dx.doi.org/10.1002/9780470015902.a0005003.pub2
- R. Durbin, “The 1000 Genomes Project,” Wellcome Trust Sanger Institute, 2012. http://www.1000genomes.org
- Morrisson Institute for Population and Resources Studies (Stanford University), “Stanford Human Genome Diversity Project,” 2011. http://hsblogs.stanford.edu/morrison/human-genome-diversity-project
- L. Luca Cavalli-Sforza, “Opinion: The Human Genome Diversity Project: Past, Present and Future,” Nature Reviews Genetics, Vol. 6, No. 4, 2005, pp. 333-340. http://dx.doi.org/10.1038/nrg1596
- C.-T. Zhang, R. Zhang and H.-Y. Ou, “The Z Curve DataBase: A Graphic Representation of Genome Sequences,” Bioinformatics, Vol. 19, No. 5, 2002, pp. 593-599. http://bioinformatics.oxfordjournals.org/content/19/5/593.full.pdf http://dx.doi.org/10.1093/bioinformatics/btg041
- J. C. Perez, “Codon Populations in Single-Stranded Whole Human Genome DNA Are Fractal and Fine-Tuned by the Golden Ratio 1.618,” Interdisciplinary Sciences: Computational Life Sciences, Vol. 2, No. 3, 2010, pp. 1-13. http://www.ncbi.nlm.nih.gov/pubmed/20658335 http://fr.scribd.com/doc/95641538/Codon-Populations-in-Single-stranded-Whole-Human-Genome-DNA-Are-Fractal-and-Fine-tuned-by-the-Golden-Ratio-1-618
- J. Sola-Soler, “Phi and Music in DNA,” 2012. http://www.sacred-geometry.es/en/content/and-much-more?q=en/content/phi-and-music-dna
- J. Gielen, “The Story of Just Not PI, Archimedes Was Too Fast,” 2013. http://quarks-divided.over-blog.fr
- P. Marshall, “Checksum Discovered in DNA (The Mathematics of DNA),” 2012. http://shiftfrequency.com/perry-marshall-checksum-discovered-in-dna-the-mathematics-of-dna-thankstobin
- N. Tidjani, “A Quantum-Like Approach to the Genetic Code,” Neuroquantology, Vol. 9, No. 4, 2011, pp. 785- 798.
- J. C. Perez, “Chromosome 4: Breakthoughs in Evolution, Longevity and Cancers,” Unpublished, 2013.
- T. Bardini, “JUNKware,” University of Minesota Press, Minneapolis, 2011. http://books.google.fr/books?id=7hZDllG70OYC&pg=PA94&lpg=PA94&dq=junkware+perez&source=bl&ots=TAzccafYzh&sig=gMlTdyjKkvBuNnS-gdLNsvfjbK0&hl=en&sa=X&ei=C3DWUfa0B4-KhQe3y4CADQ&ved=0CC4Q6AEwAA#v=onepage&q=junkware%20perez&f=false
- L Montagnier, et al., “DNA Waves and Water,” Journal of Physics: Conference Series, Vol. 306, 2011, Article ID: 012007. http://dx.doi.org/10.1088/1742-6596/306/1/012007
- D. Hofstadter, “Godel Escher Bach,” 1979. http://en.wikipedia.org/wiki/G%C3%B6del,_Escher,_Bach
- M. C. Escher, “Bond of Union 1956 Lithograph”. http://www.mcescher.com
- P. Marcer, “Communications: Order and Chaos in DNA —The Denis Guichard Prizewinner: Jean-Claude Perez,” Kybernetes, Vol. 21, No. 2, 1992, pp. 60-61. http://dx.doi.org/10.1108/eb005922
- J. C. Perez, “Chaos, DNA and Neuro-Computers: A Golden Link,” Speculations in Science and Technology, Vol. 14, No. 4, 1991, pp. 336-346. http://golden-ratio-in-dna.blogspot.fr/2008/01/1991-first-publication-related-to.html
- J. C. Perez, “L’ADN Décrypté,” 1997. http://www.resurgence.be/91-adn-decrypte-9782872110179.html http://www.amazon.co.uk/LADN-d%C3%A9crypt%C3%A9-d%C3%A9couverte-preuves-langage/dp/2872110178
- J. C. Perez, “Scale Invariance Embedded Votes and SelfEmerging Binary Logics in the Whole Human Genome,” 2008, Relating the Paper: What Is Complexity? By P. M. Gell-Mann, Complexity, Vol. 1, No. 1, 1995, pp. 16-19. http://www.scribd.com/doc/68476137/JcperezLiveBitsFromDNA-from-John-NASH-Logics-to-J-C-PEREZ-FractalsBiomathematics
- J. C. Perez, “Golden Ratio and Numbers in DNA,” 2008. http://golden-ratio-in-dna.blogspot.fr
- J. C. Perez, “Various Other Publications,” 2013. http://fr.scribd.com/jean_claude_perez/documents
- J. C. Perez, “Caminos Interdisciplinarios,” Espacio Interdisciplinario, Seminario en_clave Inter, Universitad de la Republica, Montevideo, Uruguay, 26-28 Octubre 2011. http://fr.scribd.com/doc/72147501/jcperezFINALpapermontevideo
- R. Friedman and M. Cross, “The Golden Ratio § Fibonacci Sequence: Golden Keys to Your Genius, Health, Wealth § Excellence,” Hoslin Media Company Stanford US, 2013, pp. 579-598. http://www.amazon.com/The-Golden-Ratio-Fibonacci-Sequence/dp/1939623006
- Claudio Martinez Debat, “ADN y Arte Transgenico,” 2013. https://www.youtube.com/watch?v=QvvpvWlwSrA
- Aya, “School of Sacred Geometry,” 2012. http://www.schoolofsacredgeometry.org
NOTES
*Retired Interdisciplinary Researcher.
[#] “1”, “2” and “Phi the golden ratio” are the 3 genomic numbers characterizing codon populations of the whole human genome.