Applied Mathematics
Vol.3 No.12(2012), Article ID:25345,6 pages DOI:10.4236/am.2012.312254
A Simulation Model for Arrangements of Ophthalmic Beds
1Department of Basic Course, Air Force Logistics College, Xuzhou, China
2Department of Aviation Ammunition, Air Force Logistics College, Xuzhou, China
3Aerial Four Station Department, Air Force Logistics College, Xuzhou, China
Email: liuman8866@163.com
Received August 26, 2012; revised November 20, 2012; accepted November 28, 2012
Keywords: Mathematical Modeling; Bed Arrangement; Information Matrix; Priority Vector
ABSTRACT
A simulation algorithm concerning problem B of 09 CUMCM is given. By introducing the concept of bed vector, clinic matrix, arrangement matrix and priority vector, the information about clinic, bed and arrangement will be stored and analyzed via MATLAB. By the algorithm the continuously updating of data has been simulated successfully.
1. Introduction
Hospital bed is an important health resources for hospital, also, the usage is an important indicator reflecting hospital efficiency, and it is one important content of hospital quality and management efficiency, at the same time, the service efficiency of hospital bed is directly related to the operating income of hospital. Reasonably comprehensive evaluation to the usage of hospital beds is the reference for hospital manager to reinforce management, distribute beds reasonably and improve efficiency in the use of hospital beds. Consequently, by analyzing the use of beds reasonably, shortening the patient’s invalid length of hospital stay. To boost the economic benefits of the hospital, improve the management in the ward, enhance the ability of hospital service and so on, all are very important.
2. The Analysis of the Problems
We note that the key of the problem is not only determined by the reasonable queued way, but also known how much of empty bed in a day. The corresponding information of queue and bed will be changed after arranging a patient, so we will calculate the patient’s discharge time randomly, at the same time this information will influence waiting time of discharge from the hospital behind. It is a process of updated information constantly. It is impossible to calculate by hand, we design the algorithm. By computer the arrangement to the hospital is automatical and can get the outpatient service time.
3. Establishment and Solution for the Model
3.1. Queuing Way
Patients were divided into five: cataract patients, Cataract eyes patients, glaucoma patients, retina patients and trauma patients, the proportion can refer to Table 1.
By data analysis we find there are many patients who have long time in hospital. It not only occupies resources, but also wastes the patient’s money, it is not appropriate. So we consider reasonable arrangement should reduce the average queuing time, the queuing time is the days from consulting hours to operation time, at the same time it can reduce invalid length of hospital stay.
Considering the different patients have different priority. 44.21% of patients is cataract, and this kind of patient can do surgery on Monday and Wednesday only. So if arrangement is not timely can cause long latent period and reduce the patient’s satisfaction.
According to the topic, cataract surgery can do on Monday and Wednesday. The first operation on cataract eyes do on Monday, second operation do on Wednesday. We can find if cataract eyes miss time, will wait for the longest cycle.
In fact according to the operation time, the patients are divided into cataract and other eye disease mainly. Cataract can do on Monday and Wednesday, while the other eye disease can do on other time. In addition, we consider to reduce the average queuing waiting time. If a class of postoperative patients stay longer, they should be in the back row at the same circumstances. For example, there is a queue for its service time: 10,1,1,1. We may calculate the average waiting time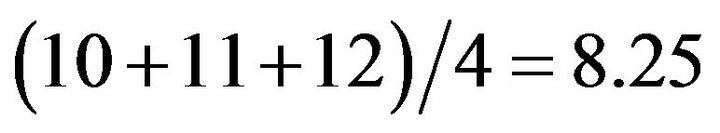 . If we exchange the stream-flood 1,1,1,10, then the average

Table 1. The proportion of different patients.
waiting time is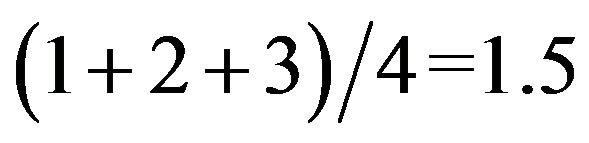 . So we can see that the efficiency is greatly raised. Based on the statistical data we have five patients postoperative hospitalization time is respectively: cataract 2.94 days, cataract eyes 4.96 days, glaucoma 8.07 days, retinal 10.16 days, Trauma 6.03 days. Accordingly we consider a week in the different time, arrangement of priority is different. We can see from Table 2.
3.2. Basic Information Matrix
By reading topic data, we get the basic information matrix from all kinds of patients. We save the topic data to TXT file according to different kinds of patients in excel and read and dispose via matlab [1].
Considering the different times in a week, The July 13 (via checking for Sunday) as the system, “0”, so the treatment to weeks is convenient. We can make sure the time by use for seven more than take operation. One of the numerical representative from the system after the start of “0”, the first day. Such as 24 representative system, 24. So the date processing will greatly facilitate.
For example, cataract eyes information matrix can be seen from Table 3:
Through the matrix we can calculate patients waiting time from outpatient service to the operation and postoperative hospital stays.
3.3. Computing the Patients’ Discharge Time by Stochastic Simulation
On the base of basic information matrix we obtain the data of all kinds of the patient’s postoperative hospitalization duration, These data have some statistical regularity, we can draw the frequency histogram of the patients who operate on the cataract eyes.
First, from Figure 1 and by reading the admission and discharge information of the first batch of data (a total of 349 data), it is clearly observed from the graph that the cataract eyes postoperative hospitalization time obey the law of normal distribution approximately. The mean and variance are respectively 2.9634 and 0.5972, using stochastic simulation for the second batch of data postoperative hospital stay (average three days or so).
3 3 4 3 3 4
3 3 3 3 3 4
3 4 4 3 3 2
4 3 2 3 As well we obtain the hospital stays for the cataract eyes operation (average three days or so)
4 3 3 2 3 2 3 the hospital stays for glaucoma surgery (average eight days or so)
9 7 9 9 9 10 9 10 6 (nine data)
the hospital stays for postoperative retinal (average ten days or so)
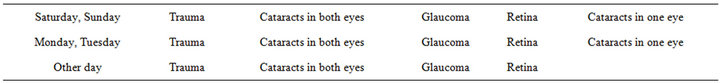
Table 2. The arrangement in a week.
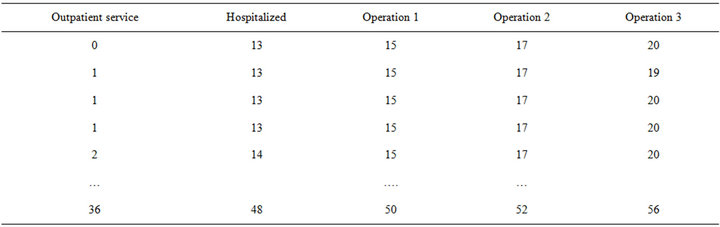
Table 3. Cataract eyes information matrix.
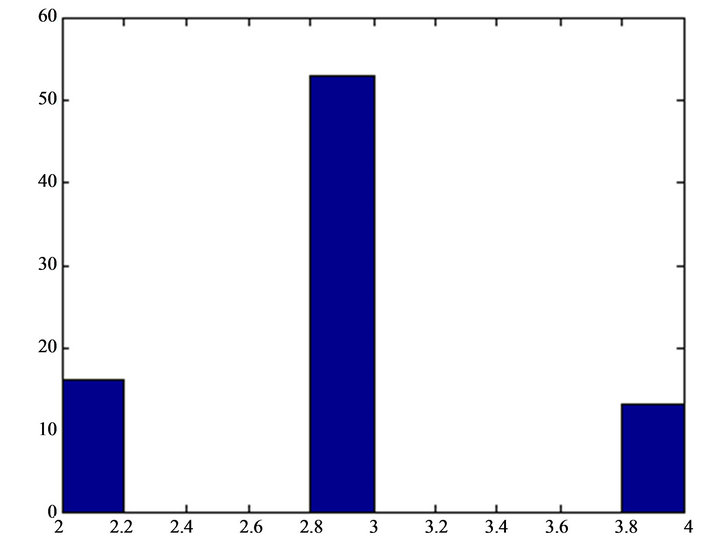
Figure 1. Hospital stays after the surgery of cataract eyes function.
10 10 6 11 8 14
8 11 11 8 5 10
8 12 11 14 12 9
11 8 10 10 10 9
13 6 11 12 12 12
10 12 12(33 data)
the hospital stays for trauma surgery
5 7 8 8
4 6 6 4 (eight data)
3.4. Admission Vector and Discharge Vector
Admission time Discharge time
2008-7-14 2008-7-19
2008-7-25 2008-8-8
2008-7-25 2008-7-31
2008-7-25 2008-8-4
2008-7-25 2008-8-5
2008-7-26 2008-8-11
………….
Second, converting them into system time (portion)
1 6
12 26
12 18
12 22
12 23
13 29
…………
Third, we calculate the system discharged time of the second patient (operation time adds post-operation hospitalization duration).
Four, by reading the admission time and converting them into system time.
Five, figuring out the admission and discharge stream of patients.
In =
0 1 0 0 1 1 2
1 2 2 1 2 4 8
11 11 9 9 8 7 12
6 6 5 9 8 15 20
9 6 2 6 9 8 13
6 4 7 10 4 8 18
11 6 3 8 12 10 14
2 6 2 5 9 13 17
10 4 5 13 7 0 0
0 0 0 0 0 0 0
0 0 0 0
out =
0 0 0 0 0 0 1
0 0 1 0 0 2 1
1 3 2 5 1 3 5
2 2 4 8 7 15 20
8 6 2 6 9 8 13
6 4 7 10 4 8 18
11 6 3 8 12 10 14
2 6 2 5 9 13 17
10 4 5 16 10 4 14
8 5 3 6 5 7 8
3 2 2 4
in(i) denotes the number of people who are admitted to hospital on i-1 day, out(i) denotes the number of people who are discharged on i-1 day.
From Figure 2 and the data of admission to hospital and discharge from hospital : there have a spare bed from 59 day, the bed vector are as follows:
Bed =
3 3 4 14 8 5 3
6 5 7 8 3 2 2
3.5. Outpatient Information Matrix
The patients who are not arranged: Cataract 21, Cataract eyes 29, Glaucoma 15, retina 35, trauma 1![]() ,
,  denotes the number of the first j types of patients on
  day(from August 30, i.e., the system time 48th day)
0 2 1 3 0
2 1 2 3 0
1 3 1 5 0
3 1 0 1 0
2 1 0 5 0
1 3 4 5 0
1 7 1 1 0
0 2 1 1 0
0 1 0 2 0
4 1 0 3 0
2 0 2 1 0
4 3 1 1 0
1 4 2 4 1
3.6. The Arrangement of Bed
On the base of the clinic information matrix and bed vector, we may arrange bed by the priority of queue, i.e., first come, first serve. The specific algorithm is as follows:
The related variables: i—Clinic date-47 j—The first j types of patients t—The current arrangement date-58 snew: total number of patients who are hospitalized on t day latest sold: total number of patients who are hospitalized on t day after the end of a column
 : recording the number of each patients who are hospitalized on t day a: clinic matrix Bed: bed vector
 : arrangement matrix Algorithm steps:
Beds arranged on the t day: the t day is the k = t + 58 day in the system.
In order to call the different processing subroutine we judge the k day is which day in a week.
One of the processing procedure is as follows, other processing subroutines are similar, but j is different on priority.
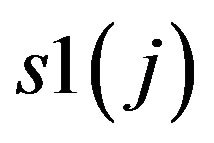
(1) Initializing: let snew = sold = 0, s1 = 
(2) by priority let 
(3) I = 1
(4) if i + 47 < k and  then (5), if not, then (2)
(5) if  = 0 then (9), if not ,then(6)
(6) if , then (7), if not, then (8)
(7)


Figure 2. Discharge & admission streaming functions.
Then (10)
(8)


Then (9)
(9) i = i + 1
(10) if snew − sold = 0, if yes, then (11), if not, then (2)
(11) = snew − sold sh is fitting postoperative hospital stay randomly according to j.

sold = snew
(12) if ==0, if yes, end, if not, then (2)
The operation results are as follows:
Hospital arrangement matrix p(:,:,1) =
0 0 0 0 0 0 0 0 0 0 0
0 0 0 0 0 2 0 0 0 0 0
0 0 0 0 0 1 0 0 0 0 0
0 0 0 0 0 2 1 0 0 0 0
0 0 0 0 0 0 2 0 0 0 0
0 0 0 0 0 0 1 0 0 0 0
0 0 0 0 0 0 1 0 0 0 0
0 0 0 0 0 0 0 0 0 0 0
0 0 0 0 0 0 0 0 0 0 0
0 0 0 0 0 0 1 0 0 0 3
0 0 0 0 0 0 0 0 0 0 2
0 0 0 0 0 0 0 0 0 0 4
0 0 0 0 0 0 0 0 0 0 1
p(:,:,2) =
0 0 0 2 0 0 0 0 0 0 0
0 0 0 1 0 0 0 0 0 0 0
0 0 0 3 0 0 0 0 0 0 0
0 0 0 1 0 0 0 0 0 0 0
0 0 0 1 0 0 0 0 0 0 0
0 0 0 3 0 0 0 0 0 0 0
0 0 0 3 4 0 0 0 0 0 0
0 0 0 0 2 0 0 0 0 0 0
0 0 0 0 1 0 0 0 0 0 0
0 0 0 0 1 0 0 0 0 0 0
0 0 0 0 0 0 0 0 0 0 0
0 0 0 0 0 0 0 0 0 3 0
0 0 0 0 0 0 0 0 0 3 1
p(:,:,3) =
1 0 0 0 0 0 0 0 0 0 0
2 0 0 0 0 0 0 0 0 0 0
0 1 0 0 0 0 0 0 0 0 0
0 0 0 0 0 0 0 0 0 0 0
0 0 0 0 0 0 0 0 0 0 0
0 2 2 0 0 0 0 0 0 0 0
0 0 1 0 0 0 0 0 0 0 0
0 0 0 0 0 0 0 1 0 0 0
0 0 0 0 0 0 0 0 0 0 0
0 0 0 0 0 0 0 0 0 0 0
0 0 0 0 0 0 0 2 0 0 0
0 0 0 0 0 0 0 1 0 0 0
0 0 0 0 0 0 0 2 0 0 0
p(:,:,4) =
0 0 0 0 0 0 0 3 0 0 0
0 0 0 0 0 0 0 3 0 0 0
0 0 0 0 0 0 0 5 0 0 0
0 0 0 0 0 0 0 1 0 0 0
0 0 0 0 0 0 0 5 0 0 0
0 0 0 0 0 0 0 0 5 0 0
0 0 0 0 0 0 0 0 1 0 0
0 0 0 0 0 0 0 0 0 1 0
0 0 0 0 0 0 0 0 0 2 0
0 0 0 0 0 0 0 0 0 3 0
0 0 0 0 0 0 0 0 0 1 0
0 0 0 0 0 0 0 0 0 1 0
0 0 0 0 0 0 0 0 0 4 0
p(:,:,5) =
0 0 0 0 0 0 0 0 0 0 0
0 0 0 0 0 0 0 0 0 0 0
0 0 0 0 0 0 0 0 0 0 0
0 0 0 0 0 0 0 0 0 0 0
0 0 0 0 0 0 0 0 0 0 0
0 0 0 0 0 0 0 0 0 0 0
0 0 0 0 0 0 0 0 0 0 0
0 0 0 0 0 0 0 0 0 0 0
0 0 0 0 0 0 0 0 0 0 0
0 0 0 0 0 0 0 0 0 0 0
0 0 0 0 0 0 0 0 0 0 0
0 0 0 0 0 0 0 0 0 0 0
0 0 1 0 0 0 0 0 0 0 0
p(i,t,j) denotes the number of the j class of patients who are in hospital on the i + 47 day. By the above results we obtain the distribution of beds is as follows.
From Table 4 it is easy to shorten the invalid hospital stays by adjusting the admission date and keeping the waiting time. If we arrange 14 patients on the 62 day in system date to be hospitalized on the 63 day, on the other hand cataract patients on the 64 day in system date are arranged on the 65 day, at the same time cataract patients on the 68, 69 day in system date are arranged on the 70 day, other dates remain unchanged. Then the invalid hospitalization stays in the whole system are 0, waiting time is 11.48 average.
4. The Evaluation of Model
From Figure 3 we can know Outpatient service has not

Table 4. The distribution of beds.
Figure 3. Moving average of outpatient service flow function.
decreased, conversely the average waiting time taken by patients has lessened from 13.41 to 11.48, and the invalid hospital stays have reduced to zero.
For question four, we can modify the priority vector j in algorithm, at the same time we amend k, i.e., when k divides 7, and the remainder is 0 or 6, then we may turn to the next process directly.
5. Conclusion
In this paper we use queuing theory and stochastic simulation, according to the kind of patients we sort the data of topic in Excel, then save them to TXT, after that read in MATLAB, at last dispose and obtain the basic information matrix of all kinds of patients. By modifying the priority vector of arithmetic, we can reduce the invalid hospitalization time to zero, and achieve the most optimal evaluation index.
REFERENCES
- Y. L. Wang, “MATLAB Program Design,” Electronic Industry Press, Beijing, 2004.