Advances in Bioscience and Biotechnology
Vol. 4 No. 7 (2013) , Article ID: 34655 , 13 pages DOI:10.4236/abb.2013.47103
Selective and constructive mechanisms contribute to neural circuit formation in the barrel cortex of the developing rat
![]()
1División de Estudios de Posgrado e Investigación, Facultad de Odontología, Universidad Nacional Autónoma de México, Mexico City, Mexico
2Cell Biology and Physiology Department, Instituto de Investigaciones Biomédicas, Universidad Nacional Autónoma de México, Mexico City, Mexico
3Unidad de HPLC, Instituto de Investigaciones Biomédicas, Universidad Nacional Autónoma de México, Mexico City, Mexico
Email: *euquerol@comunidad.unam.mx
Copyright © 2013 Eileen Uribe-Querol et al. This is an open access article distributed under the Creative Commons Attribution License, which permits unrestricted use, distribution, and reproduction in any medium, provided the original work is properly cited.
Received 26 May 2013; revised 28 June 2013; accepted 7 July 2013
Keywords: Barrel Cortex; Synaptogenesis; Axonal Growth; Dendritic Growth; Thalamocortical Pathway
ABSTRACT
The cellular strategy leading to formation of neuronal circuits in the rodent barrel cortex is still a matter of controversy. Both selective and constructive mechanisms have been proposed. The selective mechanism involves an overproduction of neuronal processes and synapses followed by activity dependent pruning. Conversely, a constructive mechanism would increase the number of axons, dendrites, and synapses during development to match functionality. In order to discern the contributions of these two mechanisms in establishing a neuronal circuit in the somatosensory cortex, morphometric analysis of dendritic and axonal arbor growth was performed. Also, the number of synapses was followed by electron microscopy during the first month of life. We observed that axonal and dendritic arbors retracted distal branches, and elongated proximal branches, resulting in increased arbor complexity. This neuronal remodeling was accompanied by the steady increase in the number of synapses within barrel hollows. Similarly, the content of molecular markers for dendrites, axons and synapses also increased during this period. Finally, cytochrome oxidase activity rose with age in barrels indicating that the arbors became more complex while synapse density and metabolic demands increased. Our results support the simultaneous use of both selective and constructive mechanisms in establishing the barrel cortex circuitry.
1. INTRODUCTION
During the ontogeny of the nervous system, axonal and dendritic branches, as well as synapses, are thought to be formed in numbers that far exceed the amount required by the mature brain to function properly. The predominant theory for neuronal circuit formation is the selective mechanism, which states that a period of overproduction of neuronal processes and synapses is followed by the elimination of a significant fraction of them. This process of elimination is driven by competition. Axons or dendrites compete for synaptic partners that may provide neurotrophic factors in sufficient amount to consolidate synapses and retain their partners [1]. Axonal and dendritic branches that establish synaptic-like contacts with incorrect partners are eliminated because they do not receive enough trophic support. Even though the notion described above constitutes the dominant view about how the developing brain sculpts its circuitry, increasing anatomical evidence supports that the selective mechanism is not a universal rule. Indeed, anatomical evidence gathered during the development of different brain structures indicates that axons may grow towards and within their targets by preferentially adding branches with a high degree of precision until they attain their adult size [2]. Similarly, multiple reports also support the notion that the dendritic arbors of some classes of neurons also develop preferentially by adding individual branches until they reach their adult configuration [3]. The rodent primary somatosensory cortex (S1) processes tactile information and contains a representation of the body formed by modules called barrels. Each barrel contains an anatomical map that represents collections of mechanosensory receptors distributed throughout the body.
The barrel field is a great tool for understanding how circuits are constructed [4]. Barrels primarily contain thalamic afferents from neurons of the ventro postero medial (VPM) nucleus and dendrites of the spiny stellate neurons located in cortical layer IV. The axons arising from neurons in the ventral posterior complex of the thalamus project to cortical neurons located primarily in layer IV of the somatic sensory cortex. Interestingly, both glutamatergic and GABAergic synapses increase their numbers during the first month of life [5-7]. In addition, there is no evidence of synapse elimination in S1 from the first month of life throughout adulthood [5-7]. Therefore, it is plausible that other mechanisms contribute to neuronal circuit formation in S1. A possible alternative is the constructive mechanism which states that axons, dendrites, and synapses increase in number during development. According to this model, the number of neural process and synapses should not decrease because there is not elimination of unsuccessful branches. Previous studies, aimed at unraveling the strategy used by S1 elements to establish synaptic connections, have reached conflicting conclusions. While some groups support a selective mechanism [8,9], others suggest a constructive mechanism [10-12]. In order to get an insight into which of these two possible mechanisms is used for establishing the neuronal circuit from the VPM thalamic nuclei to the rodent primary somatosensory cortex, the dendritic and axonal morphology was analyzed, and the number of synapses was determined at different times during the first month of life. In addition, fractal dimension analysis was also performed to quantify morphological complexity. Finally, the expression of molecular markers for dendrites, axons and synapses was also followed by immunocytochemistry and Western blot. The aim of our work was to simultaneously study the development of the three major components of the neuronal arbor: the axons, dendrites and synapses. Through these analyses we were able to identify different stages of the thalamocortical pathway construction in the barrel cortex.
2. MATERIALS AND METHODS
2.1. Animals
Wistar rats were raised at the animal facility of Instituto de Investigaciones Biomédicas, Universidad Nacional Autónoma de México. Litters were adjusted to eight pups each and were weaned at postnatal day 21. Rats were housed with free access to food (Sani-Chips, Harlan Teklad, IN) and water in rooms with controlled temperature and lighting. Animal handling and experimental procedures were conducted according to the Guide for the Care and Use of Laboratory Animals [13]. Experimental protocols were also approved according to the guidelines of Lineamientos para el cuidado y uso de animales de laboratorio published by Instituto de Investigaciones Biomédicas.
2.2. Dendritic Morphology
At postnatal day 5, 10, 15, 20, 25 and 30, rats were euthanized with pentobarbital (45 mg/kg of body weight; Pet´s Pharma, Nezahualcoyotl, Estado de México, Mexico). Euthanized rats were decapitated and their brains were rapidly dissected, immersed in a Golgi-Cox solution to stain neurons, and kept in light-protected jars for three months at room temperature [14]. After this period, 120 μm vibratome (Campden Instruments; WPI, Berlin, Germany) coronal slices were obtained, dehydrated, cleared and placed onto gelatin coated slides, and sealed with a coverslip using Cytoseal 60 (Richard-Allan Scientific, Kalamazoo, MI). Stained cortical layer IV spiny stellate neurons were drawn with the aid of an Optiphot brightfield microscope equipped with a camera lucida (Nikon; Tokio, Japan). Drawings were scanned and digitalized with a scanner model Lexmark X75 at 1200 dpi (Lexmark International de México, S de R.L. de C.V. Mexico City). Digital images were then used to perform a morphometric analysis by counting the total branch number and total branch number per order. Throughout the paper, dendritic branches that grow from the soma are called first order branches, the branches that emerge from the first order ones are called second order branches and so on. The total branch length and total length per branch order were also measured manually by tracing individual branches. Morphometric analyses were carried out using the software Scion Image (Beta 4.0.2 ScionCorp, MD). Values obtained for each parameter were compared statistically among different age groups by using Kruskal-Wallis ANOVA and Tukey post-hoc tests (Sigma Stat 3.0, Systat Software Inc.; San Jose, CA). Differences were considered statistically significant at p < 0.05 values. In addition, to evaluate dendritic arbor complexity, a fractal dimension analysis was performed following the box counting method with the software Harmonic and Fractal Image Analyzer (Version 5.0; HarFa, Brno, Czech Republic, downloaded from http://www.fch.vutbr.cz/lectures/imagesci/). Measuring the fractal dimension is another way in which lengthrelated measurements can distinguish between two objects that have the same linear length but are structurally different [15].
2.3. Axonal Morphology
Wistar rats were euthanized and perfused with saline (0.15 M NaCl) followed by a fixative solution containing 4% paraformaldehyde (Sigma-Aldrich, Saint Louis, MO) and 0.5% glutaraldehyde (Sigma-Aldrich) in 0.1 M phosphate buffer, pH = 7.4. After decapitation, heads were placed in amber jars containing the same fixative solution. These jars were kept protected from light at room temperature for a week. Solutions of 0.5 μl of 0.025% DiI (1,1’-dioctadecyl-3,3,3’,3’ tetramethylindocarbocyanine perchlorate) from Molecular Probes (Eugene, OR) dissolved in ethanol were injected stereotaxically into the ventrobasal complex of the thalamus, while avoiding crossing over into the somatosensory cortex. Heads were then placed back into the same jars. In heads from younger animals (postnatal days 5, 10 and 15), proper DiI labeling was obtained after two months. In heads from older animals, it was necessary to allow dye diffusion for up to nine months. At the end of the dye diffusion-time, brains were collected and were then transected along a plane at 45 degrees to the brain base. Sections of 200 μm from the barrel field were obtained using a vibratome (Campden Instruments, WPI; Berlin, Germany). Sections were placed onto gelatin-coated slides and mounted with glycerol (Sigma-Aldrich). Barrels of the postero-medial subfield were identified and individual axonal arbors within them were drawn with the aid of a camera lucida. Because axons at postnatal day 25 were highly complex, they were reconstructed using a LSM 5 Pascal scanning confocal microscope (Zeiss MicroImaging, Inc.; Overkochen, Germany). The image stacks were later used to generate two-dimensional reconstructions. All drawings were scanned, digitized and analyzed as described above for dendrites. The values obtained for each parameter were compared among different age groups by Kruskal-Wallis ANOVA followed by Dunn’s post-hoc test (Sigma Stat 3.0, Systat Software Inc.; San Jose, CA). Differences were considered statistically significant at p < 0.05 values.
2.4. Synapse Density
Wistar rats from postnatal days 5, 15 and 30 were euthanized and perfused with saline solution followed by Karnovsky’s fixative (5% glutaraldehyde EM grade, 4% formaldehyde in 0.08 M sodium phosphate buffer). Brains were obtained and cortices dissected, flattened and placed for at least 24 hours at 4˚C in fixative solution. Vibratome tangential sections (200 - 250 μm) were cut and used to identify C3 and D3 barrels of the postero-medial barrel subfield by trans-illumination under a dissecting microscope (M420 Stereomicroscope. Leica Microsystems; Wetzlar, Germany). Once identified, barrels were dissected using a 2 mm diameter dissecting needle as previously reported [16]. Tissue slabs were placed in Karnovsky’s fixative for 24 h, washed three times with sodium carcodylate buffer 0.1 M, for 1 h at 4˚C and then in 1% osmium tetroxide (Sigma-Aldrich) for 1 h at 4˚C. After three rinses with water, tissue slabs were dehydrated with ethanol and then immersed in propylene oxide for 40 minutes. Finally tissue slabs were immersed in propylene oxide—Epon for 1 h, and then included in Epon (Electron Microscopy Sciences; Pennsylvania, USA). Tissue slabs were then cut using an ultramicrotome (Leica Ultracut EM UC6), and three ultrathin sections 65 μm apart from each other were mounted in formvar-coated grids (Electron Microscopy Sciences). This allowed sampling of each barrel at its upper, middle and lower levels. To avoid observer’s bias, Epon blocks containing the samples were coded, before being sectioned by a technician who was not involved in performing final observations and analyses. The average number of synapses per 100 square microns was then estimated.
2.5. Antibody Characterization
Source and properties of antibodies used in this paper are summarized in Table 1. The antibody against microtubule associated protein-2 (MAP2; Chemicon International Inc., Temecula CA) was used to analyze the developmental pattern of dendritic arbors of neurons at cortical layer IV. This antiserum recognized two bands of approximately 300 kDa by Western blot of rat cortex lysate. Labeling of cell bodies and neuropil by the anti-MAP2 antibody was consistent with the pattern observed in rat and chicken brains [17,18]. The rabbit anti-neurofilament antibody (Chemicon International) was used to analyze the development of thalamocortical afferents. The staining pattern was similar to patterns observed in previous studies of rat brain [19]. This antibody recognized a band of 150 kDa by Western blot analysis, and also labeled axonal terminals that innervate Merkel cells in rat skin
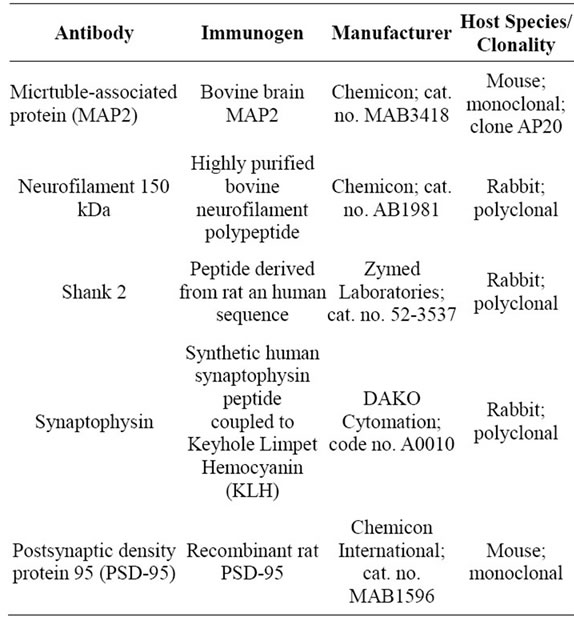
Table 1. Information of primary antibodies used.
(data not shown). To analyze the synaptogenic process during S1 development, we performed immunostaining against preand postsynaptic markers. The synaptophysin antibody (DAKO A/S, Glostrup, Denmark) reacted with a protein of 38 kDa band by Western blot analysis. The punctate labeling pattern obtained with the anti-synaptophysin antibody was similar to that obtained in neural cultures and in central nervous system [20,21]. The antibodies against the postsynaptic markers PSD 95 (Chemicon International) and Shank2 (Zymed Laboratories Inc., San Francisco, CA) also gave a punctuate pattern as described previously [22]. The antibody against PSD 95 recognized two bands around 100 kDa and a single band of 71 kDa in rat brain lysates.
2.6. Immunohistochemistry
Rats were euthanized and perfused with saline followed by 4% paraformaldehyde in phosphate-buffered saline, pH 7.4. Brains were dissected and postfixed in the same fixative for two hours at room temperature and cryoprotected with 20% sucrose (Sigma-Aldrich) in 0.1 M phosphate-buffered saline. Brains were then frozen in 2-methylbutane chilled on dry ice. Serial coronal slices (30 μm thick) were cut in a cryostat model CM 1510-3 (Leica). Free-floating slices were collected in blocking solution (3% bovine serum albumin, 0.1% triton X-100 and 0.025% sodium azide in phosphate buffered saline). Slices were incubated in blocking solution at 4˚C for 12 h and then incubated overnight with primary antibodies diluted in blocking solution, at 4˚C. The primary antibodies used were rabbit anti-rat/human Shank-2 at 1/200 dilution; rabbit antihuman synaptophysin at 1/5000 dilution; rabbit anti-bovine neurofilament 150 kDa or anti medium-sized neurofilament protein at 1/1000 dilution; and mouse anti-bovine microtubule-associated protein 2 a&b (MAP2a & b) (Chemicon International) at 1/1000 dilution. Next, slices were washed three times, 15 minutes each, with 0.1% triton X-100 in phosphate-buffered saline and then incubated with biotinylated goat antirabbit IgG or with goat anti-mouse IgG antibodies (1/500 dilution) at room temperature for 1.5 hours. After three more washes, slices were incubated for 1 hour with the avidin-peroxidase complex (VECTASTAIN® Elite ABC; Vector Laboratories, Inc. Burlingame, CA) at room temperature. Then, after three more washes slices were developed with diamobenzidine following the manufacturer’s instructions (VECTASTAIN® Elite ABC kit). Finally, slices were washed, mounted onto glass slides coated with gelatin, air dried, and sealed with a cover slip using Cytoseal 60 (Richard-Allan Scientific, Kalamazoo, MI). Images of the immunostained barrels were captured and digitized at 40× (for MAP2, and neurofilaments) or at 100× (for synaptophysin, and Shank-2) using a brightfield microscope (Axioskope, Zeiss MicroImaging, Carl Zeiss Microscopy, LLC, Thornwood, NY).
2.7. Western Blot
Cortices of euthanized rats were quickly removed, flattened and primary somatosensory cortex samples were obtained as previously described [23]. Samples were homogenized on ice by three 15 seconds pulses of sonication (Capitol Scientific, Inc., Austin, TX) in 200 μl lyses buffer (100 mM NaCl, 1% Triton X-100, 1 mM phenylmethylsulfonyl fluoride, 10 mM Tris-HCl, pH = 8.0) supplemented with protease inhibitors (Complete®; Roche Indianapolis, IN). Then, samples were centrifuged at 14000 rpm for 20 minutes at 4˚C in a refrigerated microcentrifuge model 5415 (Eppendorf, Hauppauge, NY). Supernatant was collected and protein concentration determined by the Bradford method (Bio-Rad, Richmond, CA). Proteins (20 μg protein/lane) were resolved by SDS-PAGE for MAP2 and neurofilaments as described previously or by Tris-Tricine electrophoresis for synaptophysin and PSD-95 as described previously [24,25]. Resolved proteins were then transferred to nitrocellulose membranes in a semidry blot chamber (Bio-Rad) for 30 minutes at room temperature. Membranes were then blocked with TTBS (0.15 M NaCl, 5% calcium-free milk, 20 mM Tris, 0.05% Tween 20, pH = 7.5) for 12 h at 4˚C. Membranes were then incubated overnight with antiMAP2 (1/1000), anti-neurofilaments (1/5000), antiPSD95 (1/500), or anti-synaptophysin (1/5000) antibodies at 4˚C. After washing with TTBS three times, 15 minutes each, membranes were incubated with the corresponding biotinylated secondary antibodies (1/500 dilution) for two hours at room temperature. Membranes were incubated with avidin-peroxidase complex for one hour at room temperature, washed with TTBS three times, 15 minutes each, and developed by chemiluminescence (ECL, Amersham-Pharmacia-Biotech, Buckingham-shire, UK). Images on films were digitized (Fluor-S Bio-Rad) and densitometry values were obtained using Quantity One software (Bio-Rad). Briefly, a rectangle was drawn over the background area of the film and then positive bands were outlined manually. The program calculated the absorbance values by subtracting the background from each positive band. For each neural marker, the absorbance values were expressed in the graphs relative to the absorbance at PD5 which was considered as one.
2.8. Cytochrome Oxidase Staining
Primary somatosensory cortex barrels were visualized by cytochrome oxidase staining as previously described [26]. Briefly, brain free-floating slices were incubated in cytochrome oxidase solution (0.05% diamobenzidine 0.03% cytochrome c, and 0.02% catalase in 0.1 M phosphate buffer) for four hours at 37˚C. The reaction was halted by washing three times with PBS. Slices were mounted onto glass slides coated with gelatin, air dried, and sealed with a coverslip using Cytoseal 60 (RichardAllan Scientific, Kalamazoo, MI). Images of the barrels were captured and digitized at 40× or 100× using a brightfield microscope (Axioskope, Zeiss MicroImaging). Captured images were used to evaluate the density of the staining (Scion Corp, Beta 4.0.2). Barrels were outlined manually and absorbance values were determined. A similar procedure was used for the corpus callosum. A relative estimation of the label intensity was calculated as follows: (a − b) × 100/b. Where a is the light transmittance of each barrel, and b is the light transmittance of the corpus callosum (background).
3. RESULTS
3.1. Dendrites of Spiny Stellate Neurons Increased Arbor Complexity While Remodeling within the First Month of Life
Dendrites of spiny stellate neurons within layer IV of the primary somatosensory barrel cortex are essential for receiving information from the thalamus. The number of branches in the dendritic arbor reflects the complexity of the thalamocortical pathway. Thus, in order to follow the growth and complexity changes of dendritic arbors of spiny stellate neurons at layer IV of primary somatosensory cortex (S1), neurons were identified by Golgi-Cox staining and fifty cells, per age were drawn with the help of a camera lucida. Neurons within the barrel subfield at postnatal day (PD) 5 presented very few branches in the dendritic arbors. Branches were short and single, or poorly ramified (Figure 1A), while neurons at PD15 had many more branches and more complex dendritic arbors (Figure 1A). Neurons at PD25 had longer dendritic arbors with a similar complexity as in PD15. Notably at PD25 the branches were polarized to one side of the cell, probably because the branches were oriented towards the center of the barrel to contact terminal axonal arbors of the thalamus. It is generally accepted that hollows emerge via passive displacement of cortical cells by dense thalamocortical terminal clusters in barrel centers. Additionally, it seems that the emergence of sides and septa are also related to the progressive asymmetry of dendrites from the cells of the barrel side toward the barrel hollow [27]. In order to quantify dendritic arbors at different ages, morphometric analyses of these neurons was performed. Box chart whisker plots were used to show the distribution of total dendritic arbor branch number (Figure 1B), total dendritic arbor length (Figure 1C), and dendritic arbor fractal dimension (Figure 1D). Total dendritic arbor branch number increased as the neurons matured, reaching a maximum at PD15 (Figure 1B). By PD25 the total dendritic arbor branch number seemed to decrease slightly but this difference was not significant (Figure 1B). Similarly, the total length of dendritic arbors increased as neurons matured, reaching a maximum size at PD25 (Figure 1C). Also, fractal dimension of these dendritic arbors increased as the neurons matured, and reached a maximum at PD15 (Figure 1D). By PD25 the fractal dimension remained constant (Figure 1D). Since total dendritic arbor branch number and total dendritic arbor length did not fully explain complexity; we further examined the level of complexity by determining dendritic arbor branch number and length per order. These parameters reflect the complexity of a circuit and can show the construction of the whole arbor. Dendritic arbors of neurons at PD5 primarily had dendrites of first order, which branched out reaching the fourth order (Figure 1E). Dendritic arbors of neurons at PD15 showed dendritic branches that reached the ninth order (Figure 1E). The largest number of dendritic arbor branches were those of the first to the forth order (Figure 1E). Dendritic arbors of neurons at PD25 showed a similar dendritic arbor branching behavior as PD15 neurons, except that ninth order branches were not detected (Figure 1E). These data suggest that neurons expand dendrite branching within the first 15 days of postnatal life, and indicate that dendrites have more branching close to the soma. In PD5 neurons, first order dendritic branches were the longest and dendritic arbor branch length decreased as the branch order augmented (Figure 1F). In PD15 neurons, second and third order dendrites were the longest (Figure 1F). From the forth order the branch length decreased gradually as the order increased (Figure 1F). In PD25 neurons, second and third order branch dendrites were still the longest ones and also were longer than those present on PD15 neurons (Figure 1F). Similarly, as in PD15 neurons, the dendritic arbor branch length decreased gradually as the order increased (Figure 1F).
These results suggest that as the neurons matured, they initially increased the number and complexity of their dendrites, followed by branch loss across dendrite orders, while they simultaneously increased the length of the remaining dendrites.
3.2. Thalamocortical Axons Increased Arbor Complexity While Remodeling within the First
Another parameter that provides information on how neurons make connections is the number of branches in the terminal axonal arbors (axonal arbors). Therefore, the growth and complexity of axonal arbor branches from thalamocortical neurons was also evaluated. Axons were

Figure 1. Dendrites of spiny stellate neurons increase complexity while remodeling within the first month of life. (A) Representative camera lucida drawings from spiny stellate neurons within layer IV of the primary somatosensory barrel cortex. The drawings represent neurons at postnatal day (PD) 5, 15 and 25. Scale bar 40 μm. (B-D) Box-and-whisker plots of dendritic arbors, indicating the mean (squares), 25th percentile (bottom line), median (middle line), 75th percentile (top line), 5th and 95th percentile (whiskers), and minimum and maximum measurements (x). Morphometric analysis of spiny stellate dendritic arbors was performed by counting total dendritic arbor branch number (B), total dendritic arbor length (C), and dendritic arbor fractal dimension (D) at PD5, PD10, PD15 and PD25. Numbers in parenthesis represent the number of dendritic arbors measured for each condition. 5 rats were used per age. Dendritic arbor branch number per order (E) and dendritic arbor branch length per order (F) were also measured from the same dendritic arbors at PD5 (open squares), PD15 (close circles), and PD25 (open triangles).
stained with DiI labeling and drawn with the help of a camera lucida and confocal imaging. Axonal arbors at PD5 presented few branches that ramify poorly (Figure 2A), while axonal arbors at PD15 had more branches and were more complex (Figure 2A). Axonal arbors at PD25 seemed to have fewer branches than PD15 arbors, but these branches were much longer (Figure 2A).
In order to quantify the axons, morphometric analyses of these thalamocortical axonal arbors were also performed. Box chart whisker plots were used to show the distribution of total axonal arbor branch number (Figure 2B), total axonal arbor length (Figure 2C) and axonal arbor fractal dimension (Figure 2D). Total axonal arbor branch number increased as the neurons matured, reaching a maximum at PD15 (Figure 2B). By PD25 the total axonal arbor branch number decreased (Figure 2B). In contrast, the total axonal arbor length was almost the same until PD15, but increased significantly as they reached PD25 (Figure 2C). Also, the fractal dimension of the axonal arbors increased from PD10 to PD15, and reached a maximum at PD15. There were no further significant changes in complexity by PD25 (Figure 2D). To gain additional insight into the axonal complexity, the axonal arbor branch number and length per order for these axons was determined. These parameters can show the dynamics of branching for these axonal arbors. Similarly to dendrites, first order axonal arbor branches emerge from the main axon that arrives to the barrel cortex layer IV. Axonal arbors at PD5 showed branches that reached the ninth order (Figure 2E). Axonal arbors at PD15 showed branches that reached the 17th order. The largest number of branches was present from the fifth to the ninth order (Figure 2E). Similarly, axonal arbors at PD25 showed branches up to the 14th order (Figure 2E). This is in agreement with the idea that some branches from the previous age were lost. The largest number of axonal branches at PD25 was found in the sixth to the eight orders (Figure 2E). Axonal arbor branch length per order was similar between PD5 and PD15. At PD25, the largest axonal arbor branches were measured from third to ninth order even though some branches were lost (Figure 2F). These results suggest that as thalamocortical axons matured, they increased the length and complexity of their branches.
3.3. Microtubule-Associated Proteins 2 and Neurofilaments Increased in the Primary Somatosensory Cortex during the First Month of Life
Microtubule-associated proteins 2a and 2b (MAP2) are mainly confined to cell bodies and dendrites. To visualize neural processes within layer IV of the primary somatosensory barrel cortex neurons, a stain against MAP2 proteins was used. In PD5 neurons, MAP2 proteins are expressed in cell bodies and branches arising from them (Figure 3A). In PD15 neurons, the amount of neuronal processes and cell bodies expressing MAP2 proteins increased considerably (Figure 3B). The amount of neuronal branches expressing MAP2 was similar in PD25 neurons (Figure 3C).
Apical dendrites from layer V pyramidal cells showed MAP2 immunostaining at all ages (Figures 3A-C). These results suggest that dendritic arbors become more stable with age. In agreement with the immunostaining, Western blot analyses showed that the content of MAP2 in the developing the primary somatosensory cortex increased from PD5 to PD30 (Figure 3G). The ratio of
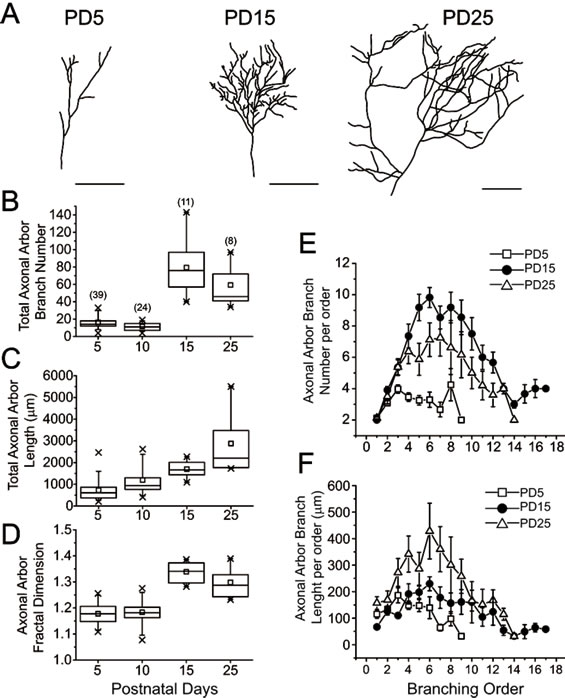
Figure 2. Thalamocortical axons increase complexity while remodeling within the first month of life. (A) Representative camera lucida and confocal drawings from thalamocortical axons within layer IV of the primary somatosensory barrel cortex. The drawings represent axon terminal arbors at postnatal day (PD) 5, 15 and 25. Scale bar 100μm. (B-D) Boxand-whisker plots of axonal arbors, indicating the mean (squares), 25th percentile (bottom line), median (middle line), 75th percentile (top line), 5th and 95th percentile (whiskers), and minimum and maximum measurements (x). Morphometric analysis of thalamocortical axonal arbors was performed by counting total axonal arbor branch number (B), total axonal branch length (C) and axonal arbor fractal dimension (D) at PD5, PD10, PD15 and PD25. Numbers in parenthesis represent the number of axonal arbors measured for each condition. 5 rats were used per age. Axonal arbor branch number per order (E) and axonal arbor branch length per order (F) were also measured from the same axonal arbors at PD5 (open squares), PD15 (close circles), and PD25 (open triangles).
expression of MAP2 relative to PD5 augmented with time reaching a two-fold increase by PD30 (Figure 3I). Neurofilaments are a type of intermediate filament that functions as major structural element of the axonal cytoskeleton. Neurofilaments antibodies were used to visualize thalamic terminal axonal arbors within layer IV of the primary somatosensory barrel cortex. Immunoreactivity for neurofilaments increased inside barrels from PD5 to PD15 (Figures 3D and E). Following this age, neurofilament staining persisted in the axons and was also observed in the cell bodies of cortical neurons (Figure 3F). Western blot analyses showed an incremental increase in the content of neurofilaments in the primary somatosensory cortex from PD5 to PD15. The neurofilament content remained similar from PD15 to PD30 (Figure 3H). The ratio of neurofilament expression relative to PD5 augmented with time reaching a two-fold increase by PD30 (Figure 3J).
3.4. Synaptic Markers and Synaptic Density Increased within Layer IV during the First Month of Life
As dendritic and axonal arbors were evaluated, the functional unit of the interaction between both structures, the synapse, was also analyzed. The presence of two postsynaptic markers (Shank-2 and postsynaptic density protein

Figure 3. Microtubule-associated proteins 2 and neurofilaments increased in the primary somatosensory cortex during the first month of life. Brain sections of layer IV of the primary somatosensory barrel cortex (S1) of postnatal day (PD) 5 (A, D), PD15 (B, E) and PD25 (C, F), were immunostained for MAP2 (A-C) and neurofilaments (D-F). Arrowheads show dendritic and axonal stained branches. White arrows show stained cell bodies. Black arrows illustrate apical dendrites from pyramidal layer V neurons. Scale bar 20μm. 5 rats were used per age. Representative Western blots for MAP2 (G) and for neurofilaments (H) at PD5, PD10, PD15, PD20, PD25 and PD30 of protein lysates from S1 samples. Pools of 10 S1 areas were used per age (n = 5). Band intensity was estimated by a densitometer and values were normalized to the value of PD5 who was taken as 1. Average ± SE of five Western Blots are shown for MAP2 (I), and for neurofilaments (J). *Represent statistical differences between PD5 vs. all ages.
95) and a presynaptic marker (synaptophysin) were analyzed in layer IV of the primary somatosensory barrel cortex. Immunohistochemistry for Shank-2 at PD5 revealed a punctuate label mainly inside the cell bodies with some localization within the neuropil (Figure 4A). At PD15 the immunostaining remained in cell bodies but also was found around cells and in the neuropil (Figure 4B). By PD25 punctuate labeling of Shank-2 in the cell bodies was intensified and staining could also be seen all over the barrel in the neuropil (Figure 4C). Western blot analyses showed PSD-95 was barely detectable at PD5 but it increased progressively from PD15 to PD25 with a significant incremental increase from PD25 to PD30 (Figure 4G; p < 0.05). The ratio of PSD-95 expression relative to PD5 augmented with time reaching an almost three-fold increase by PD30 (Figure 4I). Label for synaptophysin was found surrounding the cell bodies of layer IV neurons. This labeling increased in PD15 and became more prominent in PD25 (Figures 4D-F). Likewise, Western blot analyses for synaptophysin showed a gradual increase from PD5 to PD30 (Figure 4H). The ratio of synaptophysin expression, relative to PD5 was augmented over time reaching an almost four-fold increase by PD30 (Figure 4J). This observation supports the idea that synapses are first established on cell bodies and later in the surrounding processes located in the neuropil. To estimate synaptic density within the primary somatosensory barrel cortex, electron microscopy sections were collected at PD5, PD15 and PD30 (Figures 5A-C). Synaptic density doubled from PD5 to PD15, while it increased 20% from PD15 to PD30 (Figure 5D). These results suggest that as the synaptic machinery matures, synaptogenesis increased with age.
3.5. Cytochrome Oxidase Activity Increased within Layer IV during the First Month of Life
To evaluate the degree of synaptic activity in layer IV of primary somatosensory barrel cortex, mitochondrial activity was measured using cytochrome oxidase histochemistry. The histochemistry for this enzyme has been widely used to localize barrels and to determine synaptic activity [26]. In coronal sections, somatosensory cortex was readily recognized by cytochrome oxidase stained barrels at PD5, PD15 and PD25. Barrel staining intensity increased over time (Figures 6A, C and E, respectively). Using a higher optical magnification, sites of mitochondrial activity were observed throughout the barrel cortex including cell bodies and neuropil (Figures 6B, D and F). In summary, mitochondrial activity, estimated by densitometry of cytochrome oxidase staining increased within layer IV during the first month of life (Figure 6G).
4. DISCUSSION
The mechanism(s) underlying rat somatosensory thalamocortical pathway development is still a matter of controversy. Previous observations about thalamocortical somatosensory circuitry formation were based upon studies that addressed single aspects of the development of the circuit: axonal growth, dendritic growth, or synaptogenesis. The isolated study of neuronal components could lead to the impression that a brain region uses only one mechanism to construct its final circuitry. Here, we have quantified aspects of all the components of the circuit, axons, dendrites, and synapses to better understand which mechanism is underlying the circuit formation. Our data suggest that both selective and constructive mechanisms operate concomitantly during circuit forma-
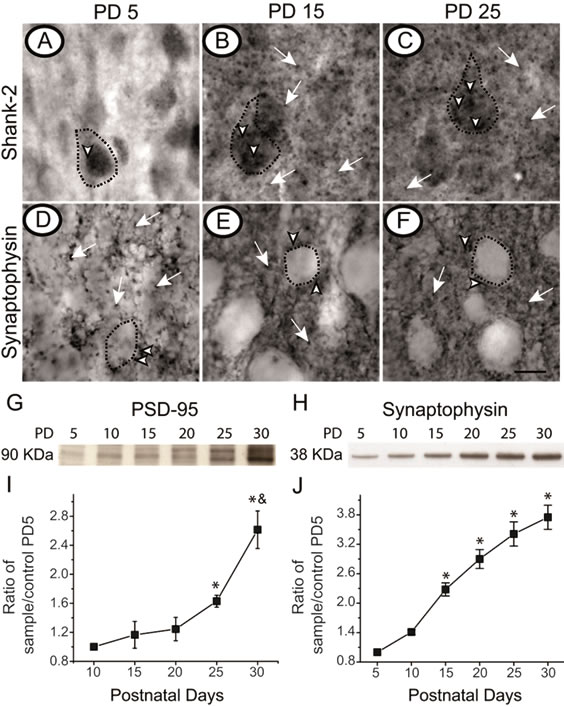
Figure 4. Synaptic markers increase within layer IV during the first month of life. Brain sections of layer IV of the primary somatosensory barrel cortex (S1) of postnatal day (PD) 5 (A, D), PD15 (B, E) and PD25 (C, F), were immunostained for Shank-2 (A-C) and synaptophysin (D-F). Label for these pre and postsynaptic proteins are founded in cell bodies (arrow heads) and in the neuropil (white arrows). Cell bodies are dotted lined. Scale bar 10 μm. Representative Western blots for PSD-95 (G) and for synaptophysin (H) at PD5, PD10, PD15, PD20, PD25 and PD30 of protein lysates from S1 samples. Pools of 10 S1 areas were used per age (n = 5). Band intensity was estimated by a densitometer and values were normalized to the value of PD5 who was taken as 1. Average ± SE of five Western Blots are shown for PSD-95 (I), and for synaptophysin (J). *Represent statistical differences between PD5 vs. all ages. & Represent statistical differences between PD25 vs. PD30.
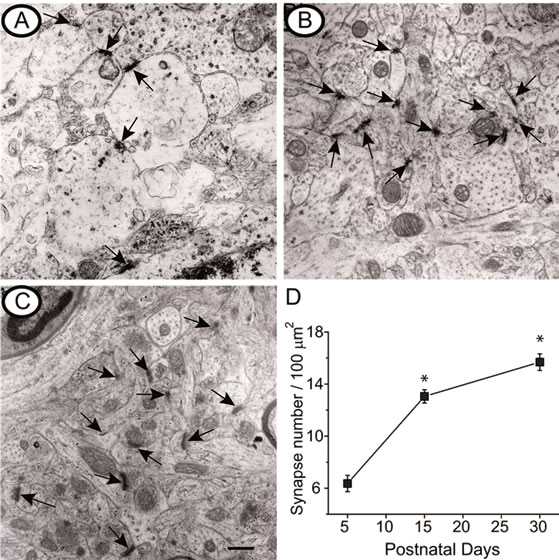
Figure 5. Synaptic density increase within layer IV during the first month of life. Representative electronic micrographs of layer IV primary somatosensory barrel cortex (S1) show synapses (arrows) at postnatal day (PD) 5 (A), PD15 (B) and PD30 (C). Scale bar 1μm. D) Plot showing changes in synaptic density at different ages. C3 and D3 barrels were used to count synapses, sampling of each barrel at its upper, middle and lower levels (n = 5 rats per age). *Represent statistical differences between PD5 vs. all ages; p < 0.05.
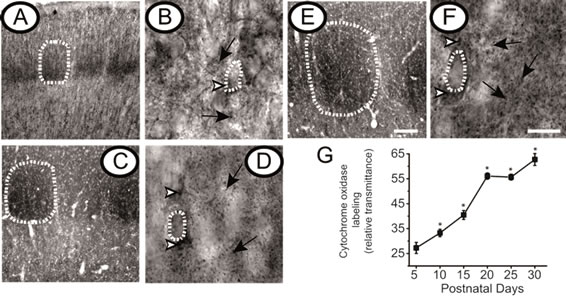
Figure 6. Cytochrome Oxidase activity increased within layer IV during the first month of life. Representative microphotographs show histochemistry against cytochrome oxidase of coronal sections of primary somatosensory cortex at postnatal day (PD) 5 (A and B), PD15 (C and D) and PD25 (E and F). At a lower magnification (panels A, E, and E) barrels are clearly seen (encircled by dotted lines). At a higher magnification (panels B, D, and F) cell bodies are clearly seen (encircled by dotted lines). Mitochondrial activity sites are also denoted by arrow heads in the periphery of cell bodies and by white arrows in the neuropil (n = 5 rats per age). Scale bar 100 μm for lower magnification panels and 20 μm for higher magnification panels. The graph (G) shows the quantification for the cytochrome oxidase staining. *Represent statistical differences between PD5 vs. all ages; p < 0.05.
tion in the rat barrel cortex. We propose that somatosensory thalamocortical arbors formation can be explained by a two-phase model (Figure 7).
During the first phase (growth phase), the dendritic and axonal branches are profusely added, as we observed during the first 15 days after birth. At the same time, synapses start forming in the soma. The second phase (remodeling phase) is characterized by events of elimination and elongation of both dendritic and axonal arbors branches. Synapses continue in the somas, but appear also in the neuropil. In agreement with this notion, the amount of MAP2 in the neuronal cytoskeleton of the barrel cortex increased rapidly after PD15, a phenomena that has been associated with dendritic remodeling during brain development [28]. Moreover, the neurofilament content also increased over time which indicates the formation and growth of axonal terminals. Simultaneously, dendritic and axonal branches are lost throughout the whole arbor configuration, especially at higher branch orders. While this shaping process is occurring in the arbors, the amount of synapses also increased with age. The two-phase model proposed in this work is in concordance with similar events described during the development of dendritic and axonal arbors in sensory, motor and higher-order brain regions of invertebrates and vertebrates [29-31]. This two-phase model is also contained in the concurrent formation-elimination theorical model proposed for axon development in which the selective growth of some branches and the elimination of others occur simultaneously [32]. By contrast, Purkinge cell dendrites grow in a phase manner, but in this case the cells first retract branches and, then add many
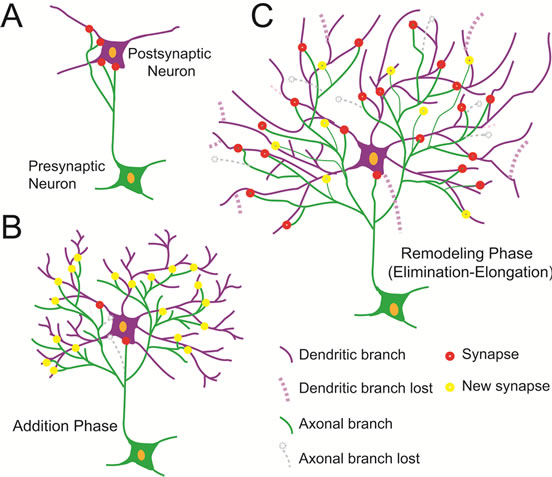
Figure 7. A two-phase model is followed by the somatosensory thalamocortical pathway to establish neural circuits in the barrel cortex. (A) Initial state of axonal and dendritic arbors development and synaptogenesis at postnatal day 5. (B) First phase of the model that consists of the addition of dendritic and axonal arbors branches at postnatal day 15. (C) Second phase or remodeling phase of elimination-elongation of dendritic and axonal arbors branches postnatal day 30.
branches before remodeling [33]. Synapse formation can also be explained under the framework of the two-phase model. Indeed they are added continuously during development: first in the soma and then also in the neuropil. The axonal presynaptic marker synaptophysin increases in an almost linear manner, while the postsynaptic marker PSD-95 takes longer to increase. Moreover, our data indicates that at the beginning of postnatal development, the preand postsynaptic markers in the barrel cortex were primarily associated with neuronal cell bodies and then, as development progresses, the distribution of these markers shifts to the neuropil. Thus, it seems that the synaptogenesis in barrel cortex starts with a low number of synaptic contacts associated with the neuronal cell bodies. Thereafter, an intense period of synaptic maturation at the neuropil starts after PD15 until the end of the first month of life. This pattern of synaptogenesis is similar with the centrifugal process of synapse formation in the cerebellum, where a change in synapse localization also occurs [34,35]. The fact that synaptic density increased in barrel neuropil during the first month of postnatal life also is in agreement with the increase of glutamatergic and GABAergic synapse density profiles that has been described previously in barrel cortex [6]. As we observed in this work, the maximum number of synapses in the cortex is reached by PD30. Interestingly, the synapse density in barrels remains relatively constant through adulthood without any evidence of synaptic elimination [7]. These observations suggest that synapse formation in barrels uses a constructive mechanism, as in the case for the olfactory bulb, rather than a mechanism in which synapses are overproduced early in development and then eliminated [36-39]. Previous evidence suggests that preand postsynaptic sites mature in an asynchronous fashion [40-42]. Axons acquire their ability to release neurotransmitters well before they reach their targets and induce the organization of postsynaptic sites upon contacting them, a process that triggers synapse formation [43-47]. This asynchrony likely explains why, in our western blot analyses, the content of synaptophysin increases steadily from PD5 to PD30. This suggests to us that the maturation of the pre-synapses occurs continuously. In contrast, the content of PSD-95 remains relatively low from PD5 to PD20. After PD20, PSD-95 content increases rapidly and abruptly. So, in this case the post-synapses take longer to mature and then stabilize faster as development continues. Thus, it is possible that the profiles of synapses observed before PD15 with the aid of the electron microscopy correspond to imamture synapses. The fact that the content of PSD-95 and the immunostaining for Shank-2 increase significantly after PD15 suggests that synaptic consolidation starts after this date and continues during the phase of remodeling. This might explain the difficulty to induce LTP in the somatosensory cortex after PD15 and the disappearance of silent synapses in barrels before this postnatal day [48-50]. In support to this conclusion, it is known that PSD-95 is required for AMPA receptor incorporation and hence for synaptic consolidation [51-53]. Also, activation of AMPA receptors inhibits actin-based spine motility, thus promoting contact stabilization [54]. It is also note-worthy that synaptogenesis promotes branch elongation [51,55]. Therefore, we think that this centrifugal pattern of synapse formation partly explains why, during the remodeling phase, proximal branches of dendritic arbors elongate whereas distal branches are eliminated. In addition, synaptogenesis also promotes sprouting [56]. The dominance of one of these processes during the events of remodeling may determine if in some neuronal processes the length is greater than the ramification magnitude or vice versa. Once the core structure of the circuit is developed, there is evidence that the remodeling process continues throughout life. Indeed, in the adult brain circuit changes in synapse formation and elimination depend on structural plasticity which is thought to underlie aspects of long-term memory formation [57]. Neuronal activity is the basis for many mechanisms underlying pattern formation, plasticity and information processing [58]. One of the most established ideas in neurosciences is that neuronal activity promotes dendritogenesis, axonogenesis and synaptogenesis. Noteworthy, the stimulus-evoked cortical activity detected in S1 has been reported at the end of the first week of postnatal life using 2 deoxiglucose uptake [59-62]. Additionally, differences in activity patterns before and after the onset of whisking behavior may be caused by neuronal activity induced by whisking, during active touch [61]. In this regard, it has been argued that the activity of the enzyme cytochrome oxidase reflects the levels of evoked neuronal activity [63]. Thus, our data showing the increase of cytochrome oxidase staining during the first two weeks likely reflected the metabolic demands associated with neuronal growth. After PD14, cytochrome oxidase staining might also reflect use dependent neural activity caused by whisking. In addition, the increase in cytochrome oxidase staining could reflect changes in the patterns and/or levels of neuronal activity associated with passive stimulation as seen in lactating rats and in immature somatosensory cortex [64,65]. Indeed, metabolic indices utilized commonly to monitor indirectly the activity levels could be sensitive to changes in activity patterns [66]. In the present report, we analyzed the developmental pattern of thalamic terminal axons, spiny stellate dendritic arbors, and synapses in the barrel cortex, during the first month of life. Our results suggest that this circuit does not use a single strategy to build up its connectivity, but rather follows a two phase model, concurrently elongating proximal and eliminating distal dendritic and axonal branches as synaptogenesis proceeds. Thus, we argue both the selective and constructive mechanisms are simultaneously used during somatosensory circuit formation in specific time frames during development.
5. ACKNOWLEDGEMENTS
The authors thank Laura Rivera, Apolinar Luna Plata and José Guadalupe Baltazar for valuable technical assistance, and Brisa Santillán for helping editing the figures. The authors would like to thank Dr. Andrew Schaefer for helpful comments. This research was supported by Grants IA202013-2 (to EUQ) from Dirección General de Asuntos del Personal Académico, Universidad Nacional Autónoma de México, and J28035N and 38615N (to GGO) from Consejo Nacional de Ciencia y Tecnología, Mexico.
![]()
![]()
REFERENCES
- Purves, D. (1988) Body and brain: A trophic theory of neural connections. First Harvard University Press, Boston.
- Crowley, J.C. and Katz, L.C. (2000) Early development of ocular dominance columns. Science, 290, 1321-1324. doi:10.1126/science.290.5495.1321
- Quartz, S.R. and Sejnowski, T.J. (1997) The neural basis of cognitive development: A constructivist manifesto. The Behavioral and Brain Sciences, 20, 537-556; Discussion 556-596. doi:10.1017/S0140525X97001581
- Fox, K. (2008) Barrel cortex. Cambridge University Press, Cambridge. doi:10.1017/CBO9780511541636
- Micheva, K.D. and Beaulieu, C. (1997) Development and plasticity of the inhibitory neocortical circuitry with an emphasis on the rodent barrel field cortex: A review. Canadian Journal of Physiology and Pharmacology, 75, 470-478. doi:10.1139/y97-032
- Micheva, K.D. and Beaulieu, C. (1996) Quantitative aspects of synaptogenesis in the rat barrel field cortex with special reference to GABA circuitry. The Journal of Comparative Neurology, 373, 340-354. doi:10.1002/(SICI)1096-9861(19960923)373:3<340::AID-CNE3>3.0.CO;2-2
- White, E.L. (1976) Ultrastructure and synaptic contacts in barrels of mouse SI cortex. Brain Research, 105, 229-251. doi:10.1016/0006-8993(76)90423-6
- Senft, S.L. and Woolsey, T.A. (1991) Growth of thalamic afferents into mouse barrel cortex. Cerebral Cortex, 1, 308-335. doi:10.1093/cercor/1.4.308
- Rebsam, A., Seif, I. and Gaspar, P. (2002) Refinement of thalamocortical arbors and emergence of barrel domains in the primary somatosensory cortex: A study of normal and monoamine oxidase a knock-out mice. The Journal of Neuroscience, 22, 8541-8552.
- Killackey, H.P. and Belford, G.R. (1979) The formation of afferent patterns in the somatosensory cortex of the neonatal rat. The Journal of Comparative Neurology, 183, 285-303. doi:10.1002/cne.901830206
- Agmon, A., Yang, L.T., Jones, E.G. and O’Dowd, D.K. (1995) Topological precision in the thalamic projection to neonatal mouse barrel cortex. The Journal of Neuroscience, 15, 549-561.
- Agmon, A., Yang, L.T., O’Dowd, D.K. and Jones, E.G. (1993) Organized growth of thalamocortical axons from the deep tier of terminations into layer IV of developing mouse barrel cortex. The Journal of Neuroscience, 13, 5365-5382.
- National Research Council of the National Academies (2011) Guide for the care and use of laboratory animals. 8th Edition, The National Academies Press, Washington DC.
- Ramón y Cajal, S. and Castro y Pascual, F. (1933) Micrographic technique elements of the nervous system. Tipografía Artística, Madrid.
- Smith Jr., T.G., Lange, G.D. and Marks, W.B. (1996) Fractal methods and results in cellular morphology— Dimensions, lacunarity and multifractals. Journal of Neuroscience Methods, 69, 123-136. doi:10.1016/S0165-0270(96)00080-5
- Cuello, A.C., Priestley, J.V. and Sofroniew, M.V. (1983) Immunocytochemistry and neurobiology. Quarterly Journal of Experimental Physiology, 68, 545-578.
- Tabor, K.M., Wong, R.O. and Rubel, E.W. (2011) Topography and morphology of the inhibitory projection from superior olivary nucleus to nucleus laminaris in chickens (Gallus gallus). The Journal of Comparative Neurology, 519, 358-375. doi:10.1002/cne.22523
- Caceres, A., Binder, L.I., Payne, M.R., Bender, P., Rebhun, L. and Steward, O. (1984) Differential subcellular localization of tubulin and the microtubule-associated protein MAP2 in brain tissue as revealed by immunocytochemistry with monoclonal hybridoma antibodies. The Journal of Neuroscience, 4, 394-410.
- Budinger, E., Heil, P. and Scheich, H. (2000) Functional organization of auditory cortex in the Mongolian gerbil (Meriones unguiculatus). III. Anatomical subdivisions and corticocortical connections. The European Journal of Neuroscience, 12, 2425-2451. doi:10.1046/j.1460-9568.2000.00142.x
- Freria, C.M., Zanon, R.G., Santos, L.M. and Oliveira, A.L. (2010) Major histocompatibility complex class I expression and glial reaction influence spinal motoneuron synaptic plasticity during the course of experimental autoimmune encephalomyelitis. The Journal of Comparative Neurology, 518, 990-1007. doi:10.1002/cne.22259
- King, A.E., Chung, R.S., Vickers, J.C. and Dickson, T.C. (2006) Localization of glutamate receptors in developing cortical neurons in culture and relationship to susceptibility to excitotoxicity. The Journal of Comparative Neurology, 498, 277-294. doi:10.1002/cne.21053
- Naisbitt, S., et al. (1999) Shank, a novel family of postsynaptic density proteins that binds to the NMDA recaptor/PSD-95/GKAP complex and cortactin. Neuron, 23, 569-582. doi:10.1016/S0896-6273(00)80809-0
- Strominger, R.N. and Woolsey, T.A. (1987) Templates for locating the whisker area in fresh flattened mouse and rat cortex. Journal of Neuroscience Methods, 22, 113-118. doi:10.1016/0165-0270(87)90004-5
- Ossipow, V., Laemmli, U.K. and Schibler, U. (1993) A simple method to renature DNA-binding proteins separated by SDS-polyacrylamide gel electrophoresis. Nucleic Acids Research, 21, 6040-6041. doi:10.1093/nar/21.25.6040
- Schagger, H. and Von Jagow, G. (1987) Tricine-sodium dodecyl sulfate-polyacrylamide gel electrophoresis for the separation of proteins in the range from 1 to 100 kDa. Analytical Biochemistry, 166, 368-379. doi:10.1016/0003-2697(87)90587-2
- Wong-Riley, M.T. (1989) Cytochrome oxidase: An endogenous metabolic marker for neuronal activity. Trends in Neuroscience, 12, 94-101. doi:10.1016/0166-2236(89)90165-3
- Zaccaria, K.J. and McCasland, J.S. (2012) Emergence of layer IV barrel cytoarchitecture is delayed in somatosensory cortex of GAP-43 deficient mice following delayed development of dendritic asymmetry. Somatosensory & Motor Research, 29, 77-88. doi:10.3109/08990220.2012.686936
- Szebenyi, G., et al. (2005) Activity-driven dendritic remodeling requires microtubule-associated protein 1A. Current Biology, 15, 1820-1826. doi:10.1016/j.cub.2005.08.069
- Kramer, A.P. and Kuwada, J.Y. (1983) Formation of the receptive fields of leech mechanosensory neurons during embryonic development. The Journal of Neuroscience, 3, 2474-2486.
- Wang, H. and Macagno, E.R. (1997) The establishment of peripheral sensory arbors in the leech: In vivo timelapse studies reveal a highly dynamic process. The Journal of Neuroscience, 17, 2408-2419.
- Jontes, J.D., Buchanan, J. and Smith, S.J. (2000) Growth cone and dendrite dynamics in zebrafish embryos: Early events in synaptogenesis imaged in vivo. Nature Neuroscience, 3, 231-237. doi:10.1038/72936
- Hua, J.Y. and Smith, S.J. (2004) Neural activity and the dynamics of central nervous system development. Nature Neuroscience, 7, 327-332. doi:10.1038/nn1218
- Sotelo, C. and Dusart, I. (2009) Intrinsic versus extrinsic determinants during the development of Purkinje cell dendrites. Neuroscience, 162, 589-600. doi:10.1016/j.neuroscience.2008.12.035
- Berry, M. and Bradley, P. (1976) The growth of the dendritic trees of Purkinje cells in irradiated agranular cerebellar cortex. Brain Research, 116, 361-387. doi:10.1016/0006-8993(76)90487-X
- Sadler, M. and Berry, M. (1984) Remodelling during development of the Purkinje cell dendritic tree in the mouse. Proceedings of the Royal Society of London: Series B, 221, 349-367. doi:10.1098/rspb.1984.0037
- Gutierrez-Ospina, G., Calikoglu, A.S., Ye, P. and D’Ercole, A.J. (1996) In vivo effects of insulin-like growth factor-I on the development of sensory pathways: Analysis of the primary somatic sensory cortex (S1) of transgenic mice. Endocrinology, 137, 5484-5492. doi:10.1210/en.137.12.5484
- Valle-Leija, P., Blanco-Hernandez, E., Drucker-Colin, R., Gutierrez-Ospina, G. and Vidaltamayo, R. (2012) Supernumerary formation of olfactory glomeruli induced by chronic odorant exposure: A constructivist expression of neural plasticity. PLoS One, 7, e35358. doi:10.1371/journal.pone.0035358
- Bourgeois, J.P. (2005) Brain synaptogenesis and epigenesis. Synaptogenèses et épigenèses cérébrales. Médicine Science, 21, 428-433. doi:10.1051/medsci/2005214428
- Bourgeois, J.P., Goldman-Rakic, P.S. and Rakic, P. (1994) Synaptogenesis in the prefrontal cortex of rhesus monkeys. Cerebral Cortex, 4, 78-96. doi:10.1093/cercor/4.1.78
- Withers, G.S., James, C.D., Kingman, C.E., Craighead, H.G. and Banker, G.A. (2006) Effects of substrate geometry on growth cone behavior and axon branching. Journal of Neurobiology, 66, 1183-1194. doi:10.1002/neu.20298
- Rao, A., Cha, E.M. and Craig, A.M. (2000) Mismatched appositions of presynaptic and postsynaptic components in isolated hippocampal neurons. The Journal of Neuroscience, 20, 8344-8353.
- Narboux-Neme, N., et al. (2012) Neurotransmitter release at the thalamocortical synapse instructs barrel formation but not axon patterning in the somatosensory cortex. The Journal of Neuroscience, 32, 6183-6196. doi:10.1523/JNEUROSCI.0343-12.2012
- Haydon, P.G., McCobb, D.P. and Kater, S.B. (1987) The regulation of neurite outgrowth, growth cone motility, and electrical synaptogenesis by serotonin. Journal of Neurobiology, 18, 197-215. doi:10.1002/neu.480180206
- Haydon, P.G. and Zoran, M.J. (1994) Retrograde regulation of presynaptic development during synaptogenesis. Journal of Neurobiology, 25, 694-706. doi:10.1002/neu.480250609
- Shelly, M., Lim, B.K., Cancedda, L., Heilshorn, S.C., Gao, H. and Poo, M.M. (2010) Local and long-range reciprocal regulation of cAMP and cGMP in axon/dendrite formation. Science, 327, 547-552. doi:10.1126/science.1179735
- Ahmari, S.E., Buchanan, J. and Smith, S.J. (2000) Assembly of presynaptic active zones from cytoplasmic transport packets. Nature Neuroscience, 3, 445-451. doi:10.1038/74814
- Friedman, H.V., Bresler, T., Garner, C.C. and Ziv, N.E. (2000) Assembly of new individual excitatory synapses: Time course and temporal order of synaptic molecule recruitment. Neuron, 27, 57-69. doi:10.1016/S0896-6273(00)00009-X
- Feldman, D.E., Nicoll, R.A. and Malenka, R.C. (1999) Synaptic plasticity at thalamocortical synapses in developing rat somatosensory cortex: LTP, LTD, and silent synapses. Journal of Neurobiology, 41, 92-101. doi:10.1002/(SICI)1097-4695(199910)41:1<92::AID-NEU12>3.0.CO;2-U
- Itami, C., Mizuno, K., Kohno, T. and Nakamura, S. (2000) Brain-derived neurotrophic factor requirement for activity-dependent maturation of glutamatergic synapse in developing mouse somatosensory cortex. Brain Research, 857, 141-150. doi:10.1016/S0006-8993(99)02352-5
- Petralia, R.S., et al. (1999) Selective acquisition of AMPA receptors over postnatal development suggests a molecular basis for silent synapses. Nature Neuroscience, 2, 31-36. doi:10.1038/4532
- Jontes, J.D. and Smith, S.J. (2000) Filopodia, spines, and the generation of synaptic diversity. Neuron, 27, 11-14. doi:10.1016/S0896-6273(00)00003-9
- Mierau, S.B., Meredith, R.M., Upton, A.L. and Paulsen, O. (2004) Dissociation of experience-dependent and -independent changes in excitatory synaptic transmission during development of barrel cortex. Proceedings of the National Academy of Sciences of the United States of America, 101, 15518-15523. doi:10.1073/pnas.0402916101
- Okabe, S., Miwa, A. and Okado, H. (2001) Spine formation and correlated assembly of presynaptic and postsynaptic molecules. The Journal of Neuroscience, 21, 6105- 6114.
- Hasbani, M.J., Schlief, M.L., Fisher, D.A. and Goldberg, M.P. (2001) Dendritic spines lost during glutamate receptor activation reemerge at original sites of synaptic contact. The Journal of Neuroscience, 21, 2393-2403.
- Niell, C.M. and Smith, S.J. (2005) Functional imaging reveals rapid development of visual response properties in the zebrafish tectum. Neuron, 45, 941-951. doi:10.1016/j.neuron.2005.01.047
- Meyer, M.P. and Smith, S.J. (2006) Evidence from in vivo imaging that synaptogenesis guides the growth and branching of axonal arbors by two distinct mechanisms. The Journal of Neuroscience, 26, 3604-3614. doi:10.1523/JNEUROSCI.0223-06.2006
- Bailey, C.H. and Kandel, E.R. (1993) Structural changes accompanying memory storage. Annual Review of Physiology, 55, 397-426. doi:10.1146/annurev.ph.55.030193.002145
- Erzurumlu, R.S. and Kind, P.C. (2001) Neural activity: Sculptor of “barrels” in the neocortex. Trends in Neuroscience, 24, 589-595. doi:10.1016/S0166-2236(00)01958-5
- Wu, C.C. and Gonzalez, M.F. (1997) Functional development of the vibrissae somatosensory system of the rat: (14C) 2-deoxyglucose metabolic mapping study. The Journal of Comparative Neurology, 384, 323-336. doi:10.1002/(SICI)1096-9861(19970804)384:3<323::AID-CNE1>3.0.CO;2-5
- [61] Melzer, P., Welker, E., Dörfl, J. and Van der Loos, H. (1994) Maturation of the neuronal metabolic response to vibrissa stimulation in the developing whisker-to-barrel pathway of the mouse. Developmental Brain Research, 77, 227-250. doi:10.1016/0165-3806(94)90199-6
- [62] Mosconi, T., Woolsey, T.A. and Jacquin, M.F. (2010) Passive vs. active touch-induced activity in the developing whisker pathway. The European Journal of Neuroscience, 32, 1354-1363. doi:10.1111/j.1460-9568.2010.07396.x
- [63] Landers, M.S. and Sullivan, R.M. (1999) Vibrissaeevoked behavior and conditioning before functional ontogeny of the somatosensory vibrissae cortex. The Journal of Neuroscience, 19, 5131-5137.
- [64] McCasland, J.S. and Hibbard, L.S. (1997) GABAergic neurons in barrel cortex show strong, whisker-dependent metabolic activation during normal behavior. The Journal of Neuroscience, 17, 5509-5527.
- [65] Jiang, Q. and Wakerley, J.B. (1997) The milk-ejection reflex in the peri-partum rat: Effects of oestradiol and progesterone on basal milk-ejection frequency and the facilitatory response to central oxytocin. Journal of Neuroendocrinol, 9, 9-16. doi:10.1046/j.1365-2826.1997.00602.x
- [66] Armstrong-James, M. and Callahan, C.A. (1991) Thalamo-cortical processing of vibrissal information in the rat. II. Spatiotemporal convergence in the thalamic ventroposterior medial nucleus (VPm) and its relevance to generation of receptive fields of S1 cortical “barrel” neurones. The Journal of Comparative Neurology, 303, 211- 224. doi:10.1002/cne.903030204
- [67] Uribe-Querol, E., et al. (2005) Metabolic indices shift in the hypothalamic-neurohypophysial system during lactation: Implications for interpreting their relationship with neuronal activity. Neuroscience, 134, 1217-1222. doi:10.1016/j.neuroscience.2005.05.059
NOTES
*Corresponding author.