Advances in Bioscience and Biotechnology
Vol.4 No.3(2013), Article ID:28669,6 pages DOI:10.4236/abb.2013.43045
Use of radiation in strains of Saccharomyces cerevisiae: A new technique for industrial applications
![]()
1Physics Institute, University of São Paulo, São Paulo, Brazil
2CEPESq/UniÍtalo-Italy-Brazilian University Center, São Paulo, Brazil
3Inter-Unities Graduation Program on Biotechnology, University of São Paulo, São Paulo, Brazil
4Department of Biological Sciences, Luiz de Queiroz College of Agriculture/ESALQ, University of São Paulo, Piracicaba, Brazil
5Laboratory of Cyanobacteria, ESALQ, University of São Paulo, São Paulo, Brazil
6Institute of Biosciences, University of São Paulo, São Paulo, Brazil
Email: arruda@if.usp.br
Received 8 January 2013; revised 12 February 2013; accepted 28 February 2013
Keywords: Saccharomyces cerevisiae; Industrial Yeast; Gamma Radiation; Evaluation Method; Industrial Fermentation; Ethanol
ABSTRACT
During the industrial fermentation process in the production of fuel ethanol, yeasts are subject to several stressing conditions. The survival and the permanence of strains introduced in the process correlate with the capability of these yeasts in resisting to physical and chemical stresses, as well as their recovering ability to compete with contaminating microorganisms commonly present in this industrial process. We aim at the selection of Saccharomyces cerevisiae strains having this capability and ability. In this sense, cultivations of strains with industrial interest were irradiated with gammas ray at a wide dose interval. Growing curves for the strains were analyzed by means of their relative growth, a new concept here introduced, which allows a better understanding of the growing and recovering processes following radiative stress. It was found that gamma radiation could be used as an alternative method to quantify growing capabilities of S. cerevisiae strains under stressing conditions. It was also shown that this radiological method could be utilized as an additional procedure to select best robust industrial strains. This radiological method simplifies traditional analysis of strain viability, by avoiding the great number of necessary and consecutive fermentation assays.
1. INTRODUCTION
A great biodiversity was observed in industrial fermentations, each distillery with its own population, showing a succession of different strains. Prevalent strains were found infrequently, and even more rarely strains with persistence. Dominant and persistent strains received special attention because of their alleged competitiveness and stress tolerance during industrial fermentation, respectively [1-3].
Yeasts used in industrial fermentation for ethanol production are subject to several stressing conditions as high ethanol concentrations, interruption of the fermenting process, high temperature and osmotic pressure, occurrence of organic acids, cations excess, plus competition with contaminating bacteria and yeasts [4-6]. The evaluating procedure for yeasts in the industrial process is usually performed by the identification of strains occurring in the fermentation station by means of molecular techniques like karyotyping and PCR-fingerprinting [2,3, 7,8]. Initially, strains that present high dominance (i.e., a quantitative increase of a particular strain in relation to the whole population inside the fermentation vessel at a given point of the station) and high persistence (i.e., the presence of a particular strain throughout the 200-day fermentation station) are identified and isolated. Secondly, these strains are screened in laboratory trails, simulating as close as possible the industrial process for previously chosen desirable fermentation characteristics, such as no flocculation, low foam formation, high ethanol yield, low glycerol formation, high viability during recycle and high cellular glycogen and trehalose content. The sooner a promising strain is identified, it is propagated in laboratory and re-introduced in many distilleries and monitored by the same molecular techniques described above [2,3]. The characteristics necessary in selection of strains suitable for industrial application are those associated with parameters related to the strains capability for dominance and persistence, high viability during cell recycle, increased growth rate and productivity. This is accomplished through an individual analysis of each strain of interest, plus several simulations for industrial conditions associated with fermentation performance. Even though selecting indigenous strains is considered an attractive strategy to guarantee high ethanol yield and productivity during industrial fermentations, this selection step in laboratory is quite laborious and considerably time consuming [3].
The main targets for stresses in the cell are its more important and large molecule, the DNA, and its membrane. In an industrial fermentation environment, for instance, targets for high temperature and organic acids are both cell membrane and DNA, while e.g. cations excess interacts mostly with the membrane. Focusing, initially, on heat and DNA, we note that if a cell culture is heated, the thermal energy increases molecular motion, eventually breaking DNA hydrogen bonds and other bonds that stabilize its double helix. As temperature increases, up to and above the so-called temperature of melting (around 83˚C), the strands separate (DNA denaturation) [9]. Under increasing temperature Brownian motion regime is intensified. As a consequence, it would be much more uncertain for the repair enzymes to reach and recognize the DNA damaged site, greatly enhancing the number of unrepaired DNA and, therefore, the number of cell deaths. Thus, yeast strains exhibiting e.g. capability for dominance and persistence, higher growth rate and productivity, are those which are quite repair proficient.
Gamma rays are photons that generate ions, which react with other molecules to produce free radicals. Reaction with water molecules of the cell interior gives rise to hydroxyl radicals (OH•), a quite harmful ROS (reactive oxygen specie). The primary target in the cell is DNA (the largest molecule). Ionizing radiation generates multiple types of DNA damage: base damage, SSBs (Single Strand Breaks), DSBs (Double Strand Breaks), and inter-strand cross-links. DNA bases are most affected, with more than 80 different types of structural modifications. For every 20 SSBs induced by gamma rays in DNA there is, on average, 1 DSB. If not repaired, DSBs prevent the replication of genomes and lead to cell death. Therefore, the survival of irradiated cells crucially depends on their capacity to repair DSBs. At very high doses (several kGy) the cell membrane could also be severely damaged [10]. It is then straightforwardly concluded that radioresistant yeast strains are also industrially robust.
Therefore, the most able strains resisting to stressing conditions of the industrial environment could be found through the selection of those with better recovering capability to radiation. In this sense, information on radioresistance and recuperation can work as a useful criterion for selection of strains with high proliferation potential under a condition of chemical stress.
The goal of this study is to develop a radiological method which simplifies traditional viability analysis and fermentative performance of industrial yeast strains, by avoiding the great number of necessary and consecutive fermentation assays required to this end. This method is implemented by means of radiosensitivity selection tests in two diploid industrial strains of S. cerevisiae: PE-2 and CAT-1.
2. MATERIALS AND METHODS
2.1. Yeast Strains and Growth Conditions
The following strains of the yeast S. cerevisiae were used: PE-2 and CAT-1 diploid industrial strains (isolated from ethanol fermentation plants) [3], and the laboratory model strain S288c (haploid). Yeast strains were cultivated in 50 mL YPD sterilized medium, in 125 mL shake flasks, sealed with cotton plugs and aluminum foil. YPD medium was composed by 10 g of yeast extract, 10 g of peptone and 20 g of dextrose, per liter of distilled water. All flasks were inoculated, under aseptic conditions, with 1 mL of 1% (w/v) yeast suspension (PE-2, CAT-1 or S288c), incubated for 24 hours at 30˚C under shaking at 80 rpm.
2.2. Irradiation and Analysis
Irradiation of the strain samples was carried out with a 60Co gamma source facility (Gammabeam, model 650 from MSD Nordion, Otawa, Canada), at doses of 300, 400, 600 and 1000 Gy. The geometry of the Gammabeam 60Co elements is 4 π sr, allowing for homogeneous irradiation of the samples. Immediately after irradiation the cells were inoculated in 50 mL (inoculum at 2% w/v) of YPD medium inside 125 mL shake flasks, at the same growing conditions described above. The cellular concentration per mL was determined from measurements of optical density in a spectrophotometer at 600 nm (Cary 50 Bio UV Visible Spectrophotometer, from Varian, Mulgrave, Australia), at time intervals of 0, 3, 6, 9, 12 and 24 hours after the end of irradiation, and using a previously obtained calibration curve (number of cells counted through optical microscopy versus optical density).
2.3. Statistical Handling
All measurements were performed in triplicate for each irradiation dose. Error bars appearing in Figures 1(a) and (b) represent external standard deviations. Data handling procedure consisted solely of data averaging; thus only the external standard deviation of the averaged values was calculated, a simple and conventional parametric statistic in the normal model [11]. We would like to point out that ANOVA-like analysis of variance is recommended only in situations where differences between sets of data are small and/or difficult to perceive, making objective conclusions an uncertain task, a circumstance not verified in this work. Standard deviations (σ) results from a combination of all systematic and statistical errors.
In order to quantitatively analyze all the results we introduced the concept of relative growth (N). This quantity is obtained by the division of each data point (at a given time t) of the samples irradiated at a given dose, by the corresponding data point (at the same time t) obtained at zero dose (non irradiated samples), that is,
 (1)
(1)
where Nirr is the cell concentration of the irradiated sample, measured at a time t, and Nnirr is the same for nonirradiated samples (zero dose). Since irradiation is an inhibiting growing factor, N(t) < 100%. Thus, the irradiated samples are always growing slower than the nonirradiated.
The standard deviation (σ) of N is obtained by a conventional error propagation expression [11] derived from Equation (1), that its,
 (2)
(2)
where σirr and σnirr are the corresponding standard deviations of Nirr and Nnirr, respectively.
3. RESULTS
The relative growth curves for all strains and for all doses exhibited the same qualitative characteristics (Figures 1(b) and 2(b)).
For a comparative appraisal of the radiosensibility of each strain we introduce a new quantity: the relative growth rate (ξ) defined as
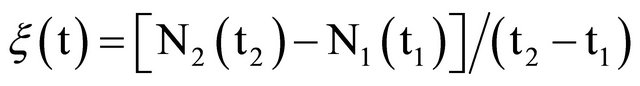 (3)
(3)
where N1 and N2 represent the relative growth at the instant of times t1 and t2 , respectively. Since N1 and N2 are nondimensional magnitudes, ξ is measured as h−1.
Likewise, the error bars displayed in Figures 3 and 4 correspond to standard deviation of ξ, calculated by error propagation [11] of N1 and N2 (see Equations (1) and (2)).
3.1. Relative Growth—Region I
In Figures 3(a) and (b) are the results for ξ calculated for data corresponding to the region I (Figures 1(b) and 2(b)) where t1 = 0 h and t2 = 6 h. Since N2(t2) < N1(t1) in this time interval, the quantity ξ represents a decreasing relative growth rate. For example, if ξ = 0.15 h−1 it means that after each hour the number of irradiated cells decreases by 15%.
3.2. Relative Growth—Region II
The relative growth rate (ξ) calculated with results from region II (Figures 1(b) and 2(b)) is shown in Figures 4(a) and (b). Since the relative growth in region II is an increasing function of the time, the corresponding ξ values are also increasing with time (see Equation (3)). In this case, the time interval is from t1 = 9 h to t2 = 24 h.
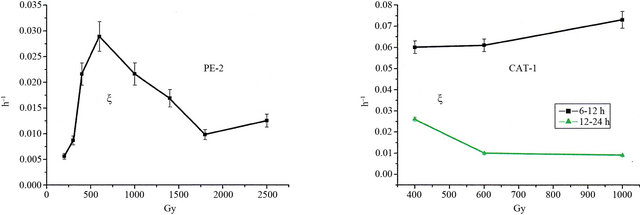
We observe in Figure 4(a) that the PE-2 exhibits (a) an increasing growing regime from 200 to 600 Gy, and (b) a decreasing regime from 600 to 2500 Gy. The peak at 600 Gy is equal to 3% (h−1), meaning that this strain is increasing at a rate of 3% per hour. This recuperation rate of the cultivation decreases from 3% to 1.2% per hour at 1800 Gy.
 (a) (b)
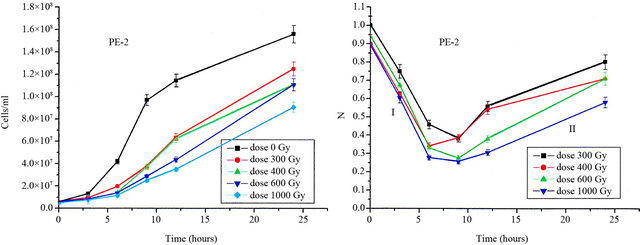
Figure 1. (a) Growing curves of the PE-2 S. cerevisiae strain submitted to several gamma radiation doses (measured in unities of cells/ml); (b) Relative growing curves (non dimensional quantity) corresponding to the growing curves shown in (a), where the labels I and II refer to distinct growing phases—see text for details. The points corresponding to 0 Gy dose represent Nnirr (Equation (1)).
 (a) (b)
Figure 2. (a) Growing curves of the CAT-1 S. cerevisiae strain submitted to several gamma radiation doses (measured in unities of cells/ml); (b) Relative growing curves (non dimensional quantity) corresponding to the growing curves shown in (a), where the labels I and II refer to distinct growing phases. The dotted lines between 6 h and 9 h are indicating that data in this interval are lacking—see text for details.
 (a) (b)
Figure 3. (a) Relative growing rates (measured in unities of h−1) of the PE-2 and CAT-1 S. cerevisiae strains as functions of the doses and corresponding to the time interval 0 h - 6 h; (b) Same as in (a) for the S-288 S. cerevisiae strain.
 (a) (b)
Figure 4. (a) Relative growing rates (measured in unities of h−1) of the PE-2 S. cerevisiae strain as a function of the doses and corresponding to the time interval 9 h - 24 h; (b) Same as in (a) for the CAT-1 S. cerevisiae strain, but calculated for the time interval splitted into 6 h - 12 h and 12 h - 24 h.
4. DISCUSSION
Since the relative growth is decreasing in region I the results for ξ are negative, but for the sake of simplicity we represent in Figures 3(a) and (b) only their absolute values. In this sense, the highest is the absolute value of ξ the more radiosensitive is the strain. We observe in Figures 3(a) and (b) a plateau for both strains, except for one quite low point at 200 Gy for the PE-2 strain.
The plateau for the PE-2 strain is delineated for ξ values from 9% to 10% (h−1), meaning that the relative growth is decreasing at a rate of approximately 10% per hour. For the CAT-1 strain the plateau is slightly higher, from 11% to 12.5% (h−1).
This flat behavior of ξ as a function of the dose in the interval 300 - 1000 Gy, indicates that the damaging effect of an increasing dose is compensated by the maintaining of the cell integrity [12,13]. For the S288c strain, on the other hand, ξ is much greater than the one for PE-2 and CAT-1, and is increasing from 40% to 65% (h−1) in the interval 100 - 400 Gy. It is an indication that the S288c strain is very radiosensitive [14] with a low capability to maintain cell integrity. Such a behavior is consistent with the fact that this strain is haploid [14].
The decreasing of the relative growth for incubation times up to 6 h is quite revealing, since it indicates that cell damages repair could take from seconds to hours [15]. However, reproductive processes, as e.g. cell division, take place only after successful damages repair and neutralization of the reactive agents produced in radiolysis, explaining thus the decreasing behavior of the relative growth in the interval 0 - 6 h (Figures 2(a) and (b)).
These results show that the PE-2 strain reaches a maximum recovering rate at 600 Gy, while at doses lower than 600 Gy its repair mechanism is capable to provide an efficient repair to the next generations. For doses higher than 600 Gy the cell repair mechanism would be proportionally affected by the increasing number of indirect radiation damages [10,13,15,16] (from radiolysis reactive agents), consequently diminishing the genetic integrity of the forthcoming cell generations.
Because of CAT-1 higher variation of its relative growth at region II, in comparison with PE-2, we decide to split the incubation time interval: 6 h - 12 h and 12 h - 24 h.
In the interval 6 h - 12 h CAT-1 exhibited recovering at a rate ξ » 6.5% (h−1) for 1000 Gy, approximately three times higher than the recovering rate for PE-2 in the entire interval, 6 h - 24 h (Figures 4(a) and (b)). Moreover, nearly all the recovering process of CAT-1 is verified from 6 h to 12 h (Figure 4(b)), while in the interval 12 h - 24 h it is already 100% recovered from the radiation stress. Even considering that the strain CAT-1 is growing faster than PE-2, in absolute values (Figures 1(b) and 2(b)), such circumstance does not explain why its recovering process rate is three times higher. This fact strongly suggests that the strain CAT-1 is endowed by high recovering levels because it has a robust repair mechanism, ensuring genomic integrity through successive generations.
5. CONCLUSIONS
In conclusion, the results of these studies demonstrate that:
1) Gamma radiation can be used as an alternative method to quantify growing capabilities of S. cerevisiae strains under stressing conditions.
2) This radiological method is an additional procedure to select best robust industrial strains.
3) This method also allows the evaluation of recovering capabilities in strains with industrial interest and, at the same time, to infer on their population permanence and genetic integrity against mutations originated by stresses in the fermentation devices.
4) The analysis of the relative growing rate (ξ) in the PE-2 and CAT-1 industrial strains revealed that the latter exhibited a better and faster recovering capability.
5) The radiological method here developed greatly simplifies traditional analysis of strain viability, by avoiding the great number of necessary and consecutive fermentation assays.
![]()
![]()
REFERENCES
- Abbott, D.A., Hynes, S.H., Ingledew, W.M. (2004) Growth rates of Dekkera/Brettanomyces yeasts hinder their ability to compete with Saccharomyces cerevisiae in batch corn mash fermentation. Applied Microbiology and Biotechnology, 66, 641-647.
- Silva-Filho, E.A., dos Santos, S.K.B., Resende, A.M., de Moraes, J.O.F., Morais Jr., M.A. and Simões, D.A. (2005) Yeast population dynamics of industrial fuel ethanol fermentation process assessed by PCR-fingerprinting. Antonie van Leeuwenkoek, 88, 13-23. doi:10.1007/s10482-004-7283-8
- Basso, L.C., Amorim, H.V., Oliveira, A.J. and Lopes, M.L. (2008) Yeast selection for fuel ethanol production in Brazil. FEMS Yeast Research, 8, 1155-1163. doi:10.1111/j.1567-1364.2008.00428.x
- Wheals, A.E., Basso, L.C., Alves, D.M.G. and Amorim, H.V. (1999) Fuel ethanol after 25 years. Trends in Biotechnology, 17, 482-487. doi:10.1016/S0167-7799(99)01384-0
- Basso, L.C., Paulilo, S.C.L., Rodrigues, D.A., Basso, T. O., Amorin, A.V. and Walker, G.M. (2004) Aluminium toxicity towards yeast fermentation and the protective effect of magnesium. International Congress on Yeasts— Yeasts in Science and Biotechnology The Quest for Sustainable Development, Book of Abstract, Rio de Janeiro, PB14.
- Dorta, C., Oliva-Neto, P., Abreu-Neto, M.S., NicoluJunior, N. and Nagashima, A.I. (2006) Synergism among lactic acid, sulfite, pH and ethanol in alcoholic fermentation of Saccharomyces cerevisiae (PE-2 and M-26). World Journal of Microbiology & Biotechnology, 22, 177-182. doi:10.1007/s11274-005-9016-1
- Barszczewski, W. and Robak, M. (2004) Differentiation of contaminating yeasts in brewery by PCR-based techniques. Food Microbiology, 21, 227-231. doi:10.1016/S0740-0020(03)00071-6
- Argueso, J.L., Carazzolle, M.F., Mieczkowski, P.A., Duarte, F.M., Netto, O.V., Missawa, S.K., Galzerani, F., Costa, G.G., Vidal, R.O., Noronha, M.F., Dominska, M., Andrietta, M.G., Andrietta, S.R., Cunha, A.F., Gomes, L.H., Tavares, F.C., Alcarde, A.R., Dietrich, F.S., McCusker, J.H., Petes, T.D. and Pereira, G.A. (2009) Genome structure of a Saccharomyces cerevisiae strain widely used in bioethanol production. Genome Research, 19, 2258-2270. doi:10.1101/gr.091777.109
- Lodish, H., Berk, A., Matsudaira, P., Kaiser, C.A., Krieger, M., Scott, M.P., Zipursky, L. and Darnell, J. (1999) Molecular cell biology. 4th Edition, Freeman & Co., New York.
- Alpen, E.L. (1990) Radiation chemistry. In: Alpen, E.L., Ed., Radiation Biophysics, Editora Prentice-Hall do Brasil, Rio de Janeiro.
- Caria, M. (2000) Measurement analysis. Imperial College Press, London.
- James, A.P. and Werner, M.M. (1969) Multiple-step recovery from heritable lethal sectoring in yeast. Genetics, 62, 533-541.
- James, A.P. and Nasim, A. (1987) Effects of radiation on yeast. In: Rose, A.H. and Harrsison, J.S., Eds., The Yeasts, 2nd Edition, Vol. 2, Academic Press, New York.
- Mortimer, R.K. and Johnston, J.R. (1886) Genealogy of principal strains of the yeast genetic stock center. Genetics, 113, 35-43.
- Hall, E.J. (2006) Physics and chemistry of radiation absorption. In: Hall, E.J. and Giaccia, A.J., Eds., Radiobiology for the Radiologist, 6th Edition, J.B. Lippincott Company, New York.
- Alpen, E.L. (1990) Theories and models for cell survival. In: Alpen, E.L., Ed., Radiation Biophysics. Editora Prentice-Hall do Brasil, Rio de Janeiro.