Modern Economy
Vol. 3 No. 2 (2012) , Article ID: 18132 , 4 pages DOI:10.4236/me.2012.32022
The Global Kuznets Curve, 1969-2007
1Department of Neurology, West Virginia University, Morgantown, USA
2Department of Finance, Banking and Insurance, Appalachian State University, Boone, USA
3Department of Statistics, West Virginia University, Morgantown, USA
4159th Aviation Brigade, United States Army, Fort Campbell, USA
Email: jriggs@wvu.edu, hobbsjc@appstate.edu, ghobbs@stat.wvu.edu, todd.riggs@us.army.mil
Received December 23, 2011; revised January 29, 2012; accepted February 16, 2012
Keywords: Economic Development; Global Economy; Income Inequality; Kuznets Curve
ABSTRACT
Noting increasing economic equality in three developed nations and using a theoretical economic model, Kuznets hypothesized that economic development was associated with initial increasing economic inequality followed by decreasing economic inequality. GDP and population data (1969-2007) from 36 nations and regions, comprising the entire global economy and population, demonstrate a global Kuznets curve.
1. Introduction
Kuznets [1] postulated a relationship between national economic development and income inequality based upon “5 per cent empirical information and 95 percent speculation”. Noting a trend towards income equality in three developed nations (the United States, England, and Germany), Kuznets [1] hypothesized that national economic development was associated initially with increasing economic inequality that was followed by decreasing economic inequality. This relationship describes the Kuznets curve, which is characterized by its distinctive inverted U shape. Kuznets [1] suggested that this curve was produced by the combined effects of urbanization and industrialization and resulted from the movement of the labor force from lower paying rural agricultural jobs to higher paying urban industrial jobs.
Kuznets [1], in presenting his theoretical model, acknowledged that, “In view of the importance of industrialization and urbanization in the process of economic growth, their implications for trends in the income distribution should be explored—even though we have neither the necessary data nor a reasonably complete theoretical model”. In his model, Kuznets [1] created a theoretical economy with two sectors, A and B. Sector A was agriculture. Sector B was non-agriculture. The assigned per capita income in A was 50 units. The assigned per capita income in B was either 100 units or 200 units. He further assumed two income distributions in each sector of this theoretical economy, E or U. In E, the lowest decile of the economy accounted for 5.5 percent of the total sector income and the highest decile of the economy accounted for 14.5 percent of the total sector income. There was a one percent difference between each decile in the economy (that is, each decile accounted for 5.5, 6.5, 7.5, 8.5, 9.5, 10.5, 11.5, 12.5, 13.5, and 14.5 percent of the total sector income increasing from the bottom to the top decile). In U, the lowest decile of the economy accounted for 1.0 percent of the total sector income and the highest decile of the economy accounted for 19.0 percent of the total sector income. There was a two percent difference between each decile in the economy (that is, each decile accounted for 1.0, 3.0, 5.0, 7.0, 9.0, 11.0, 13.0, 15.0, 17.0, and 19.0 percent of the total sector income increasing from the bottom to the top decile). Next, Kuznets allowed the portion of individuals in sector A to decline over time in 0.1 increments from 0.8 to 0.2. Kuznets then used the difference in the total income between the highest and the lowest quintile of his combined sectors A and B total population as his measure of income inequality over time as the population shifted from sector A to sector B. The parameters and assumptions that Kuznets [1] built into his theoretical model ensured that income inequality will initially increase as the population shifts from a population dominated by workers in sector A with a low per capita income and a set income distribution to a population dominated by workers in sector B with a higher per capita income and a set income distribution. In between the extremes of an all sector A or all sector B population, the income distribution range must be wider because it contains significant portions of individuals in both sectors A and B who have wide and different ranges of income.
Over the past half century, Kuznets curves have been both found and not found to exist within certain nations and regions [2-6]. This inconsistency in demonstrating the existence of Kuznets curves has caused many to question its meaning and to debate its significance [2-6]. Firebaugh [7] noted that “about seventy percent of the world’s total income inequality is between-nation income inequality as opposed to within-nation income inequality”. Significant disparity in income inequality, both within-nation and between-nation, was associated with the industrial revolution [8]. With continued globalization, narrowing of income disparities, or income convergence, both within-nation and between-nation, has been noted [8,9]. In this study, we sought to determine whether a global Kuznets curve exists looking at population-weighted between-nation/region per capita income.
2. Data & Methods
National and regional population and gross domestic product (GDP) estimates (in dollars adjusted to the year 2000) from 1969 through 2007 were obtained from the Economic Research Service of the United States Department of Agriculture (www.ers.usda.gov). This data set represented the longest period of time and included the best estimates of the total world economy and population that we could find. The data set was consolidated into 36 consistent nations and regions over this time period (Canada, United States, Mexico, Caribbean and Central America, Argentina, Brazil, Other South America, European Union 15, European Union New 10, Other Western Europe, Other Central Europe, Russia, Ukraine, Other Former Soviet Union, China, Hong Kong, Japan, South Korea, Taiwan, Other East Asia, Southeast Asia, Bangladesh, India, Pakistan, Other South Asia, Australia, New Zealand, Other Oceania, Iran, Iraq, Saudi Arabia, Turkey, Other Middle East, North Africa, Republic of South Africa, and Other Subsahara) such that the sum of their individual population and GDP estimates were equal to the total world population and GDP estimates. Annual per capita GDP (in 2000 dollars) was calculated for each of these 36 nations and regions and the world for the years 1969 through 2007.
3. Results
The mean world per capita GDP (Mean pcGDP) (in 2000 dollars) for the years 1969 through 2007 is shown in Table 1. The logarithm (base 10) of the annual mean world per capita GDP [LOG (Mean pcGDP)] is also shown in Table 1. The standard deviation of the population-weighted per capita GDP (SD pcGDP) of the 36 nations and regions analyzed in this study for the years 1969 through 2007 is also shown in Table 1. The coefficient of variation, defined as the standard deviation divided by the mean, is a commonly used measure of inequality. The population-weighted percent coefficient of variation (Percent CV) of per capita GDP for these 36 nations and regions was calculated and is shown in Table 1.
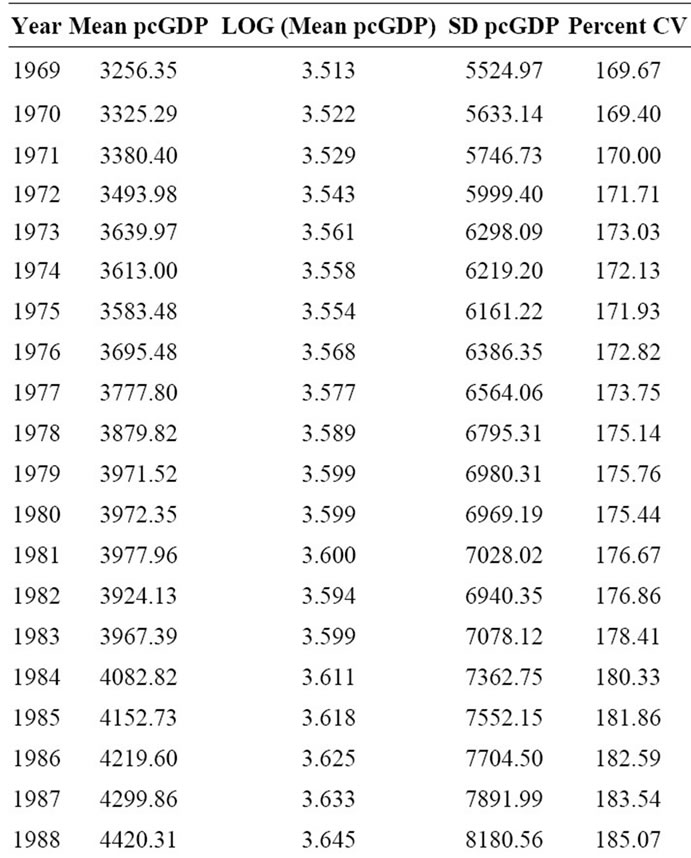
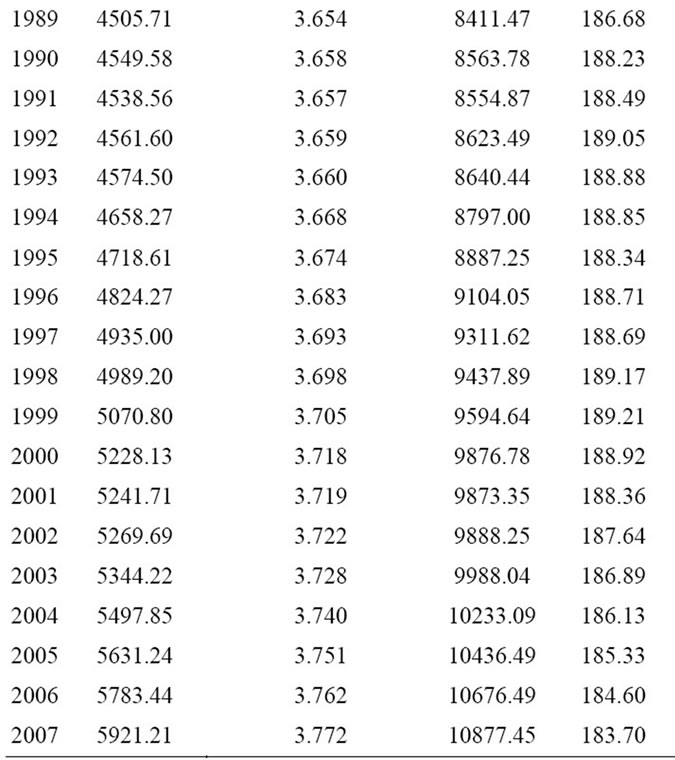
Table 1. Mean and logarithm (Log) of per capita (pc) GDP, standard deviation (SD) of pcGDP, and population-weighted percent coefficient of variation (CV) for the 36 nations/ regions comprising the global economy for 1969 through 2007.
Figure 1 shows the population-weighted percent coefficient of variation of per capita GDP plotted against year. This plot illustrates a distinctive inverted U shaped curve consistent with Kuznets’ hypothesis. Figure 2 shows the plot of the standard deviation of the population-weighted per capita GDP (in 2000 dollars) for the 36 nations and regions analyzed in this study for the years 1969 through 2007. As seen, this standard deviation increases in a very nearly linear fashion over time. Linear regression analysis of the data displayed in Figure 2 yielded the following equation:
 (1)
(1)
where SD pcGDP is the standard deviation of the population-weighted per capita GDP (in 2000 dollars) and YR is the year. The R2 value of the linear fit of the data displayed in Figure 2 is greater than 0.992. Figure 3 shows the plot of the logarithm of the mean world per capita GDP (in 2000 dollars) for the years 1969 through 2007. As seen, the logarithm of the annual mean per capita
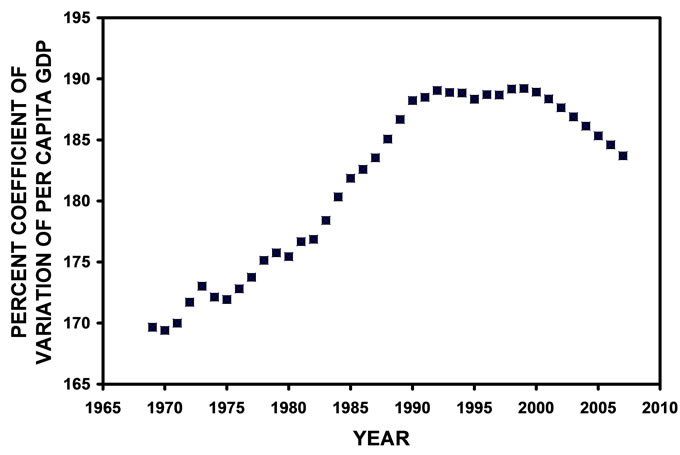
Figure 1. Annual population-weighted coefficient of variation of per capital GDP (in 2000 dollars) for the analyzed 36 nations/regions comprising the global economy and population for the years 1969 through 2007.
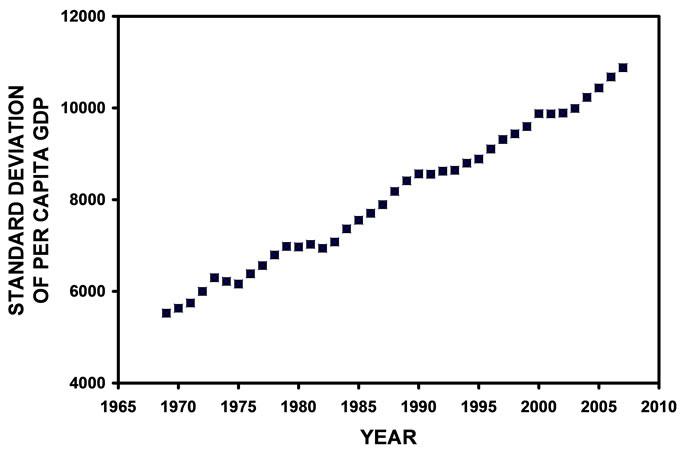
Figure 2. Annual standard deviation of per capital GDP (in 2000 dollars) for the analyzed 36 nations/regions comprising the global economy for the years 1969 through 2007.
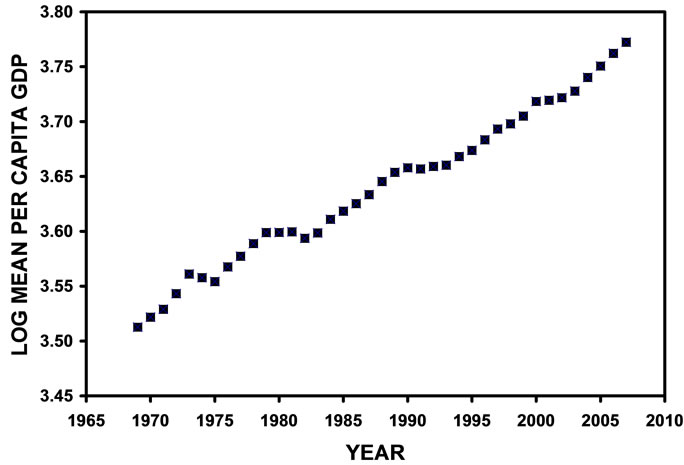
Figure 3. Logarithm (Log) of annual mean per capital GDP (in 2000 dollars) for the analyzed 36 nations/regions comprising the global economy for the years 1969 through 2007.
GDP also increases in a nearly linear fashion over time. Linear regression analysis of the data displayed in Figure 3 yielded the following equation:
 (2)
(2)
where Log (Mean pcGDP) is the logarithm of the mean world per capita GDP (in 2000 dollars) and YR is the year. The R2 value of the linear fit of the data displayed in Figure 3 is greater than 0.989.
4. Conclusions
Kuznets’ original hypothesis regarding economic development and income inequality was derived from a theoretical model of national economic development. The analysis performed in this study examined global international economic development and international economic inequality. Increasing globalization of the world’s economy might account, in part, for the failure of income inequality measures to follow a Kuznets curve in some individual nations or regions [2-6]. The relative ease of international capital and technology flow might obscure the intra-national labor flow originally suggested by Kuznets as the mechanism for producing the inverted U shaped curve relating national economic development and income inequality. Additionally, the development and evolution of a Kuznets curve might be affected by whether or not the economic data being examined are from a relatively open or closed economic system [10]. By including the entire global economy, as was done in this analysis, a “closed” economic system was analyzed that may have influenced the opportunity of observing a Kuznets curve.
This analysis also suggested that one possible explanation for the global Kuznets curve observed within the global economic data for the years 1969 through 2007 is related to the definition of the measure of economic inequality, the coefficient of variation, used in this analysis. The coefficient of variation is defined by the equation:
 (3)
(3)
in which CV is the coefficient of variation and SD is the standard deviation. Standard deviation is a measure of spread. The spread of the population weighted per capita income in the 36 nations and regions included in this study increased linearly between 1969 and 2007 (Figure 2). The mean world per capita income, however, increased exponentially between 1969 and 2007 (Figure 3). Initially, the approximately 137 dollar annual increase (from Equation (1)) in the standard deviation of the population-weighted global per capita income was increasing faster than the approximately 0.62 percent annual increases (from Equation (2)) in the mean global per capita income. The consequence of these two initial observations or conditions (from Equation (3)) is that the coefficient of variation, or economic inequality, must initially increase. However, since the mean global per capita income was increasing exponentially, eventually the exponentially increasing denominator in Equation (3) will dominate the arithmetically increasing numerator and the coefficient of variation, or economic inequality, must eventually begin to decrease, producing a Kuznets curve. It should be emphasized that this mathematical and statistical explanation for the global Kuznets curve demonstrated in this analysis should not be inferred as being the only possible or “true” explanation for producing this curve. Moreover, the Kuznets curve observed in this analysis was dependent not only on the initial conditions in the data, as previously noted, but also on the period of time over which the analysis was conducted. For example, had the analysis commenced in 1969 and ended in 1990 or commenced in 1990 and ended in 2007, a global Kuznets curve would not have been observed. In other words, the data set available and used in this analysis was opportune and fortunate with respect to its ability to contain and demonstrate a global Kuznets curve.
Although based upon “95 percent speculation” [1], this analysis supports Kuznets’ hypothesis concerning the relationship between economic development and income inequality. Despite its economic implications, the relative increasing economic equality of the world’s population may have even greater political implications and expectations with respect to future world political and economic development [11]. Although Kuznets originally addressed intranational economic inequality [1], this manuscript describes international economic inequality using mean per capita income differences among the 36 nations and regions that comprised the entire global economy. This analysis did not describe or address intranational economic inequality.
REFERENCES
- S. Kuznets, “Economic Growth and Income Inequality,” American Economic Review, Vol. 45, No. 1, 1955, pp. 1-28.
- S. Robinson, “A Note on the U Hypothesis Relating Income Inequality and Economic Development,” American Economic Review, Vol. 66, No. 3, 1976, pp. 437-440.
- M. Braulke, “A Note on Kuznets’ U,” Review of Economics and Statistics, Vol. 65, No. 1, 1983, pp. 135-139. doi:10.2307/1924418
- R. Ram, “Kuznets’s Inverted-U Hypothesis: Evidence from a Highly Developed Country,” Southern Economic Journal, Vol. 57, No. 11, 1991, pp. 1112-1123. doi:10.2307/1060338
- O. Galor and D. Tsiddon, “Income Distribution and Growth: The Kuznets Hypothesis Revisited,” Economica, Vol. 63, No. 250, 1996, pp. S103-S117. doi:10.2307/2554811
- T. P. Moran, “Kuznets’s Inverted U-Curve Hypothesis: The Rise, Demise, and Continued Relevance of a Socioeconomic Law,” Sociological Forum, Vol. 20, No. 2, 2005, pp. 209-244. doi:10.1007/s11206-005-4098-y
- G. Firebaugh, “The Trend in Between-Nation Income Inequality,” Annual Review of Sociology, Vol. 26, No. 1, 2000, pp. 323-339. doi:10.1146/annurev.soc.26.1.323
- J. G. Williamson, “Globalization, Convergence, and History,” Journal of Economic History, Vol. 56, No. 2, 1996, pp. 277-306. doi:10.1017/S0022050700016454
- D. Park, “An Examination of Global Income Convergence,” Journal of Economic Development, Vol. 22, No. 1, 1997, pp. 43-55.
- S. Dobson and C. Ramlogan, “Is There an Openness Kuznets Curve?” Kyklos, Vol. 62, No. 2, 2009, pp. 226- 238. doi:10.1111/j.1467-6435.2009.00433.x
- D. Acemoglu and J. A. Robinson, “The Political Economy of the Kuznets Curve,” Review of Development Economics, Vol. 6, No. 2, 2002, pp. 183-203. doi:10.1111/1467-9361.00149