Journal of Biophysical Chemistry
Vol.4 No.2(2013), Article ID:31766,8 pages DOI:10.4236/jbpc.2013.42008
Validation of the CHARMM27 force field for nucleic acids using 2D nuclear overhauser effect spectroscopy
![]()
Latvian Institute of Organic Synthesis, Aizkraukles 21, Riga, Latvia; *Corresponding Author: edv@osi.lv
Copyright © 2013 Kirill Zinovjev, Edvards Liepinsh. This is an open access article distributed under the Creative Commons Attribution License, which permits unrestricted use, distribution, and reproduction in any medium, provided the original work is properly cited.
Received 2 February 2013; revised 5 March 2013; accepted 15 March 2013
Keywords: Nucleic Acids; Molecular Dynamics; Overhauser Effect; NOESY; Force Field
ABSTRACT
Nuclear magnetic resonance spectroscopy offers a powerful method for validation of molecular dynamics simulations as it provides information on the molecular structure and dynamics in solution. We performed 10 ns MD simulations using the CHARMM27 force field of four palindromic oligonucleotides and compared the results with experimental NOESY data using the full relaxation matrix formalism. The correlation coefficients between theoretical and experimental data for the four molecular species under study ranged from 0.82 to 0.98 confirming the high quality of the selected force field and providing a valid basis for the identification of force field imperfections. Hence, we observed an unsatisfactory treatment of deoxyribose conformational equilibrium, which resulted in the overrepresentation of the energetically favorable C3’-endo conformation in the MD trajectory. Our developed approach for force field validation based on NMR NOESY spectral data is applicable to a wide range of molecular systems and appropriate force fields.
1. INTRODUCTION
During the last two decades, molecular dynamics has become a popular tool for the analysis of nucleic acids and their complexes with proteins [1,2]. This technique provides information on atomic level that is very difficult or even impossible to obtain using available experimental techniques. Existing force fields yield stable simulations on the nanosecond timescale that is sufficient to study the stability of DNA complexes, solvation, interactions with ions and ligands and other processes that are of particular interest in structural biology.
However, as for any other simulation technique, the precision of MD trajectories should be validated using experimental data [3,4]. The molecular mechanics calculations inevitably introduce imprecisions into the simulated system and the influence of such imprecisions on the trajectories is usually difficult to estimate during the parameterization process. Because force field parameters determine both structural and dynamical features of the simulated system, the experimental information used for MD validation should cover both of these aspects.
One of the available experimental methods that gives information both on structure and dynamics of a molecular object is the nuclear Overhauser effect (NOE) [5, 6]. It is widely used to solve complicated problems in stereochemistry [7] as well as for protein structure determination [8,9] in structural biology, but it is surprisingly rarely used for MD validation. Using NMR theory, it is possible to estimate the magnitude of an NOE by analyzing the MD trajectories, since they provide information about local and global dynamics of a molecule [10]. The comparison of MD-derived and experimental NOEs should yield the information on how precise the simulation is and highlight possible weaknesses of the force field.
Several studies show the use of MD data for investingation of the influence of different factors on the NOE as well as for interpretation of the spectral data. Arthanari et al. [11] used the NOESY spectra and scalar couplings to estimate the precision of MD trajectories. However, the level of theory used was insufficient to adequately treat all the effects that influence the experimental spectra. This resulted in low correlation coefficients between theoretical and experimental datasets. Feenstra et al. [12] calculated NOESY and ROESY spectra for a nine-residue peptide using different approaches and discussed the importance of the precision and length of the MD trajectories for the quality of the calculated spectra.
In the present study, the NMR NOESY technique was used to validate 10 ns MD simulations of four oligonucleotides calculated using the CHARMM27 force field [13,14]. The simulated trajectories were used to obtain theoretical NOEs on the basis of the full relaxation matrix formalism [15]. The importance of the correct treatment of spin diffusion and internal dynamics was evaluated by using less precise calculations and comparing the derived results with those acquired from the complete back-calculation.
2. THEORETICAL BACKGROUND
The spin polarization transfer between the two nuclei that gives rise to the Nuclear Overhauser Effect (NOE) is quantitatively described using the Solomon equation [7]:
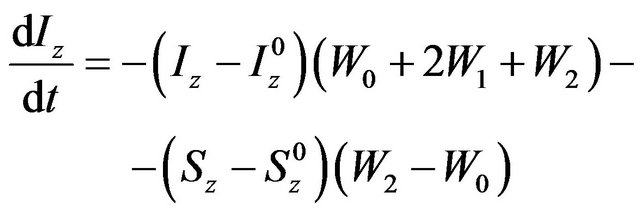 (1)
(1)
where Iz, Sz are the longitudinal magnetizations of nucleus I and S, respectively,  ,
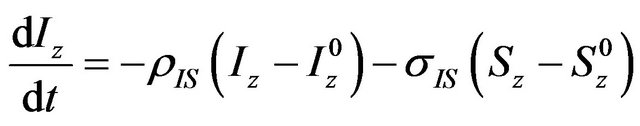
, —longitudinal magnetization in equilibrium, Wn—n-quantum coherence. Equation (1) can be rewritten in terms of relaxation constants:
 (2)
(2)
where σ and ρ are cross-relaxation and direct dipolar relaxation constants, respectively. This is a first order differential equation that describes the magnetization transfer between two nuclei. In case of three or more interacting nuclei, (2) converts to a system of N coupled first order differential equations, where N is the number of nuclei. This system can be represented in matrix form:
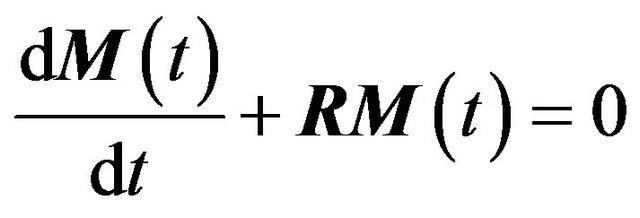 (3)
(3)
where M(t)—matrix with NOESY intensities after the mixing time t, R—relaxation matrix, Rii = ρi, Rij = σij. The solution of this equation system is:
 (4)
(4)
where Λ—diagonal matrix with eigenvalues of R, X— matrix with eigenvectors of R. To obtain a solution, elements of the relaxation matrix need to be calculated. These are directly connected to the spectral density function J(ω). In case of homonuclear interaction:
 (5)
(5)
 (6)
(6)
 (7)
(7)
where ω—nucleus Larmour frequency, μ0—magnetic constant, γ—nucleus gyromagnetic ratio, r—distance between nuclei.
In this work, the calculation of spectral density function is made using the Lipari-Szabo formalism [10]. Hence, the overall molecular motions are assumed to be separated from internal ones and the total correlation function for the motions of two nuclei is written as:
 (8)
(8)
where C(t)—total correlation function, CO(t)—overall rotation correlation function, CI(t)—internal motion correlation function. The overall rotation was approximately described as isotropic:
 (9)
(9)
where τO—overall rotation correlation time.
The internal motion correlation function is calculated as follows [16]:
 (10)
(10)
where P2—second order Legendre polynomial, P2(x) = 1.5x2—0.5, χt,t + τ—angle between internuclear vectors at time t and t + τ, r(t)—internuclear vector length. This function can be directly calculated from the MD trajectory.
In the Lipari-Szabo formalism, CI(τ) is described as:
 (11)
(11)
where S—order parameter, τI—internal motion correlation time. These parameters are derived from the CI(t) as follows:
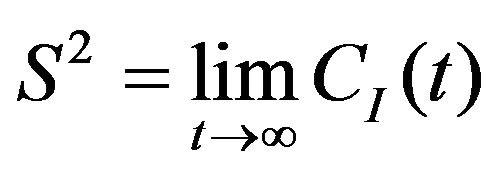 (12)
(12)
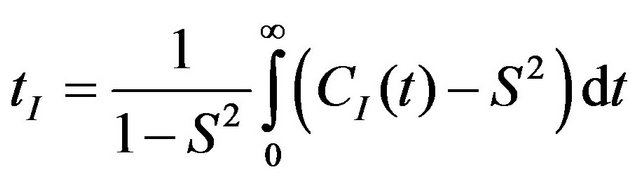 (13)
(13)
this calculation is performed for each internuclear vector of interest, and the spectral density function is calculated. In the Lipari-Szabo formalism the corresponding equation is:
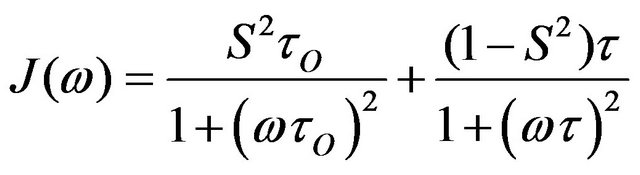 (14)
(14)
where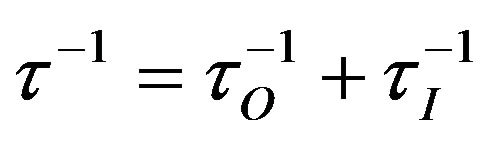 . Subsequently, the relaxation parameters are calculated and the relaxation matrix is built. By solving Equation (3) for a given mixing time, the theoretical NOESY spectrum is acquired.
3. MATERIALS AND METHODS
3.1. NMR Experiments and Spectral Analysis
Four DNA samples: d(CGCACGTGCG), d(CGCATC GATGCG), d(GAGTGTACACTC) and d(GAATATATA TTC) were dissolved in 90% H2O/ 10% D2O. The pH of all samples was adjusted to 7.0, the oligonucleotide concentration was 5.0 mM.
NOESY spectra were collected at 25˚C on a Varian Unity INOVA 600 MHz spectrometer equipped with a HCN z-gradient cold probe. NOESY spectra were recorded with 100 ms mixing time. The water peak was suppressed using the WATERGATE 3-9-19 pulse sequence [17]. All spectra were acquired with 2048 and 512 complex points in the F2 and F1 dimensions, respect tively and t1max = 0.128 s t2max = 0.163 s. The relaxation delay was 1 s. All spectra were referenced to the water signal at 4.77 ppm relative to DSS. Time domain data were zero filled twice in both dimensions, multiplied with cosine window functions and processed with NmrPipe [18]. Further analysis was done using the XEASY [19] software. Peak volumes were derived by integrating an elliptical region around the peak above the noise level.
3.2. MD Simulations
The computational part of the present study consisted of three stages: system construction, calculation of MD trajectories and NOESY spectra back-calculation. The initial system in each case contained the corresponding oligonucleotide in the canonical B form and an orthorhombic water shell with an at least 20 A thick layer of water in each direction. To neutralize the system, Na+ ions were added at favorable positions using the MEAD software [20]. Canonical structures were generated using the MOE software [21], while all other manipulations were performed using VMD [22].
10 ns MD calculations were carried out using the NAMD 2.6 program [23] with the CHARMM27 force field. All the simulations were performed on the CYFRONET computer cluster [24], offered within the frame of the BalticGrid II project [25]. Standard molecular dynamics techniques were used, including periodic boundary conditions, the velocity Verlet integrator [26] and SHAKE [27], to allow an integrator time step of 2 fs. The isobaric-isothermal ensemble (NPT) was used for the simulations. Pressure and temperature were maintained at 1 atm and 298 K, respectively, with temperature controlled via Langevin dynamics for all non-hydrogen atoms and pressure regulated via a hybrid Nosé-Hoover Langevin piston [28]. Long range electrostatics were treated by the PME algorithm [29] with a grid density of more than 1/Å in every dimension. A 12 Å cutoff for non-bonded short-range interactions was used. The following 5 stage equilibration scheme was used: 1000 step minimization, 100 ps simulation at 100 K temperature with fixed DNA, 100 ps simulation with the gradual temperature increase to 298 K, 500 ps simulation gradually decreasing harmonic potential on DNA atoms from 1 to 0 kcal/mol*A2 and 1 ns simulation for the unrestrained system. Subsequently, the 10 ns productive simulation was performed. Snapshots were saved every 10 ps. The analysis had shown that a more frequent saving did not significantly change the results. All the snapshots were aligned to minimize the RMSD of all non-hydrogen DNA atoms.
3.3. NOESY Spectra Calculations
The back-calculation of NOESY spectra was performed using in-house software. Time-correlation functions were calculated only for protons less than 5.5 A apart. Methyl groups were treated explicitly. The relaxation time for the overall tumbling in each case was chosen to minimize the deviation between theoretical and experimental NOEs to exclude the error caused by the incorrect viscosity of the TIP3P water model [30]. The relaxation rates were calculated and the system of coupled differential equations was solved as described in [16]. The theoretical intensities were normalized so that the mean intensity in each dataset was equal to 1. Theoretical spectra were calculated using three approaches:
1) The complete back-calculation of the spectra by building the full relaxation matrix (further denoted as “complete”).
2) The back-calculation with all internal dynamics excluded by assuming the order parameter for all proton pairs equal to 1 (“rigid”).
3) The “r−6” approach—NOEs are assumed to be proportional to the inverse sixth power of mean distances between protons averaged over the whole trajectory.
4. RESULTS AND DISCUSSION
4.1. Experimental Spectra
The concentration of all samples was appropriate and the mixing time was sufficiently long to achieve pronounced cross-peaks that can be precisely integrated. Only those peaks that are clearly distinguished and therefore are easy to integrate were used for analysis. The number and types of peaks used are shown in Table 1.
Due to water resonance suppression, peaks in the H2’/2”-H3’ region could not be precisely integrated and therefore were not used for validation of MD simulations. The labile NH protons are located in low field region and
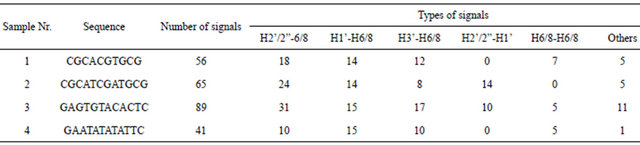
Table 1. The number and types of peaks from each sample that were used for comparison with theoretically derived intensities.
the corresponding cross-peaks are affected by the water suppression regime and by exchange with water. These peaks were not used for MD validation either.
The least information is gained for the sample 4. The reason is the strong sequence regularity (ATATATAT fragment) that causes the chemical shifts of nucleotide protons in positions of 4,6,8 and 5,7,9 to be almost equal. This gives strong overlap of peaks in the H2’/2”-H6/8 region of spectra.
4.2. Comparison of Theoretical and Experimental Intensities
The assessment of MD simulations was performed using three different metrics—the Pearson’s R2, the NOE R-factor and the RMSD calculated as in [11]. The calculations using the three above mentioned approaches were performed for each simulation. Also the theoretical spectra for canonical A and B DNA structures were calculated using the “rigid” approach. The results are shown in Table 2.
The R2 values for the “complete” approach lie between 0.82 and 0.98, indicating the high precision of the MD trajectories. The correlation is significantly better than obtained by Arthanari et al. and slightly better that in [12]. However, the results are not surprising because the “r−6” approach and analysis of the highly flexible peptide are presented in these papers, respectively. In fact, in the present study the application of the “r−6” approach gave results comparable to those presented by Arthanari et al.
The convergence of theoretical NOE intensities was assessed by calculating the RMSD values for simulations of different lengths (Figure 1). It is clearly seen that the deviation exponentially falls until approximately 5 ns and after that do not exhibit significant changes. The high RMSD values for 1 - 2 ns long trajectories can be easily explained by the fact that time correlation functions did not converge. That yields erroneous data on correlation times and order parameters.
4.3. Outliers
Since any force field (even with ideally selected parameters) is based on approximated potentials, the information gained from the MD trajectories will inevitably deviate from the experimental data. Such deviations, along with the spectrum integration errors and inaccuracy of the simulation system, explain most imprecisions of the theoretically acquired NOE intensities (Figure 2). However, there are several points that deviate more than expected from the experiment. Since it is very difficult to determine which peaks deviate due to the above mentioned factors and which are “over-deviating”, the threshold is set manually so that outliers would represent similar interatomic vectors. That approach is based on the logical assumption that particular imprecisions in the force field parameter set or in the experimental technique would cause a particular type of NOE’s to deviate sys-
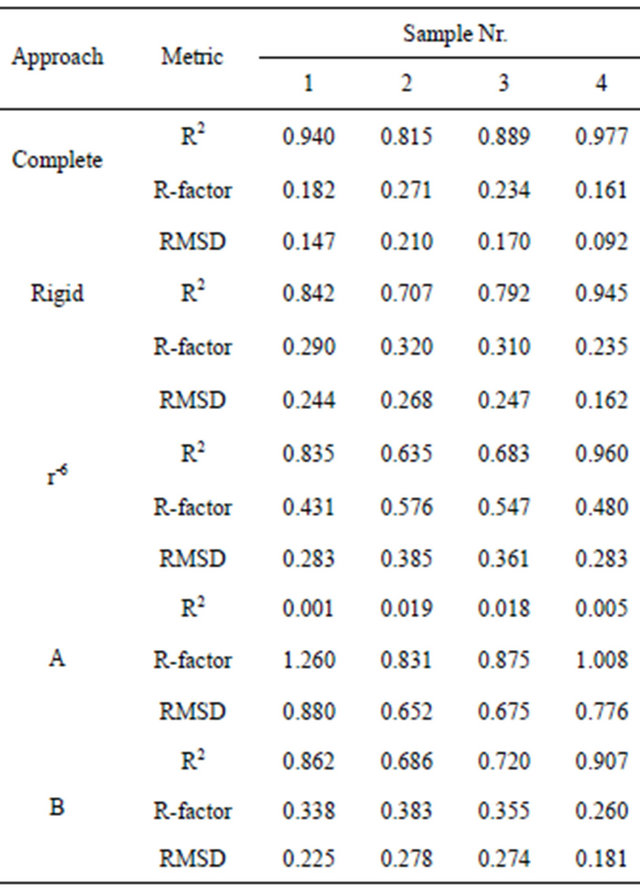
Table 2. The comparison of theoretical and experimental NOESY spectra.
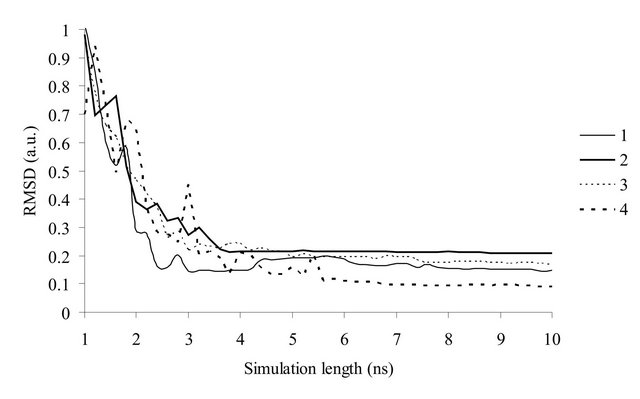
Figure 1. The dependence of the RMSD values from the simulation length of trajectories. The samples are numbered in the same way as in Table 1.
tematically. In total, 15 theoretical NOE’s were assumed as outliers and are shown in Table 3.
All the outliers (except Nr.13, Table 3) correspond to H2’/2”-H6/8 or H2’-H1’ peaks. The only peak that does not fit into this pattern (Nr.13, Table 3) belongs to the methyl group of thymine. Since there are very few such signals in the dataset, it is hard to describe the underestimation of this peak. It could be caused by incorrect treatment of the internal relaxation of methyl groups. In most cases H2’ peaks exhibit a positive deviation, while H2” peaks exhibit a negative one. This tendency holds for both intra and internucleotide signals.
Since the order parameters of outliers are similar to those of correctly predicted signals, the main reason for the imprecision should be the average distance between nuclei. The DNA molecules have 7 structural orders of freedom for each nucleotide—5 backbone torsions, the pseudorotation angle P of the deoxyribose ring and the glycosidic angle χ [31]. However, only the last two have the largest influence on the H2’/2”-H6/8 distance. The glycosidic angle is relatively conserved, therefore it could not cause large selective imprecisions in the MD trajectory. Therefore, the pseudorotation angle is probably the main factor that cause the theoretical NOE’s to be incorrect. The angle P usually is between 140˚ and 185˚ (C2’-endo conformation, S) or between −10˚ and 40˚ (C3’-endo conformation, N). The equilibrium between these two states is a sensitive parameter and the inability of the force field to correctly represent it would not be surprising.
Indeed, if the nucleotide 6G sugar in the sample 1 would relatively longer stay in the N conformation, the distance between 6H2” and 6H8 become larger while the distance 5H2’-6H8 become shorter. NOE will respectively increase and reduce that decreases the deviation from experimental data in both cases. The systematic underestimation of N conformation probability explain the signs of deviations of H2’ and H2” signals. The systematical analysis of various oligonucleotides could yield
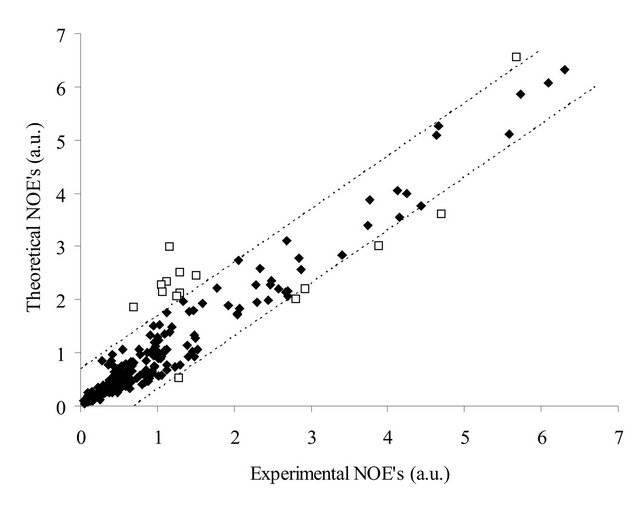
Figure 2. The correlation between theoretical and experimental NOE’s for all 4 samples. The dotted lines define the threshold for outliers. Outliers are shown as empty squares.
the sequence dependent deviations between MD results and experimental data. However, in the present study the survey is too small to make any predictions about the precision of the representation of a given sequence.
The incorrectness of predicted H2’-H1’ signals can not be described by the difference in deoxyribose conformation equilibrium in MD trajectory and experiment since these distances minimally differ in S and N states. In this case the error most likely rises from the water suppression profile that is used during the spectra acquisition. The WATERGATE 3-9-19 sequence also affects the signals that are in close vicinity to the water resonance (4.77 ppm), for example, H1’ protons (5 - 6.5 ppm). This causes the experimental NOE’s to be smaller than the theoretical ones. Indeed, the deviation is larger for those H1’ signals, that are located in higher fields, hence are closer to the water signal. Surprisingly that H2”-H1’ signals are not present among the outliers, while they should be suppressed by the WATERGATE pulse as well. The reason for that is smaller intensity of NOE’s that do not allow distinguishing the WATERGATE effect from other factors.
4.4. Applicability to Force Field Parameterization
The results of the analysis show that the NOE is quite sensitive to imprecisions caused by the force field used. Despite all the factors that influence NOEs and are very difficult or even impossible to treat in simulations (other relaxation pathways, salt influence, solute interactions etc.), most significant deviations are easily distinguishable and interpretable and can bring valuable information on how to optimize force field parameters and improve correlation. This is especially the case for model compounds, where the number of parameters is much smaller
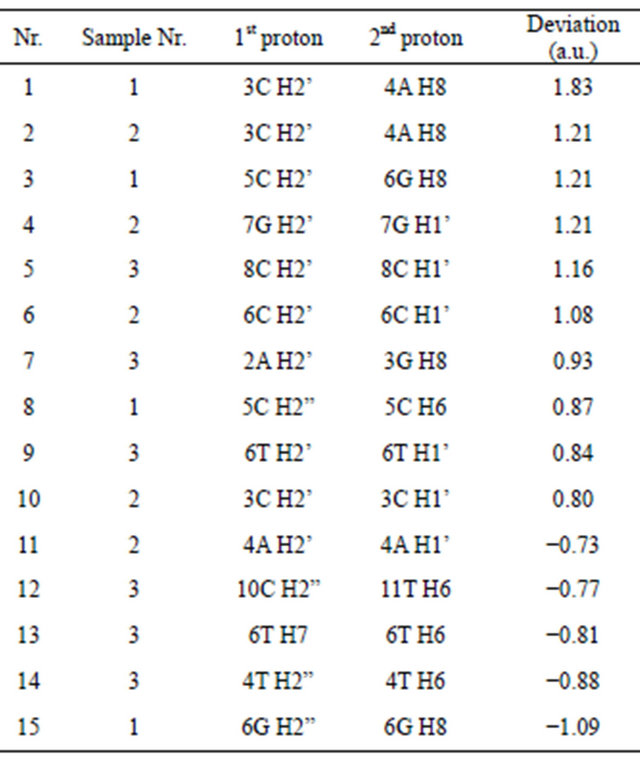
Table 3. Theoretical NOE’s that deviate (in arbitrary units) most from the experimental data.
and they can be unambiguously connected to structural and dynamical features. Also it is much easier to perform a nanoscale MD simulation for the model compounds, where the number of atoms for a fully hydrated system could be just about 10,000 atoms. In the case of moderately flexible compounds (with about 5 rotatable bonds) a 10 - 20 ns trajectory should be sufficient for all internal motions to converge. For more flexible compound, such as oligopeptides, the trajectories should be much longer. The success of 10 ns simulations in the present work can be described by the fact that oligonucleotides are compounds with highly conserved secondary structure, therefore the actual number of orders of freedom is not large. This is not the case for oligopeptides that should be used for protein force field validation. In this case, much longer MD simulations are necessary to gather the reliable information on internal dynamics. However, the parameterization process is based on the variation of parameters to optimize the correlation with experimental or QM data. Different parameter sets could be used to launch several MD calculations in parallel to save time. It can be easily achieved using GRID calculations.
The other aspect that makes NOE particularly interesting for force field parameterization is its complementarity to other experimental techniques used for this task. While X-ray crystallography gives only structural information in an unnatural crystal environment, IR spectroscopy yields data about vibrational frequencies and calorimetric methods give insight into the energetics of the molecule, NOE gives direct information on internuclear vectors, both their length and behavior. Therefore, the information obtainable from NOESY spectra is unique and cannot be gathered by other approaches. The usage of additional experimental data is extremely helpful when dealing with the parameter correlation problem, mentioned by the CHARMM27 force field authors [13].
Finally, the proton assignment that is the main step of the analysis of NOESY spectra can be directly used to get the structural and dynamical information by other NMR techniques. For example, COSY spectra yield information on torsion angles in various molecular systems. The NOESY peak assignment can be used for COSY or other two-dimensional 1H-1H spectra interpretation with no additional transformation.
5. SUMMARY AND CONCLUSIONS
The present study was focused on the application of NOEs to validate the precision of MD simulations. 1H- 1H NOESY spectra of four oligonucleotides were analyzed and compared to theoretical intensities, calculated from 10 ns MD trajectories performed using the CHARMM27 force field. The spectra back-calculation was performed using the full relaxation matrix formalism, all protons were treated explicitly. The correlation between theoretical and experimental NOE intensities is sufficiently high, indicating the quality of the force field used. However, several theoretical signals differed significantly from the experimental ones. The large error of H2’-H1’ signals was explained by the water resonance suppression profile, while the deviations of H2’/2”-H6/8 signals most likely are the consequence of the incorrect deoxyribose conformational equilibrium representation in MD trajectories.
The analysis showed that the NOE is a sensitive parameter that can be used to validate or optimize existing force fields of nucleic acids, proteins or other molecular objects. It is complementary to other techniques and therefore can significantly increase the precision and unambiguity of existing parameter sets.
6. ACKNOWLEDGEMENTS
The We are pleased to acknowledge the BalticGrid II project (FP7- INFRA-2007-1.2.3: e-Science Grid infrastructures, contract No 223807. www.balticgrid.org) for the possibility to perform calculations on the CYFRONET cluster (Poland) and especially Janis Kulinsh and Lauris Cikovskis for the help with the usage of BalticGrid infrastructure.
This research was supported by the ESF grant 2009/0203/1DP/ 1.1.1.2.0/09/APIA/VIAA/023.
REFERENCES
- Mackerell, A.D. (2004) Empirical force fields for biological macromolecules: Overview and issues. Journal of Computational Chemistry, 25, 1584-1604. doi:/10.1002/jcc.20082
- Cheatham III, T.E. and Kollman, P.A. (2000) Molecular dynamics simulation of nucleic acids. Annual Review of Physical Chemistry, 51, 435-471. doi:/10.1146/annurev.physchem.51.1.435
- Hayre, N.R., Singh, R.R.P. and Cox, D.L. (2011) Evaluating force field accuracy with long-time simulations of a beta-hairpin tryptophan zipper peptide. The Journal of Chemical Physics, 134, 035103. doi:/10.1063/1.3532931
- Geerke, D.P. and van Gunsteren, W.F. (2006) Force field evaluation for biomolecular simulation: Free enthalpies of solvation of polar and apolar compounds in various solvents. ChemPhysChem, 7, 671-678. doi:/10.1002/cphc.200500510
- Anderson, W.A. and Freeman, R. (1962) Influence of a second radiofrequency field on high-resolution nuclear magnetic resonance spectra. The Journal of Chemical Physics, 37, 85-103. doi:/10.1063/1.1732980
- Kaiser, R. (1963) Use of the nuclear overhauser effect in the analysis of high-resolution nuclear magnetic resonance spectra. The Journal of Chemical Physics, 39, 2435-2442. doi:/10.1063/1.1734045
- Neuhaus, D. and Williamson, M.P. (2000) The nuclear overhauser effect in structural and conformational analysis. Wiley-VCH, Chichester.
- Cavanagh, J., Fairbrother, W.J., Arthur, I., Palmer, G., Skel- ton, N.J. and Rance, M. (2010) Protein NMR spectroscopy: Principles and Practice. Elsevier Science, Amsterdam.
- Wüthrich, K. (1986) NMR of proteins and nucleic acids. Wiley, Chichester.
- Lipari, G. and Szabo, A. (1982) Model-free approach to the interpretation of nuclear magnetic resonance relaxation in macromolecules. Analysis of experimental results. Journal of the American Chemical Society, 104, 4559- 4570. doi:/10.1021/ja00381a010
- Arthanari, H., McConnell, K.J., Beger, R., Young, M.A., Beveridge, D.L. and Bolton, P.H. (2003) Assessment of the molecular dynamics structure of DNA in solution based on calculated and observed NMR NOESY volumes and dihedral angles from scalar coupling constants. Biopolymers, 68, 3-15. doi:/10.1002/bip.10263
- Feenstra, K.A., Peter, C., Scheek, R., van Gunsteren, W. and Mark, A. (2002) A comparison of methods for calculating NMR cross-relaxation rates (NOESY and ROESY intensities) in small peptides. Journal of Biomological NMR, 23, 181-194. doi:/10.1023/A%3A1019854626147
- Foloppe, N. and MacKerell, J.A.D. (2000) All-atom empirical force field for nucleic acids: I. Parameter optimization based on small molecule and condensed phase macromolecular target data. Journal of Computational Chemistry, 21, 86-104. doi:/10.1002/(SICI)1096-987X(20000130)21:2<86::AID-JCC2>3.0.CO;2-G
- MacKerell, A.D. and Banavali, N.K. (2000) All-atom empirical force field for nucleic acids: II. Application to molecular dynamics simulations of DNA and RNA in solution. Journal of Computational Chemistry, 21, 105-120. doi:/10.1002/(SICI)1096-987X(20000130)21:2<105::AID-JCC3>3.0.CO;2-P
- Keepers, J.W. and James, T.L. (1984) A theoretical study of distance determinations from NMR. Two-dimensional nuclear overhauser effect spectra. Journal of Magnetic Resonance, 57, 404-426. doi:/10.1016/0022-2364(84)90257-9
- Peter, C., Daura, X. and van Gunsteren, W.F. (2001) Calculation of NMR-relaxation parameters for flexible molecules from molecular dynamics simulations. Journal of Biomological NMR, 20, 297-310. doi:/10.1023/A:1011241030461
- Sklenar, V., Piotto, M., Leppik, R. and Saudek, V. (1993) Gradient-tailored water suppression for 1H-15N HSQC experiments optimized to retain full sensitivity. Journal of Magnetic Resonance, Series A, 102, 241-245. doi:/10.1006/jmra.1993.1098
- Frank, D., Stephan, G., Geerten, W.V., Guang, Z., John, P. and Ad, B. (1995) NMRPipe: A multidimensional spectral processing system based on UNIX pipes. Journal of Biomological NMR, 6, 277-293. doi:/10.1007/BF00197809
- C. Bartels, T.-h. Xia, M. Billeter, P. Güntert, K. Wüthrich (1995) The program XEASY for computer-supported NMR spectral analysis of biological macromolecules. Journal of Biomological NMR, 6, 1-10. doi:/10.1007/BF00417486
- Bashford, D. and Gerwert, K. (1992) Electrostatic calculations of the pKa values of ionizable groups in bacteriorhodopsin. Journal of Molecular Biology, 224, 473-486. doi:/10.1016/0022-2836(92)91009-E
- Chemical Computing Group Inc. Montreal. http://www.chemcomp.com
- Humphrey, W., Dalke, A. and Schulten, K. (1996) VMD: Visual molecular dynamics. Journal of Molecular Graphics, 14, 33-38. doi:/10.1016/0263-7855(96)00018-5
- Phillips, J.C., Braun, R., Wang, W., Gumbart, J., Tajkhorshid, E., Villa, E., Chipot, C., Skeel, R.D., Kalé, L. and Schulten, K. (2005) Scalable molecular dynamics with NAMD. Journal of Computational Chemistry, 26, 1781- 1802. doi:/10.1002/jcc.20289
- Academic Computer Centre CYFRONET. https://www.cyfronet.pl
- BalticGrid-II. http://www.balticgrid.org
- Allen, P. and Tildesley, D.J. (1987) Computer simulation of liquids. Clarendon Press, Oxford.
- Ryckaert, J.-P., Ciccotti, G. and Berendsen, H.J.C. (1977) Numerical integration of the cartesian equations of motion of a system with constraints: Molecular dynamics of n-alkanes. Journal of Computational Physics, 23, 327- 341. doi:/10.1016/0021-9991(77)90098-5
- Feller, S.E., Zhang, Y., Pastor, R.W. and Brooks, B.R. (1995) Constant pressure molecular dynamics simulation: The Langevin piston method. The Journal of Chemical Physics, 103, 4613-4621. doi:/10.1063/1.470648
- Essmann, U., Perera, L., Berkowitz, M.L., Darden, T., Lee, H. and Pedersen, L.G. (1995) A smooth particle mesh Ewald method. The Journal of Chemical Physics, 103, 8577- 8593. doi:/10.1063/1.470117
- Mark, P. and Nilsson, L. (2001) Structure and dynamics of the TIP3P, SPC, and SPC/E water models at 298 K. Journal of Physical Chemistry A, 105, 9954-9960. doi:/10.1021/jp003020w
- Neidle, S. (2002) Nucleic Acid Structure and Recognition. Oxford University Press, Oxford.