Journal of Biophysical Chemistry
Vol.2 No.3(2011), Article ID:6789,7 pages DOI:10.4236/jbpc.2011.23025
Auto-offsetting and -referencing in biomolecular NMR experiments
Shanghai key Laboratory of Magnetic Resonance, Department of Physics, East China Normal University, Shanghai, China; *Corresponding Author: shanminz@hotmail.com
Received 16 April 2011; revised 1 May 2011; accepted 8 July 2011.
Keywords: Auto-Offsetting and -Referencing; Indirect Referencing; Frequency Ratios; Biological NMR
ABSTRACT
A frequency ratio RatioXH associated with two carrier frequencies in ppm is introduced for achieving auto-offsetting and -referencing (AOR) in biomolecular NMR. Once the center of 1H is referenced, all the offsets in other dimensions are automatically determined and the centers of the spectral widths provide accurate indirect references. Since the scale in ppm is independent of the magnetic field strength, the AOR does not require manually updating carrier frequencies from time to time, making the multidimensional NMR experiments greatly simplified and reliable. It is extremely valuable when molecules need to be run a large number of experiments at different times and the data (chemical shifts, for example) need to be compared with each other. In AOR, the error arising from improper referencing of 1H is handed down in the same amount to the other nuclei being referenced. This error-inheritance provides a measure of accuracy in indirect referencing. The temperature dependence of the frequency ratio of DSS is derived with the first-order approximation and it can be used for temperature dependent AOR. For nuclei other than 13C, certain frequency ratios regarding TMS need to be derived (rather than measured) based on the recommended frequency ratios of DSS, thus avoiding conflicts and unifying the two standards.
1. INTRODUCTION
In NMR, the resonance frequency of nuclei in a strong magnetic field (B0) is determined by the Zeeman (gB0) and shielding (gB0s) interactions [1,2]. The shielding interaction is induced by the nearby electrons precessing at their own Larmor frequencies, which produce a very small magnetic field at the site of the nucleus. As the Larmor frequency of the electrons, it is also proportional to B0. The shielding coefficient s is referred to as chemical shift, which contains rich information about local molecular structures in solids [3] (chemical shift anisotropy) and in liquids (isotropic part only).
Due to the nature that both of the Zeeman and shielding interactions are proportional to B0, the NMR spectra obtained under different field strengths are comparable in terms of a universal scale in ppm. In comparison, a reference molecule, such as dimethylsilapentane sulfonic acid (DSS, C6H16O3SSi) or tetramethylsilane (TMS, (CH3)4Si) is often used, where the methyl 1H and 13C are well shielded by the low electronegativity of the silicon. As a result, their resonances are shifted to far upper field and are both defined as 0 ppm. For most naturally occurring molecules, the NMR peaks referenced to DSS or TMS appear in the positive region with increasing frequency [4-6].
Since the reference peaks depend on solvent, temperature, pH (measured internally), and susceptibility (measured externally), direct referencing becomes problematic sometimes. The situation can be alleviated considerably by using a frequency ratio RCH(0) between the 13C and 1H (both defined as 0 ppm) of a reference molecule in order to reference 13C from 1H [7-9]. This scheme is referred to as indirect referencing in the NMR literature. The recommended ratios for DSS and TMS are  (0) = 0.251449530 [8-10] and
  (0) = 0.25145020 [11], respectively. The two ratios are very close and so are the differences of their 1H and 13C chemical shifts, respectively. On the scale of TMS, the 1H chemical shift of DSS (both molecules in the same aqueous solution),
  ppm [12]. The accuracy of the indirect referencing relies exclusively on the 1H referencing, which is much easier to handle, especially for biomolecular NMR experiments with inverse (1H) detection.
The indirect referencing has been extended to nuclei other than 13C, where the frequency ratio  is measured between the two nuclei, X and 1H in two different molecules. Conflicting results may arise if both DSS and TMS standards are used to reference a nucleus other than 13C due to incompatibility of the two measured ratios. To avoid the conflict, only one of the ratios should be measured and the other must be calculated.
Experimentally, the carrier frequencies, which irradiate at the centers of the spectral widths in quadrature detection [13] and are intimately related to frequency referencing, play important roles because misplaced carrier frequency may introduce improper excitation and poor decoupling. Further more, correct carrier frequencies must be determined before the experiments although referencing can be done after data collection. If the 1H carrier frequency can be set correctly, offsetting and referencing in all the indirectly detected dimensions can be done automatically. This method is referred to autooffsetting and -referencing (AOR). A convenient way to do AOR is to define the ratios between carrier frequencies in terms of ppm rather than frequency. Since ppm is independent of magnetic field strength and it remains the same from time to time, the AOR simplifies NMR experiments, saves considerable time, renders proper excitation and decoupling, and provides accurate indirect referencing. With slight modification, it can also be applied to direct detection of nuclei other than 1H.
2. THE RATIOS BETWEEN CARRIER FREQUENCIES
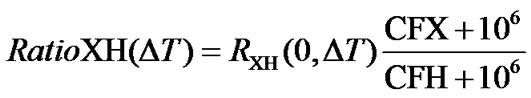
In most biomolecular NMR experiments, the chemical shift regions to be excited are often known in terms of ppm, while the carrier frequencies in terms of Hz are not. Besides, ppm is independent of the magnetic field strength and needs not chang from time to time. It would be much simpler and more convenient to input the spectral centers in ppm rather than in Hz. This can be accomplished by introducing a frequency ratio, RatioXH, between the carrier frequency of 1H, CFH (in ppm) of the directly detected dimension, and the carrier frequency of an X nucleus, CFX (in ppm) in the indirect dimension.
As shown in Figure 1, the ratio between the two carrier frequencies can be expressed as
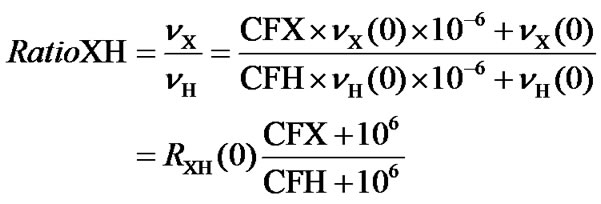 (1)
(1)
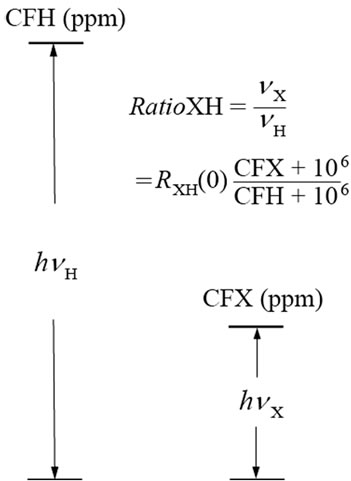
Figure 1. Energy levels for 1H and X nuclei at the centers of their spectral widths, where  and
and  are the two carrier frequencies, respectively. At both centers, the chemical shifts in ppm are defined as CFH and CFX, respectively.
where 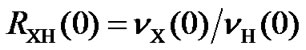 is the frequency ratio between X and 1H, both defined as 0 ppm. For referencing 13C,
  or
or  can be used in order to make the referencing compatible with DSS or TMS standard, respectively.
Unlike any other frequency ratios, RatioXH is, in general, not fixed and depends on both CFX and CFH, which are related to particular experiments. The usefulness of this ratio relies on the fact that it is derived from the ppm values rather than the actual frequencies, simplifying experiments considerably. In the RatioXH, CFH can be determined if any of the 1H peak is referenced while CFX is usually a known value, 174 ppm for 13CO for example.
Some of the common frequency ratios in doubleand triple-resonance experiments are listed in Table 1. They can be used as a quick check of experimental settings.
3. DETERMINATION OF OFFSETS IN THE INDIRECT DIMENSIONS
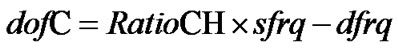
Since the NMR magnetic field is constantly drifting (several Hz per hour for instance), the frequency offsets often need to be adjusted for accommodating the drifting of the magnetic field. The 1H offset is the most convenient one to set up in experiments with inverse detection because the spectrum can be obtained directly. Once it is done, all the other offsets can be derived by the NMR instrument from the RatioXH. The AOR can be achieved in experiments by properly defining the offsets, 13C offset (dofC) for instance, which is required by the CFC and can be calculated by the NMR instrument using the relationship
 (2a)
(2a)
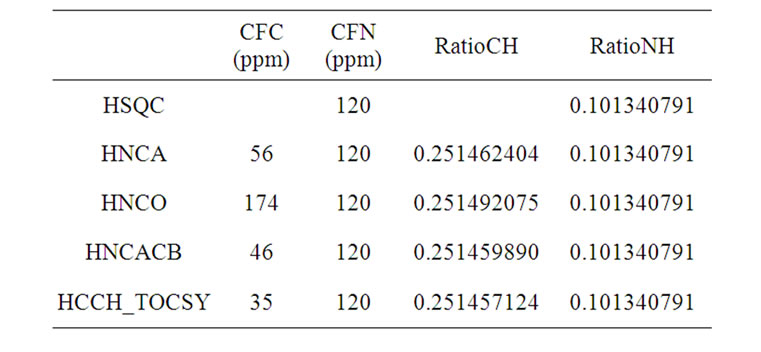
Table 1. The frequency ratios (calculated from Eq.1) in some of the frequently used biomolecular NMR experiments, where H2O (in 90% H2O/10% D2O) at 25˚C is used as a proton reference or CFH = 4.80 ppm.
or
 , (2b)
where sfrq, according to Varian’s notation, is the transmitter frequency of the observe channel used here for 1H and dfrq is the first decouple frequency used here for 13C. In general, sfrq and dfrq depend on magnetic field strength, lock frequency, solvent, etc., while RatioCH should be independent of these parameters and it must remain the same from time to time. To reference the CFH, only the transmitter offset (tof) needs to be adjusted and sfrq is updated every time when a new tof is entered. On the other hand, dofC, calculated on the fly, varies accordingly in order to make the RatioCH invariant. The calculated dofC is then used at the beginning of the pulse sequence as an additional offset of the 13C channel, making the carrier frequency (dfrq + dofC) irradiating exactly on the desired center, CFC. The CFC in turn serves as an accurate indirect reference for 13C dimension.
4. ERROR-INHERITANCE IN THE INDIRECT REFERENCING
In the indirect referencing, the error occurring in referencing CFH will cause an error in the calculation of dofC, which can be determined by the following relation,
 (3)
(3)
The error in ppm is then
 . (4)
. (4)
The above equation is referred to as error-inheritance and it shows that the same amount of error in ppm in the 1H referencing is inherited by 13C referencing. The error, however, is reduced by a factor of  in terms of Hz. It is therefore better to use a nucleus with a higher geomagnetic ratio to reference the others. These conclusions, including Eqs.2a and 2b, also hold between 1H and any other nuclei, such as 15N.
Both DCFH and DCFC in Eq.4 are defined as referenced – real chemical shifts. For instance, if the 1H in 90% H2O/10% D2O is referenced as 4.90 ppm instead of 4.80 ppm by mistake, CFH = 4.90 ppm is used in Eqs.1 and 2b and DCFH = (4.90 – 4.80) ppm = 0.1 ppm. As a result, dofC in Eq.2b becomes smaller because of a relatively larger CFH in the denominator of RatioCH defined in Eq.1. The 13CO RF field is then on-resonance at 173.9 ppm instead of 174 ppm. Yet, this center is still referenced as 174 ppm since CFC = 174 ppm is used in Eq.2b. Under this circumstance, DCFC = (174 – 173.9) ppm = 0.1 ppm, or DCFC = DCFH, in agreement with the definition of error-inheritance.
5. RELATIONSHIP BETWEEN THE REFERENCES TO DSS AND TMS
The proton chemical shift of DSS on the scale of TMS (both in aqueous solution) has been determined ,
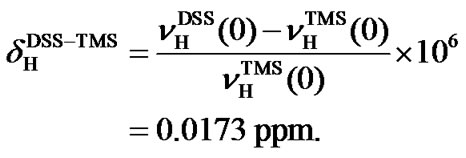 (5)
(5) From the above equation, the relative reference in 13C can be derived based on the frequency ratios of DSS and TMS,
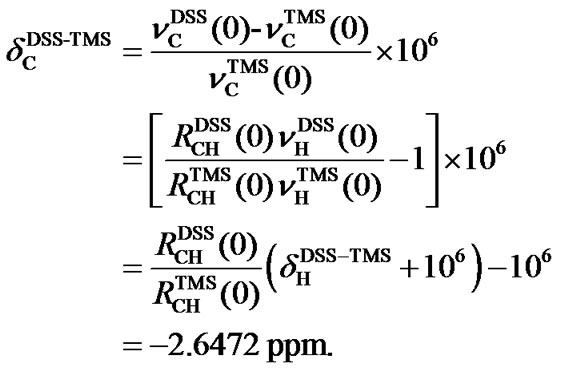 (6)
(6)
Because  is negative, the 13C peak of DSS is located in the upper field than that of TMS. The separation between the two reference peaks in 13C is much greater than in 1H. Given the relative chemical shifts
  and
and , the 13C and 1H chemical shifts referenced to DSS and to TMS can be conveniently converted from one to the other.
6. THE FREQUENCY RATIOS FOR NUCLEI OTHER THAN 13C
The frequency ratio between an X nucleus used as a reference in a molecule and 1H in DSS is defined as
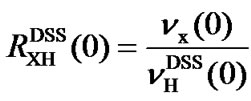 , (7)
, (7)
where  is the transition frequency of the X (¹ 13C) nucleus used as a reference. The definition of Eq.7 can also be applied to TMS. So far a number of
  have been determined as shown in Table 2 [4,7,11,12,14]. It is important to note that conflicting results may arise if both measured values of
  and
and  are used to reference an X peak. In other words, indirect referencing using
 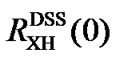 and
and 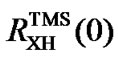 may be different even though both reference the same nucleus X that belongs neither to DSS nor to TMS. The conflict is caused by differences in samples, experimental conditions, and improper measurements of the two ratios. To resolve this issue,
  may be used as references and from which the corresponding
  are derived. To this end, the relationship between the two ratios needs to be established as shown in the following.
From Eq.7, it follows
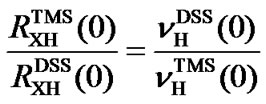 , (8a)
or
 (8b)
(8b)
To avoid conflict, only one of the ratios should be measured. It can be shown from Eq.8b that RatioXH in Eq.1 (where CFN = 120 ppm while CFH = 4.80 ppm for DSS and 4.8173 ppm for TMS) is invariant (RatioNH = 0.101340791) or irrespective to DSS and TMS standards, thus preserving experimental setting as well as indirect referencing. As a result, the chemical shift of an X nucleus, either referenced to DSS or to TMS, is the same. Some of the  calculated with Eq.8b are listed in Table 2.
7. 1H REFERENCE USING WATER
In biomolecular NMR, 90% H2O/10% D2O is often used as a solvent, where the proton in H2O can be used as a reference. The advantage to use H2O as a reference lies mainly in its large volume (~50 M). Because of the overwhelming quantity, the water signal is extremely strong and the chemical shift is less affected by the other molecules.
On the other hand, the temperature dependence of H2O chemical shift is relatively large. At 25˚C, the measured water resonance  4.80 ppm relative to the DSS (0 ppm) from a commercial sample of 2 mM sucrose + 0.5 mM DSS in 90% H2O/10% D2O (Cambridge Isotope Laboratories, Inc). This peak shifts almost linearly at –0.0088 ppm/˚C. If the proton peak of DSS at 25˚C is used as a reference, the CFH of H2O as a
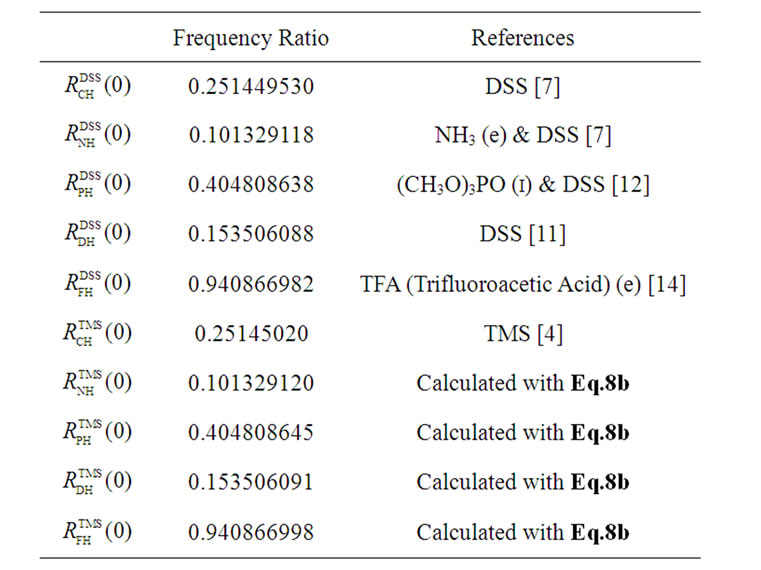
Table 2. The frequency ratios of some compounds commonly used in indirect referencing, where i and e stand for internal and external, respectively.  ppm is used in the calculation of
 .
.
function of temperature can be described by
 (ppm), (9)
where T is the sample temperature in ˚C.
8. TEMPERATURE DEPENDENT FREQUENCY RATIO AND AOR
The frequency ratio  (Eq.1) is defined at 25˚C. Since both transition frequencies,
  and
and , depend on temperature, their ratio also depends on temperature
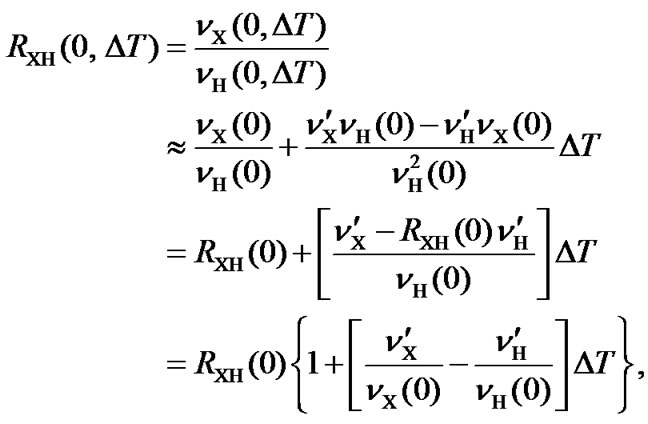 (10)
(10)
where  and
and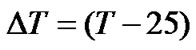 . Here, only the first-order correction is taken into account because the variation of the ratio is small.
If both  and
and  are expressed in terms of ppm rather than Hz, the temperature dependence of the frequency ratio becomes
 . (11)
According to our measurements of DSS with the same sample mentioned in the previous section,  = 0.00448 ppm/˚C and
  = 0.00048 ppm/˚C near 25˚C. It follows that temperature dependence of the frequency ratio of DSS near 25˚C
 . (12)
From Eqs.1 and 12, the temperature dependent ratio between carrier frequencies can be derived,
 . (13)
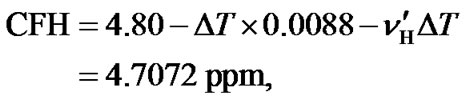
Based on the above results, the temperature dependent AOR can be achieved. As an example, we consider an experiment of HCCH_TOCSY with a CFC at 35 ppm (Table 1) and a sample with 90% H2O/10% D2O at a temperature of 35˚C. From Eq.12, the temperature dependent ratio can be derived . According to the temperature dependence of H2O (Eq.9), the
  = 4.712 ppm. At this moment, the temperature dependence of DSS has not been taken into account. Given the results of
  = 0.00448 ppm/˚C and
  = 0.00048 ppm/˚C, both centers can be converted in order to reference DSS at 35˚C, i.e.,
 (14)
(14)
and
 (15)
(15)
with , CFH and CFC (Eqs.14 and 15), all referenced to DSS at 35˚C, the ratio of the carrier frequency can be derived from Eq.13, leading to a temperature dependent AOR with the
 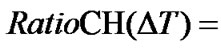 0.251457146.
9. EXPERIMENTAL
To test the scheme of AOR with proper ratios of carrier frequencies, a gradient enhanced HNCO experiment was performed with and without AOR. As described above, dofC and dofN are defined in the pulse sequence and they are calculated with Eq.2b. These two values are then used as additional offsets inserted at the beginning of the pulse sequence: decoffset (dofC + dof) and dec2offset (dofN + dof2) in Varian’s notation. To convert any Varian HCN triple-resonance sequence to an AOR variant using the DSS standard, the additions to the C code is shown below:
double
CFH = getval(“CFH”),
CFN = getval(“CFN”),
CFC = getval(“CFC”)RatioNH = 0.101329118*(CFN+1000000.0)/
(CFH+1000000.0)RatioCH = 0.251449530*(CFC + 1000000.0)/
(CFH + 1000000.0)dofN = (RatioNH*sfrq – dfrq2)*1000000.0dofC = (RatioCH*sfrq – dfrq)*1000000.0…
status(A);
dec2offset(dofN+dof2);
decoffset(dofC+dof);
In addition, the dg panel of the VnmrJ is modified slightly (Figure 2), where, in contrast to the conventional display, CFH, CFC, and CFN in ppm are added.
In AOR experiments, the water peak can be served as 1H reference and is set on-resonance. To determine the proton offset (tof), a separate single pulse sequence is used with an acquisition time of 4 s. A flip-angle about 15˚ is used instead of 90˚ to avoid ADC overflow and the effect of radiation damping at high magnetic field [1,15]. The H2O spectrum is shown in Figure 3, where the value of tof is determined and then used in the experiments with AOR. At 25˚C, CFH is set to 4.80 ppm. The offsets dofC and dofN are determined automatically from the desired values (CFC = 174 ppm and CFN = 120 ppm) using RatioCH and RatioNH, respectively. These two values, 174 and 120 ppm, in turn serve as indirect references in 13CO and 15N dimensions.
The 15N-1H two dimensional spectra of a 13Cand 15Ndouble-labeled human ubiquitin in 90% H2O/10% D2O with and without AOR are shown in Figure 4. The two spectra look identical, approving the scheme of AOR. The results obtained in 13C-1H two dimensional spectrum (not shown) also confirmed the method of AOR.
The method of AOR can also be applied to direct measurement of nuclei other than 1H, where the first decouple channel may be used for proton. For Varian NMR instrument, the offset (dof) is set on-resonance to H2O, where dof is the same as the tof that is derived from the single pulse experiment (Figure 3). The NMR
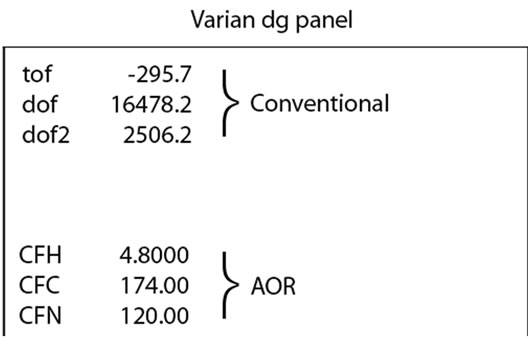
Figure 2. Part of a Varian dg panel, where CFH, CFC, and CFN in ppm are added for running experiments with AOR.
Figure 3. H2O spectrum of a ubiquitin sample in 90% H2O/10% D2O obtained by a Varian 750 MHz NMR System with a 15˚ pulse, 4 scans, 4 s acquisition time, 10 kHz spectral width, and a zero-filling to 264 k. The RF carrier frequency is placed exactly on the water peak using a Varian commend movetof. After running the experiment, the transmitter offset tof = –275.4 Hz is obtained.
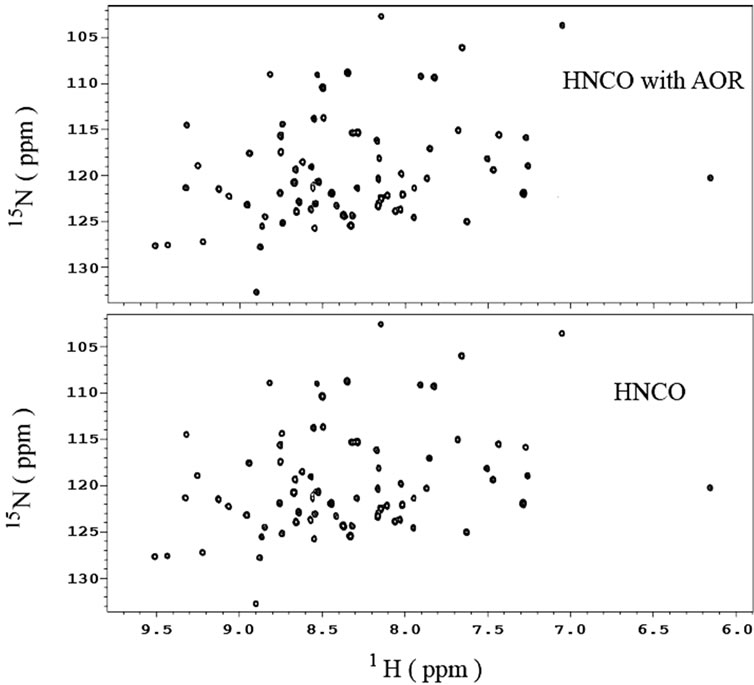
Figure 4. 1H-15N two dimensional NMR spectra of a 13Cand 15N-double-labeled ubiquitin obtained from a gradient-enhanced HNCO experiment with (top) and without (bottom) AOR. Four scans per increment and 84 increments are used for both spectra. The sample has a concentration of 0.98 mM and is in 90% H2O/10% D2O with 50 mM phosphate, 1 mM NaN3, and pH 5.0.
spectra shown in Figure 5 are obtained through direct detection of 15N magnetization with AOR. The spectrum at the bottom was obtained with CFH = 4.80 ppm and CFN = 120 ppm. Under this condition, the carrier frequency of 15N is calculated using the RatioNH and placed exactly at 120 ppm just before pulsing. As a result, the center of the spectrum is 120 ppm, which serves also as an indirect reference. To demonstrate the effect of the error-inheritance, CFH was misplaced by 0.1 ppm from 4.80 to 4.90 ppm, correspondingly the 15N peak shifts the same amount as predicted by the error-inheritance (Eq.4).
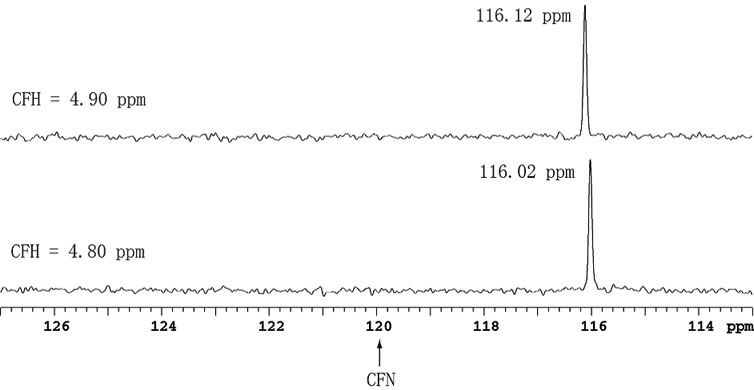
Figure 5. 15N directly detected spectra with AOR of a 15Nand 13C-labeled Acytel-glycine, where CFN = 120 ppm for both spectra.
10. CONCLUTIONS
In multidimensional NMR, the ratio between carrier frequencies can be expressed as  . From the ratio, the required offset for a desired CFX can be generated by the NMR instrument as long as CFH is referenced. In this way, the centers of the indirectly detected dimensions can be inputted in ppm rather than in frequencies. Given the temperature dependence of the reference molecule, AOR can be easily extended to temperatures beyond 25˚C, at which the frequency ratio is defined.
For nuclei other than 13C, indirect referencing may cause conflict when two measured ratios  and
and  are used. To avoid this, only one of the two ratios needs to be measured and the other should be calculated based on the relationship between the two standards.
Since the error (DCFH) arising from improper referencing of 1H is handed down to the X nucleus, i.e., DCFX » DCFH, the accuracy of the indirect referencing relies solely on the 1H referencing, which is much easier to handle, especially for experiments with inverse detection.
AOR can be applied not only to experiments with inverse detection but also to direct detection of X nuclei with proper referencing. It is indispensable in research and industry, where slight differences of chemical shifts among different molecules need to be identified or large number of samples need to be run and analyzed daily.
11. ACKNOWLEDGEMENTS
This research was supported by the Sealy Center for Structural Biology, University of Texas Medical Branch at Galveston, East China Normal University, and National Fundamental Research Project of China (2007CB925200).
REFERENCES
- Abragam, A. (1961) Principles of nuclear magnetism. Clarendon Press, Oxford.
- Ernst, R.R., Bodenhausen, G. and Wokaun, A. (1987) Principles of nuclear magnetic Resonance in one and two dimensions. Clarendon Press, Oxford.
- Mehring, M. (1976) High resolution NMR spectroscopy in solids. Springer, Berlin.
- Harris, R.K., Becker, E.D., Menezes, S.M.C., Goodfellow, R. and Granger, P. (2002) NMR nomenclature: Nuclear Spin properties and conventions for chemical shifts. Solid State Nuclear Magnetic Resonance, 22, 458-583. doi:10.1006/snmr.2002.0063
- Harris, R.K., Becker, E.D., Menezes, S.M.C., Robin, G. and Pierre, G. (2001) NMR nomenclature. Nuclear spin properties and conventions for chemical shifts. Pure and Applied Chemistry, 73, 1795-1818. doi:10.1351/pac200173111795
- Harris, R.K., Becker, E.D., Menezes, S.M.C., Granger, P., Hoffman, R.E. and Zilm, K.W. (2008) Further conventions for NMR shielding and chemical shifts. Pure and Applied Chemistry, 80, 59-84. doi:10.1351/pac200880010059
- Wisharf, D.S., Bigam, C.G., Yao, J., Abildgaard, F., Dyson, H.J., Oldfield, E.E., Marklev, J.L., Brian, D. and Svkes, B.D. (1995) 1H, 13C and 15N chemical shift referencing in biomolecular NMR. Journal of Biomolecular NMR, 6, 135-140.
- Live, D.H., Davis, D.G., Agosta, W.C. and Cowburn, D. (1984) Long range hydrogen bond mediated effects in peptides: Nitrogen-15 NMR study of gramicidin S in water and organic solvents. Journal of the American Chemical Society, 106, 1939-1941. doi:10.1021/ja00319a006
- Edison, A.S., Abildgaard, E., Westler, W.M., Mooberry, E.S. and Markley, J.L. (1994) Practical introduction to theory and implementation of multinuclear, multidimensional nuclear magnetic resonance experiments. Methods in Enzymology, 239, 3-79. doi:10.1016/S0076-6879(94)39003-7
- DeMarco, A. (1996) pH dependence of internal references. Journal of Magnetic Resonance, 26, 527-528.
- Markley, J.L., Bax, A., Arata, Y., Htlbers, C.W., Kaptein, R., Sykes, B.D., Wright, P.E. and Wuthrich, K. (1998) Recommendations for the presentation of NMR structures of proteins and nucleic acids. Pure and Applied Chemistry, 70, 117-142. doi:10.1351/pac199870010117
- Markley, J.L., Bax, A., Arata, Y., Hilbers, C.W., Kaptein, R., Sykes, B.D., Wright, P.E. and Wuthrich, K. (1998) Recommendations for the presentation of NMR structures of proteins and nucleic acids. Journal of Molecular Biology, 280, 933-952. doi:10.1006/jmbi.1998.1852
- Hoult, D.I. (1978) The NMR receiver: A description and analysis of design. Progress in Nuclear Magnetic Resonance Spectroscopy, 12, 41-77. doi:10.1016/0079-6565(78)80002-8
- Maurer, T. and Kalbitzer, H.R. (1996) Indirect referencing of 31P and 19F NMR spectra。 Journal of Magnetic Resonance, B113, 177-178. doi:10.1006/jmrb.1996.0172
- Keifer, P. A. (1999) 90 degrees pulse width calibrations: How to read a pulse width array? Concepts in Magnetic Resonance, 11, 165-180. doi:10.1002/(SICI)1099-0534(1999)11:3<165::AID-CMR4>3.0.CO;2-D