Journal of Environmental Protection
Vol.10 No.07(2019), Article ID:94032,13 pages
10.4236/jep.2019.107055
Comparison of Carbon Dynamics among Three Cool-Temperate Forests (Quercus serrata, Larix kaempferi and Pinus densiflora) under the Same Climate Conditions in Japan
Mitsutoshi Tomotsune1*, Yohei Suzuki2, Yuki Kato2, Rina Masuda2, Nobuhiko Suminokura2, Yuta Koyama2, Yoshiaki Sakamaki3, Hiroshi Koizumi2
1Faculty of Education and Integrated Arts and Science, Waseda University, Tokyo, Japan
2Faculty of Science and Engineering, Waseda University, Tokyo, Japan
3Waseda Research Institute for Science and Engineering, Waseda University, Tokyo, Japan

Copyright © 2019 by author(s) and Scientific Research Publishing Inc.
This work is licensed under the Creative Commons Attribution International License (CC BY 4.0).
http://creativecommons.org/licenses/by/4.0/


Received: June 13, 2019; Accepted: July 28, 2019; Published: July 31, 2019
ABSTRACT
To understand the role of forest ecosystems in the global carbon cycle, it is important to clarify the factors affecting the carbon balance of forest ecosystems. However, little is known about the direct effect of forest types, especially dominant species, on their different carbon dynamics. To clarify the effect of difference in forest types, an experiment was conducted in three forests, which were located in the same place and exposed to the same climate conditions. These forests were middle-aged (40 - 45 years) and dominated by Quercus serrata (Q forest), Larix kaempferi (L forest) and Pinus densiflora (P forest). Net primary production (NPP), heterotrophic respiration (HR) and net ecosystem production (NEP) were estimated in each forest, using a biometric method over one year. For NPP estimated from the annual growth of tree biomass (ΔB) and amount of litter (LF), P forest NPP (5.3 MgC·ha−1·yr−1) was higher than Q and L forest NPP (4.6 and 3.2 MgC·ha−1·yr−1). The difference was affected by a significant difference in ΔB (p = 0.032) and LF (p < 0.001) mainly because of leaf biomass. The HR in Q forest (4.1 MgC·ha−1·yr−1) was higher than L and P forest (2.3 and 2.1 MgC·ha−1·yr−1). This difference could result from the amount of litter (respiration substrate) and chemical properties of litter (lability of decomposition). The NEP, which was calculated from the difference between NPP and HR, varied widely among the forest types (0.5, 0.9 and 3.2 MgC·ha−1·yr−1 in Q, L and P forests, respectively). The range of values among the forest types was comparable to those among age sequences and climate zones in previous studies. These results suggest that the difference in forest types (especially dominant species) can potentially lead to a large variation in carbon dynamics, in ecosystems located in the same place.
Keywords:
Dominant Species, Functional Type, Heterotrophic Respiration, Net Ecosystem Production, Net Primary Production

1. Introduction
Many studies have found that forest ecosystems have a major role in the global carbon cycle as a carbon sink between the ecosystem and atmosphere [1] [2] . The carbon balance of forest ecosystems has been generally evaluated as net ecosystem exchange (NEE) and net ecosystem production (NEP) by eddy covariance and biometric methods. The former method can directly measure the carbon balance between the ecosystems and the atmosphere, and has been used to determine the carbon balance on a regional scale [3] [4] [5] . The latter method estimates the flow rates of carbon in the ecosystem from net primary production (NPP) (amount of tree growth, litter fall and grazing) and heterotrophic respiration (HR) (decomposition of soil organic carbon and course woody debris). The sum of the flow rate is regarded as the total carbon balance of the ecosystem to atmosphere (NEP) and can clarify which components affect variations in the total carbon balance [6] [7] [8] . Therefore, this method is suitable for a comparison of carbon dynamics between different ecosystems or inter-annual variations within an ecosystem.
The NEP varies widely with differences in climate zone (solar radiation, air temperature and amount of precipitation), soil type (geography and physicochemical properties), and vegetation structure (stand age and species composition) [9] [10] . Vegetation structure has the potential to strongly influence the variation of NPP and HR, and consequently NEP. For example, NPP depends on the amount of leaf (biomass and leaf area index), plant physiological traits (photosynthesis and plant respiration rate) and the length of the photosynthesis period [11] . In contrast, HR depends on the amount of litter (litter mass and soil organic matter content), litter chemical properties and exudates from roots [12] [13] . Therefore, previous research leads us to expect that NEP should show large variations only among different dominant functional types, such as deciduous and evergreen trees or broad-leaved and conifer trees. In many cases, however, estimated NEP included not only the influence of different dominant species but also that of different climates, soil types and other vegetation structures. This has done little to directly clarify the effect of different dominant species on NEP, and thus we need to measure NEP in adjacent forests which grow in the same environmental conditions.
We hypothesized that the difference in dominant species could cause the variations of NPP and HR, and consequently large variations in NEP under similar climate conditions. To clarify this hypothesis, NPP, HR and NEP were estimated by a biometric method through one year from spring 2012 to 2013 in three forest ecosystems in the same region, dominated by Quercus serrata (broad-leaved deciduous), Larix kaempferi (needle-leaved deciduous) and Pinus densiflora (needle-leaved evergreen).
2. Materials and Methods
2.1. Study Site
The three study sites, which were dominated by Q. serrata (Q forest), L. kaempferi (L forest) and P. densiflora (P forest), were located on the middle slopes of Mt. Asama within 3 km of the Karuizawa Seminar House (36˚20'N, 138˚33'E, at 1004 m a.s.l.) (Figure 1). In 2012, the ages of the dominant species were about 40 years for Q and P forests, and 45 years in L forest. Between 1977 and 2007, the annual mean air temperature was 7.9˚C and annual precipitation was 1198 mm (Karuizawa Weather Station of the Japan Meteorological Agency). This region is categorized as a cool temperate zone.
A permanent quadrat (30 m × 30 m; divided to nine sub quadrats of 10 m × 10 m) was established in each of the forests. Tree census was conducted for all living trees (diameter at breast height; DBH > 5 cm) to clarify species composition and community structure such as stem density, DBH, biomass and basal area. The number of vegetation species was higher in Q and P (5 species) forest than L forest (2 species) (Table 1), although the biomass of the dominant species was around 90% of the total biomass in each forest (98%, 90%, 87% in L, Q, and P forests, respectively). The number of dominant species stems was lower in Q forest (67%) than L and P forests (98% and 93%), although the basal area, which is generally regarded as an indicator of dominant vegetation, was more than 85% in each forest.
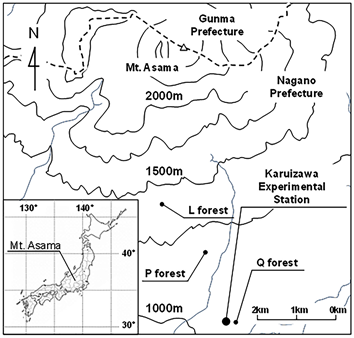
Figure 1. Study site of three cool-temperate forests. Q, L and P forest represent study plots dominated by Quercus serrata, Larix kaempferi and Pinus densiflora, respectively.

Table 1. Species composition and community structure in the permanent plots.
Q, L and P forest represent study plots dominated by Quercus serrata, Larix kaempferi and Pinus densiflora, respectively. Diameter at breast height (DBH) was measured for >5 cm in March 2013.
The soil type was categorized as an immature volcanic soil. L forest was located about 200 m higher above sea level than Q forest. Therefore, the average annual soil temperature, which was measured hourly at 5 cm depth, was lower in L forest than Q forest (from April 2012 to May 2013) (Table 2), although the difference was relatively small (1.8˚C). The difference was 1.9˚C in the warm season (from May to October 2013).
2.2. Estimation of NPP, HR and NEP
The annual growth of DBH (cm) was measured on all tree stems > 5 cm in each plot in March 2012 and 2013. Tree biomass (kg dry weight; kg D.W.) was estimated from equations of the allometric relationship between tree biomass (stem, branch and coarse roots) and DBH which was investigated in forests near the study site by harvesting the same tree species as in our study [14] . Annual
Table 2. Average soil temperature measured hourly at 5 cm soil depth in the three forests.
Q, L and P forest represent study plots dominated by Quercus serrata, Larix kaempferi and Pinus densiflora, respectively. Warm and cool season indicates the period from May to October in 2013 and other times of year, respectively.
growth of tree biomass (ΔB) was estimated as the difference of tree biomass between March 2012 and 2013. Leaf biomass in closed forest canopies was directly influenced by site quality [15] . It was not appropriate to use the allometric equations constructed in other sites. Therefore, the estimated ΔB does not include the change in leaf biomass.
The amount of litter fall was measured from nine litter traps (1 m2 area) established in each permanent plot. Litter was collected from June to December 2012 every one or two months. Collected litter was dried for 72 hours at 70˚C, separated into leaf, branch and other litter, and then each dry weight was measured. The sum of leaf and other litter values was regarded as annual amount of litter (LF) (because branch litter was counted as ΔB from the allometric equations).
Annual NPP (MgC·ha−1·yr−1) was calculated using the following equation [5] :
(1)
Fifty percent of the D.W. was regarded as carbon weight in our study. The NPP should include the amount of grazing and tree mortality. However, the amount of grazing was omitted because there was little impact to NPP here. Mortality was not considered because no trees died during study period in the three sites. Therefore, these values were not included in the NPP in our study.
HR was estimated by the trenching method which has been described by [16] in detail. In brief, four trenched plots (area; 60 × 60 cm2, depth 40 cm, n = 4) were established in July 2009 at the Q forest and November 2011 at the L and P forests. The CO2 flux rate from the soil surface in the trenched plots (Rtre, mgCO2·m−2·h−1) was measured by the closed chamber method connected to a portable infrared gas analyzer (GMP343, Vaisala, Finland) in some months from May to December 2012. The CO2 flux rate caused by only heterotroph (Rh, mgCO2·m−2·h−1) was calculated using the CO2 flux rate from residual roots (RD) in the trenched plots. RD was estimated based on initial root biomass (RBinitial) in the trenched plots and residual root biomass (RBresidual) with mass loss of decomposition (root bag method) separating the three classes by diameter (fine < 2 mm, medium 2 - 10 mm, coarse > 10 mm) from depths of 0 - 30 cm in each plot (n = 3). The relationships between the RBresidual and elapsed hours (t) were fitted with the following equation:
(2)
where a and b are fitting parameters, and indicate RBinitial and mass loss rate, respectively.
Soil temperature (ST, ˚C) at 5 cm depth was also measured with Rtre by a portable thermo sensor (AD-5622, A&D, Tokyo, Japan). Then, the relationship between Rh and ST was evaluated as follows:
(3)
where c and d are fitting parameters. Continuous respiration rate was estimated from Equation (3) and hourly soil temperature at 5 cm depth measured at each plot (Table 2) from April 2012 to May 2013. The sum of these continuous respiration rates was regarded as the annual HR (MgC·ha−1·yr−1). In addition, annual standardized HR (HRstan) was estimated using the same soil temperature data in P forest to clarify the effect of a difference in soil temperature on HR among the forest types.
Annual NEP (MgC·ha−1·yr−1) was determined as a balance between annual NPP and HR using the following equation:
(4)
2.3. Statistical Analysis
All statistical analysis was performed using SPSS software for Windows (SPSS Statistics 17.0, SPSS Inc., Chicago, IL, USA). Statistical comparisons among the forest types were conducted using one-way analysis of variance (ANOVA) and Tukey multiple comparison as the post hoc test for ΔB and LF constructing the NPP, and Rh constructing the HR in each month. Significant differences for all statistical tests were evaluated at the P < 0.05 level.
3. Results
3.1. Net Primary Production
The ΔB in Q forest did not show a significant difference from those in P and L forest. However, ΔB in P forest was highest and significantly higher (1.9 times) than that in L forest (Figure 2) (p = 0.032). The LF in Q and P forest was significantly higher (1.4 times) than that in L forest (p < 0.001). Consequently, NPP in P forest was higher (1.2 and 1.7 times) than that in Q and L forest, respectively.
3.2. Heterotrophic Respiration
The a (RBinitial) value from Equation (2) tended to be higher in P forest, followed by Q and L forest (Table 3). In Q forest, the value in fine roots was higher than in medium and coarse roots. In contrast, the value in medium roots was higher than the others in P and L forest. The b (mass loss rate) tended to be higher in Q, following P and L forest.
Rh in Q forest tended to be higher in L and P forest in each month. There was a significant difference with L forest in September and in P forest in May and October, respectively (Table 4). Rh increased exponentially with soil temperature in each forest (Figure 3). Across the full range of soil temperature, Rh was relatively higher in Q forest than others. However, Rh in L forest was relatively higher than that in P forest especially at higher temperatures.
The annual HR in Q forest, which was estimated from the relational equations (Figure 3) and hourly soil temperature (Table 2), was 1.8 and 2.0 times higher than those in L and P forest, respectively (Figure 4). Annual HRstan was also higher in Q forest than others (1.4 and 1.9 times that of L and P forest). The differences in HRstan among the forest types were slightly smaller than those of HR.
Table 3. The parameters of Equation (2) for estimating the CO2 flux rate from residual root (RD) in a trenched plot with the root bag method.
Q, L and P forest represent study plots dominated by Quercus serrata, Larix kaempferi and Pinus densiflora, respectively. RBinitial indicates initial root biomass in the trench plot.
Table 4. Average heterotrophic respiration in three forests.
Q, L and P forest represent study plots dominated by Quercus serrata, Larix kaempferi and Pinus densiflora, respectively. Different letters indicate statistically significant differences (p < 0.05) among the forest types in each month.
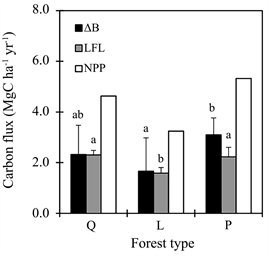
Figure 2. Variation in annual growth of biomass (ΔB), amount of litter fall (LF) and net primary production (NPP) among the three forest types from March 2012 to March 2013. Q, L and P forest represent study plots dominated by Quercus serrata, Larix kaempferi and Pinus densiflora, respectively. Error bars indicate standard deviation. Different letters indicate statistically significant differences (p < 0.05).
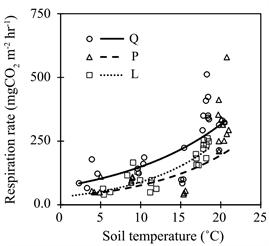
Figure 3. Relationships between heterotrophic respiration rate (Rh) and soil temperature at 5 cm depth in the three forests. Q, L and P forest represent study plots dominated by Quercus serrata, Larix kaempferi and Pinus densiflora, respectively. Regression are Rh = 30.82 × e(−0.1061 × ST) (r2 = 0.71, p < 0.05), Rh = 58.47 × e(−0.0874 × ST) (r2 = 0.60, p < 0.05), Rh = 33.76 × e(−0.1001 × ST) (r2 = 0.59, p < 0.05), in Q, L and P forest, respectively.
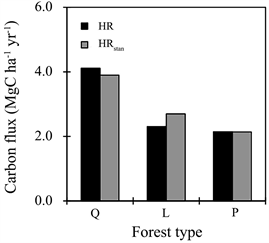
Figure 4. Variation in heterotrophic respiration (HR) and standardized HR (HRstan) among the three forest types. Q, L and P forest represent study plots dominated by Quercus serrata, Larix kaempferi and Pinus densiflora, respectively.
3.3. Net Ecosystem Production (NEP)
NEP, which was the difference between NPP and HR, was higher in the order of P, Q and L forest (Table 5). The Q forest had relatively large NPP, although it had highest HR, consequently it had the lowest NEP. The L forest had the lowest NPP and relatively low HR, therefore its NEP was also relatively low. The P forest had the largest NEP with the largest NPP and lowest HR.
4. Discussion
4.1. NPP for Q, L and P Forest
The amount of NPP is affected by leaf biomass, photosynthetic activity and length of photosynthesis period [11] . In our results, LF, which could be an indicator of leaf biomass, showed a moderate value in P forest (Table 5). However, Hatiya et al. [17] reported that most of the canopy of P forest was composed of current and one-year-old leaves. If the amount of current and one-year-old leaves were nearly equal, the leaf biomass should be estimated at 2 times LF. Thus, leaf biomass could consequently be at a maximum in P forest and directly affect the difference in NPP.
Table 5. Carbon fluxes and the factors affecting them in three forests.
Q, L and P forest represent study plots dominated by Quercus serrata, Larix kaempferi and Pinus densiflora, respectively. NEP, NPP, ΔB, LF, HR and HRstan are net ecosystem production, net primary production, annual growth of tree biomass, annual amount of litter, heterotrophic respiration and standardized heterotrophic respiration, respectively.
Photosynthetic activity is generally evaluated as maximum photosynthesis (Pmax) or carboxylation (Vc). Hirata et al. [7] demonstrated that the photosynthetic capacity of L. kaempferi was higher than that of other species, and the Pmax rapidly increased with leaf expansion. However, the photosynthetic activity of Q. serrata was larger than that of P. densiflora in those studies: Vc values for Q. serrata and P. densiflora were about 25 and 60 μmol·m−2·s−1 in summer, respectively [18] . These previous studies suggest to us that photosynthetic activity is highest in L, followed by Q and P forests (Table 5), although this trend was different for NPP in our study. Therefore, the photosynthetic activity might weakly affect the variations in NPP compared with the effect of leaf biomass.
The length of the photosynthesis period differs between an evergreen and a deciduous forest: evergreen leaves are held in the canopy throughout the year while deciduous leaves are not. In a cool-temperate area such as our study site, NEP in P forest had a positive value from March to December and was also positive during the day in January and February [18] . Thus P. densiflora could photosynthesize and grow throughout the year. Therefore, not only leaf biomass but also the length of the photosynthesis period would affect directly the high NPP of the P forest (Table 5).
4.2. HR for Q, L and P Forest
The difference in annual HR among the forest types depended on the differences in hourly soil temperature and relational Equation (3) (between soil respiration rate and soil temperature) in each forest. The higher soil temperatures in Q forest directly affected the higher HR in Q forest, although estimated HRstan (supposing the same soil temperature based on the soil temperature data of P forest) also tended to be highest in Q forest. Therefore, the difference in the relational equation, which indicated the difference in the activity of HR, largely contributed to the difference in annual HR among the forest types. In addition, the trenched plot was established two years earlier in Q forest than other forests. Long term effects from trenching caused discontinuity in root exudation, which is the respiration substrate, and consequently decreased HR rate compared with the natural soil conditions [13] . These results suggest to us that actual HR could be much higher in Q forest compared with other forests, which would lead to a greater difference of HR among the forest types.
The HR rate depends on the amount of litter (respiration substrate) and its properties (lability of decomposition) [19] . In our study, Q forest had the largest LF and provided the substrate of respiration to the soil surface, which would contribute to the higher HR in Q forest (Table 4). However, Hobbie et al. [20] reported that the decomposition rate of litter was negatively related to litter lignin content. In general, needle and evergreen leaves have higher lignin content and decompose much more slowly than broad and deciduous leaves [19] ; thus, the decomposition rate could be faster in Q forest, followed by L and P forest (Table 4). This order agrees with our estimated HR, indicating that the leaf litter chemical properties directly affect the variation in HR among the forest types.
4.3. NEP for Q, L and P Forest
Based on the above, NEP ranged from 0.5 to 3.2 MgC·ha−1·yr−1 among the forest types because of the different balance between NPP and HR in our study. In previous studies, the difference of NEP among the forest types has been evaluated based on several properties. For example, Peichl et al. [10] reported that NEP in an age sequence (6, 19, 34 and 69 years old) was estimated from 0.8 to 4.4 MgC·ha−1·yr−1. Pregitzer et al. [9] reported that the NEP among climatic zones (subarctic, temperate, and tropical forests) was estimated from 0.3 to 3.6 MgC·ha−1·yr−1, respectively. The variations in NEP in our study (from 0.5 to 3.2 MgC·ha−1·yr−1) were within the range of these previous studies, suggesting that different forest types can cause variations in carbon dynamics that are comparable in size to those related to age sequences and climate zones.
In a similar climate zone to our study site, previous studies indicated NEP at 2.1 MgC·ha−1·yr−1 for a broad-leaved deciduous forest [2] and 4.3 MgC·ha−1·yr−1 for an evergreen coniferous forest [21] in Takayama, Japan. No biometric-based NEP data was available for a needle-leaved deciduous forest but an eddy covariance-based NEP was estimated at 2.1 MgC·ha−1·yr−1 at Tomakomai, Japan [7] . Compared with these values, our estimated NEP tended to be relatively low. This might be caused by two factors associated with NPP: the estimated NPP did not include old woody litter production (e.g. branch litter fall) and fine root production. Ohtsuka et al. [2] and Yashiro et al. [21] reported that these components contributed to 13% - 78% of NPP based on ΔB and LF. Considering these ratios, the NPP and NEP in our study had a similar range compared with those in the above studies.
The findings indicated to us that different forest types, especially functional types, might show dramatically different variations under the same level of climate change. For example, if deciduous forest has current-year leaves, then the climate conditions in the current year could directly affect the NPP. However, evergreen forest is mainly composed by leaves that are several years old in many cases, and this indicates that the NPP would be affected by previous climate conditions. In addition, some researchers have reported that the sensitivity to climate change is different between NPP and HR within a forest [2] [21] and, therefore, NEP should be even more varied among the forest types. Therefore, further studies with long term measurements are required to clearly understand the effect of forest type on NEP, and the roles of forest types on global carbon dynamics.
5. Conclusion
The difference in NPP among the forest types was affected by significant differences in ΔB and LF, which were mainly caused by leaf biomass. The difference in HR was affected by differences in the amount of litter and chemical properties of litter. Consequently, the NEP varied largely among the forest types, and its variation was comparable to those among age sequences and climate zones in previous studies. These results suggest that differences in forest types, especially dominant species, have the potential to cause a large variation in carbon dynamics.
Acknowledgements
We thank members of the Laboratory for Environmental Ecology, Waseda University, Tokyo, Japan, for their assistance in field sampling and discussion. We also thank the staff of the Karuizawa Seminar House for their great assistance in the use of their institution. We especially thank Ms. Kayo Matsushita and Ms. Mayuko Suzuki for their help and advice on our manuscript. We thank Leonie Seabrook, PhD, from Edanz Group (www.edanzediting.com/ac) for editing a draft of this manuscript.
Conflicts of Interest
The authors declare no conflicts of interest regarding the publication of this paper.
Cite this paper
Tomotsune, M., Suzuki, Y., Kato, Y., Masuda, R., Suminokura, N., Koyama, Y., Sakamaki, Y. and Koizumi. H. (2019) Comparison of Carbon Dynamics among Three Cool-Temperate Forests (Quercus serrata, Larix kaempferi and Pinus densiflora) under the Same Climate Conditions in Japan. Journal of Environmental Protection, 10, 929-941. https://doi.org/10.4236/jep.2019.107055
References
- 1. Yamamoto, S., Murayama, S., Saigusa, N. and Kondo, H. (1999) Seasonal and Inter-Annual Variation of CO2 Flux between a Temperate Forest and the Atmosphere in Japan. Tellus B: Chemical and Physical Meteorology, 51, 402-413.
- 2. Ohtsuka, T., Mo, W., Satomura, T., Inatomi, M. and Koizumi, H. (2007) Biometric Based Carbon Flux Measurements and Net Ecosystem Production (NEP) in a Temperate Deciduous Broad-Leaved Forest beneath a Flux Tower. Ecosystems, 10, 324-334. https://doi.org/10.1007/s10021-007-9017-z
- 3. Malhi, Y., Baldocchi, D.D. and Jarvis, P.G. (1999) The Carbon Balance of Tropical, Temperate and Boreal Forests. Plant, Cell & Environment, 22, 715-740.https://doi.org/10.1046/j.1365-3040.1999.00453.x
- 4. Saigusa, N., Yamamoto, S., Murayama, S. and Kondo, H. (2005) Inter-Annual Variability of Carbon Budget Components in an AsiaFlux Forest Site Estimated by Long-Term Flux Measurements. Agricultural and Forest Meteorology, 134, 4-16.https://doi.org/10.1016/j.agrformet.2005.08.016
- 5. Ohtsuka, T., Saigusa, N. and Koizumi, H. (2009) On Linking Multiyear Biometric Measurements of Tree Growth with Eddy Covariance-Based Net Ecosystem Production. Global Change Biology, 15, 1015-1024. https://doi.org/10.1111/j.1365-2486.2008.01800.x
- 6. Curtis, P.S., Hanson, P.J., Bolstad, P., Barford, C., Randolph, J.C., Schmid, H.P. and Wilson, K.B. (2002) Biometric and Eddy-Covariance Based Estimates of Annual Carbon Storage in Five Eastern North American Deciduous Forests. Agricultural and Forest Meteorology, 113, 3-19. https://doi.org/10.1016/S0168-1923(02)00099-0
- 7. Hirata, R., Hirano, T., Saigusa, N., Fujinuma, Y., Inukai, K., Kitamori, Y., Takahashi, Y. and Yamamoto, S. (2007) Seasonal and Interannual Variations in Carbon Dioxide Exchange of a Temperate Larch Forest. Agricultural and Forest Meteorology, 147, 110-124. https://doi.org/10.1016/j.agrformet.2007.07.005
- 8. Ohtsuka, T., Negishi, M., Sugita, K., Iimura, Y. and Hirota, M. (2013) Carbon Cycling and Sequestration in a Japanese Red Pine (Pinus densiflora) Forest on Lava Flow of Mt. Fuji. Ecological Research, 28, 855-867. https://doi.org/10.1007/s11284-013-1067-4
- 9. Pregitzer, K.S. and Euskirchen, E.S. (2004) Carbon Cycling and Storage in World Forests: Biome Patterns Related to Forest Age. Global Change Biology, 10, 2052-2077. https://doi.org/10.1111/j.1365-2486.2004.00866.x
- 10. Peichl, M., Brodeur, J.J., Khomik, M. and Arain, M.A. (2010) Biometric and Eddy-Covariance Based Estimates of Carbon Fluxes in an Age-Sequence of Temperate Pine Forests. Agricultural and Forest Meteorology, 150, 952-965. https://doi.org/10.1016/j.agrformet.2010.03.002
- 11. Yuste, J.C., Konôpka, B., Janssens, I.A., Coenen, K., Xiao, C.W. and Ceulemans, R. (2005) Contrasting Net Primary Productivity and Carbon Distribution between Neighboring Stands of Quercus robur and Pinus sylvestris. Tree Physiology, 25, 701-712. https://doi.org/10.1093/treephys/25.6.701
- 12. Kuzyakov, Y. and Gavrichkova, O. (2010) Time Lag between Photosynthesis and Carbon Dioxide Efflux from Soil: A Review of Mechanisms and Controls. Global Change Biology, 16, 3386-3406. https://doi.org/10.1111/j.1365-2486.2010.02179.x
- 13. Tomotsune, M., Masuda, R., Yoshitake, S., Anzai, T. and Koizumi, H. (2013) Seasonal and Inter-Annual Variations in Contribution Ratio of Heterotrophic Respiration to Soil Respiration in a Cool-Temperate Deciduous Forest. Journal of Geography, 122, 745-754.
- 14. Katakura, M., Yamanouchi, M. and Koyama, Y. (2007) Carbon Stocks and Biomass of Japanese Larch, Red Pine and Quercus Forests. And Changes in Surface Soil Carbon of Japanese Red Pine Forest after Logging. Bulletin of the Nagano Prefectural Forestry Research Center, 22, 33-55. (in Japanese)
- 15. Shidei, T. and Kira, T. (1977) Primary Productivity of Japanese Forests—Productivity of Terrestrial Communities. JIBP Synthesis 16. University of Tokyo Press, Tokyo.
- 16. Tomotsune, M., Yoshitake, S., Watanabe, S. and Koizumi, H. (2013) Separation of Root and Heterotrophic Respiration within Soil Respiration by Trenching, Root Biomass Regression, and Root Excising Methods in a Cool-Temperate Deciduous Forest in Japan. Ecological Research, 28, 259-269. https://doi.org/10.1007/s11284-012-1013-x
- 17. Hatiya, K., Fujimori, T., Tochiaki, K. and Andô, T. (1966) Studies on Seasonal Variations of Leaf and Leaf-Fall Amount in Japanese Red Pine (Pinus densiflora) Stands. Bulletin of the Forestry and Forest Products Research Institute, 191, 101-113. (in Japanese)
- 18. Mizoguchi, Y., Ohtani, Y., Takanashi, S., Iwata, H., Yasuda, Y. and Nakai, Y. (2012) Seasonal and Interannual Variation in Net Ecosystem Production of an Evergreen Needleleaf Forest in Japan. Journal of Forest Research, 17, 283-295.https://doi.org/10.1007/s10310-011-0307-0
- 19. Berg, B. and McClaugherty, C. (2003) Plant Litter: Decomposition, Humus Formation, Carbon Sequestration. Springer-Verlag, Berlin.https://doi.org/10.1007/978-3-662-05349-2
- 20. Hobbie, S.E., Reich, P.B., Oleksyn, J., Ogdahl, M., Zytkowiak, R., Hale, C. and Karolewski, P. (2006) Tree Species Effects on Decomposition and Forest Floor Dynamics in a Common Garden. Ecology, 87, 2288-2297.https://doi.org/10.1890/0012-9658(2006)87[2288:TSEODA]2.0.CO;2
- 21. Yashiro, Y., Lee, N.Y.M., Ohtsuka, T., Shizu, Y., Saitoh, T.M. and Koizumi, H. (2010) Biometric-Based Estimation of Net Ecosystem Production in a Mature Japanese Cedar (Cryptomeria japonica) Plantation beneath a Flux Tower. Journal of Plant Research, 123, 463-472. https://doi.org/10.1007/s10265-010-0323-8