Journal of Environmental Protection
Vol.08 No.01(2017), Article ID:73507,8 pages
10.4236/jep.2017.81004
Changes in Total Dissolved Solids Concentration during Infiltration through Soils (Rain, Fresh Groundwater and Treated Wastewater)
Alsharifa Hind Mohammad1*, Ghaidaa Abdullat2, Khitam Alzughoul3
1Water, Energy and Environment Center, The University of Jordan, Amman, Jordan
2Freelancers, Amman, Jordan
3Environmental and Applied Geology, School of Science, The University of Jordan, Amman, Jordan

Copyright © 2017 by authors and Scientific Research Publishing Inc.
This work is licensed under the Creative Commons Attribution International License (CC BY 4.0).
http://creativecommons.org/licenses/by/4.0/


Received: October 30, 2016; Accepted: January 13, 2017; Published: January 16, 2017
ABSTRACT
Water quality deterioration took place during infiltration process. Quality of the source water, climate conditions and amounts of added water are the major role players of the differentiation measures. Treated wastewater, rainwater and fresh groundwater were described within this study. It was found that the rainwater has an aggressive behavior with a high ability to dissolve soil salts. The amounts of Total Dissolved Solids (TDS) increase with infiltration process. Electrical conductivity (EC) increased by 600%. Plotting the fresh groundwater to the same conditions and experiment reflects the ability of this water to dissolve soil salts and increases the TDS by increasing the EC by a percentage of around 200%; while applying lower quality of water, the percentage of the EC of the treated wastewater increases to about 230% for the depth of 20 cm, which indicates the accumulation of the salts within this part of the soil, which leads to the deterioration of the soil quality, and decreases to about 160% for a depth of 60 cm. This differentiation could be a result of low permeability soils which tend to accumulate salts as a result of evaporation and then increase the salinity in the topsoil. Dissolution and plant uptake in the infiltrated take of minerals save the soil’s water from evaporation and do not allow salts to concentrate in soils. Moreover, plant uptake of soil water chemicals causes a decrease in some salt concentrations such as NO3, PO4, K, Na, and Cl and may conserve others.
Keywords:
Salinity, Infiltration, Suction Cups, Total Dissolved Solids

1. Introduction
The increasing demand for water in arid and semi-arid regions has encouraged hydrochemists, hydrogeologists and water engineers to consider water reuse. Therefore, interest in the use of treated wastewater has increased in most countries, especially due to the large amounts of wastewater produced as a result of population growth and improving living standards which require increasing water supply and use [1] .
Historically, infiltration of water into soils and recharging to the groundwater in Jordan took place through precipitation, floods along valleys and spring water used in irrigation. However, due to increasing water shortage and production of domestic wastewater, treated effluents started increasingly to be used directly in irrigation or after being mixed with the water source flow or flood flow of wadis. The impacts of the long-term usage of such water on soils and groundwater, hence the fate of irrigated agriculture and drinking water supply which depends on affected groundwater, have not yet been studied and evaluated [2] . The increasing interest in environmental and health issues in Jordan has stimulated the search for means of safe disposal of wastewater and its reuse. Treatment and reuse are the optimal options, because of the positive effects of wastewater treatment on the environment and the additional supply of water in the form of treated wastewater [3] . This water, with its richness in nutrients necessary for plant growth can be used in irrigation. Water supply is one of the main national concerns of Jordan that results from its limited water resources [4] .
This study concentrates on the physicochemical evolution of applied water to soils through irrigation during their infiltration to the groundwater. The results will shed light on participation/dissolution processes taking place during the infiltration, and the impacts on the soil’s physical and chemical characteristics along with the groundwater qualities.
Description of the Sampling Process
This study was done in different areas with different source water quality. The first location was in Amman in King Hussein Park for the rain-fed experiment, and the experiment was conducted there because of the high rainfall average at that location. Suction cups were installed at 3 different depths: 20, 40 and 60 centimeters (“cm”). For the fresh groundwater source, a greenhouse was located in Wadi as-Sir-this area is well known for its springs and groundwater wells -and suction cups were installed at 3 different depths: 20, 40 and 60 cm. For the treated wastewater, two locations were selected: A wastewater treatment plant (“WWTP”) at Queen Alia airport (“QAA”) suction cups within this test were installed in 25 and 45 cm depths; the other location was in Wadi as-Sir (“WS”) wastewater treatment plant, which serves western Amman areas suction cups were installed at 3 different depths: 20, 40 and 60 cm. The last experiment location, in Deir Alla, was selected to evaluate the changes with the mix of both treated wastewater and fresh groundwater. This area is irrigated by the water from the King Abdullah Canal (“KAC”). Many locations in the Jordan Valley are irrigated by this water, which is why deeper depths were studied within this location suction cups were installed at depths of 20, 40, 60 and 80 cm.
2. Methodology
To fulfill the objectives of this study, water samples were collected and evaluated from different soil depths from different sampling sites, using different sources of irrigation water which was collected by using suction cups. The collected water samples, in addition to the source water, were analyzed for different salinity and pollution parameters. Water from rainfall, fresh springs, treated wastewater and mixed fresh and treated wastewater were collected and analyzed in this project.
The first parameter evaluated for the sources and the drawn water was the electrical conductivity. In addition to that the analyzed parameters were calcium, carbonate, chloride, magnesium, sodium, potassium, nitrate, phosphate and sulfate using the American Standard Methods for water analyses.
One of the procedures to determine the equilibrium state of water with a mineral phase is through calculation of the saturation index (SI). Saturation index (SI) is defined as:

where: IAP = Ionic Activity Product, and Keq = mineral equilibrium constant at a given temperature [5] .
Moreover, samples were categorized according to the Piper diagram, which describes the relative composition of Cations and anions in a triangular diagram reflected on a diamond shaped diagram that combines both Cations and anions [6] .
3. Discussion and Results
3.1. Differentiations in Electrical Conductivity (EC)
As mentioned before, different sites were studied in this work according to the source water quality; in the rain-fed location suction cups were installed at depths of 20, 40 and 60 cm into the soil to study the changes in the physicochemical parameters during infiltration and water rock interactions on the infiltrated rainwater chemistry [2] . When comparing the composition of the applied water with that of the soil water at different depths, it can be noticed that the EC increased by approximately 600%, from 60 micro siemens per centimeter (“μs/ cm”) at the surface (source water) up to about 688 μs/cm at the 60 cm depth. The increase can be attributed to water evaporation and dissolution of soil minerals. For the fresh groundwater type, when comparing the chemistry of the source water and infiltrated water at different depths, it was found that the EC increased by approximately 200%, from 576 μs/cm in the source water at the surface up to 1560 μs/cm at the depth of 60 cm. Figure 1 and Figure 2 show that the variations of concentrations of chemical parameters were compatible with
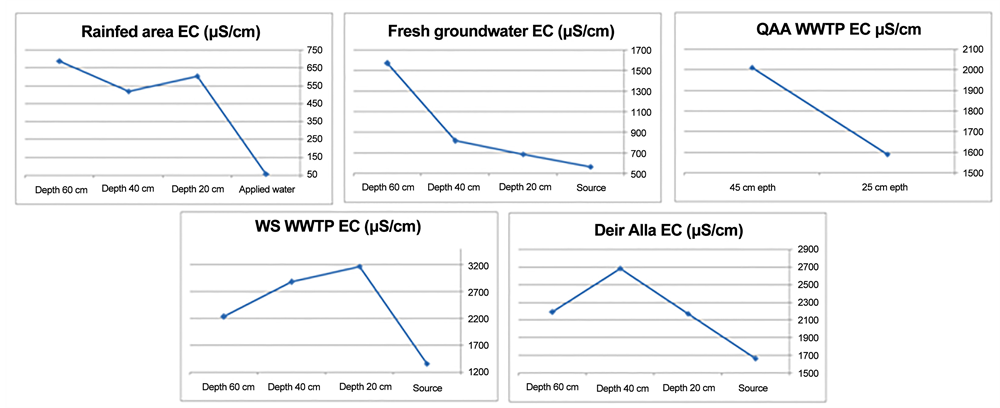
Figure 1. Electrical conductivity changes during infiltration for different sites.
the depth. The effects during infiltration are: 1) increasing concentrations of the different parameters as a direct result of dissolution of soil minerals and 2) high evaporation from the topsoil.
3.2. Differentiations in Saturation Indices (SI)
The calcium carbonate solubility equilibrium is highly important in many phases of water chemistry. It is directly associated with scale formation in many types of equipment, from tea kettles to boiler feed water heaters, and with incrustation of well screens, filter sand, meters and water taps. In physiological chemistry it is significant in relation to bone calcification and to blood equilibriums. In geochemistry the deposition of carbonates is also related to this equilibrium.
The equilibrium balance is affected by many natural reactions in water, before, during or after the process of treatment.
Saturation index (SI) is defined as:

where: IAP = Ionic Activity Product, and Keq = mineral equilibrium constant at a given temperature [5] .
This parameter was done for samples from the locations for different dominant minerals, namely, if SI equals zero, then the water is in equilibrium with regard to the mineral phase. If the SI value is negative (less than zero), the water is undersaturated with regard to the mineral phase and it will dissolve the mineral phase to reach an equilibrium state. If the SI is positive (greater than zero), the water system is oversaturated with regard to the mineral phase and the mineral precipitates [5] .
Applying the SI to the rainwater shows that this water is of aggressive nature; the SI is below zero for all dominant minerals, and its dissolution capability decreases with depth because it dissolved some vadose zone salts during its
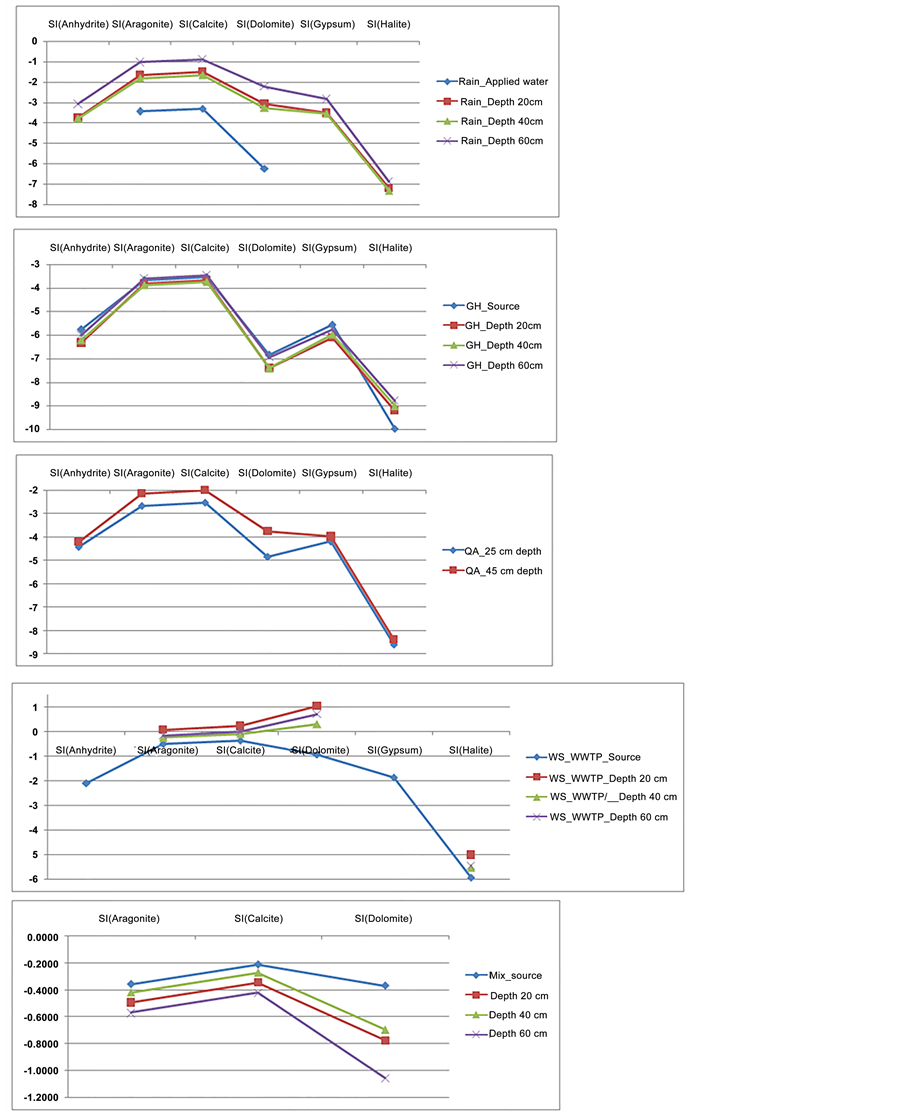
Figure 2. Saturation index changes during infiltration for different sites.
movement. The fresh groundwater site shows that the water is undersaturated with respect to all minerals anhydrite, aragonite, calcite, dolomite, gypsum and halite which reflect the ability of this water to dissolve those minerals. The changes in the SI with depth are small and reflect two mechanisms, which work in two different directions: 1) decreasing deficit of SI (less negative SI values) as a result of additional water rock interactions and 2) common ion effect which cause increasing deficit of SI (more negative SI values). The infiltrated water, even at the depth of 60 cm, is capable of dissolving not only gypsum and halides, but also carbonates such as dolomite and calcite, which are the main soil constituents. For the treated wastewater sites, in the QAA WWTP, SI showed increasing saturation with depth, which means that water dissolves salts from soil and becomes more concentrated in the infiltrated water by depth. Moreover; for the WS WWTP, SI showed wide variations: at the source, the water was undersaturated with regard to all salts; at the depth of 20 cm and below, it became oversaturated with aragonite, calcite and dolomite and able to precipitate them and change soil salinity. For the mixture between fresh and treated wastewater, SI showed that the water dissolves salts with depth, and those salts become more concentrated, but the water is still undersaturated and it is able to dissolve more salts from the soil. Figure 2 shows the different saturation indices for different locations.
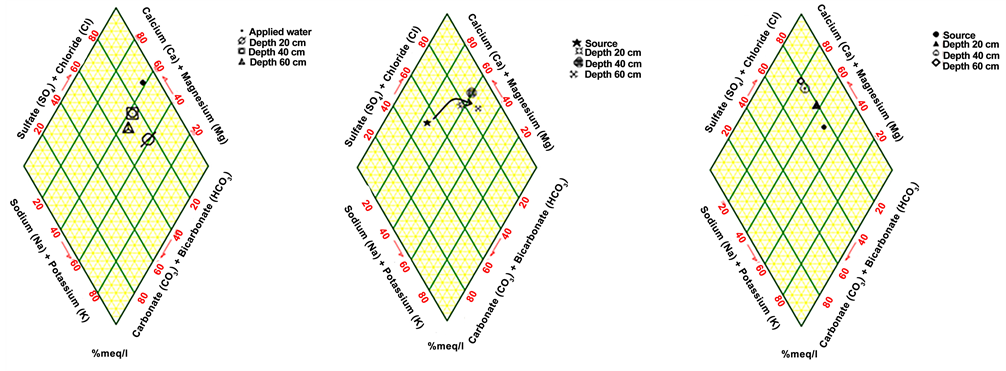
3.3. Differentiations in Plotting on Piper Diagram
A Piper diagram was done for the samples under the environment of Rockworks [7] : A software that draws different parameters for the water quality. The Piper diagram for rain-fed area samples shows that the water is an alkaline water type with increased portions of alkalis with prevailing sulfate at all stage depths. From the plot of fresh groundwater samples it can be noticed that the source water type is earth alkaline with increased portions of alkalis and privilege sulfate and chloride, developing with depths to alkaline water. Plotting the water in the Queen Alia airport WWTP Piper diagram shows that, with depth, the water turns from alkaline water to earth alkaline water. In the treated wastewater of Wadi as-Sir WWTP the Piper diagram reflects earth alkaline water with increased portions of alkalis and privilege sulfate and chloride. Mixed water in the Deir Alla site plotted in the Piper diagrams how that, with depth, water turns from alkaline water to earth alkaline water. Figure 3 shows the results of the Piper diagram plotting for all sites [8] .
4. Conclusions
Rainwater increases in salinity during infiltration with increasing depth. The increase in the concentrations of the different parameters is a direct result of dissolution of soil minerals and evaporation from the topsoil. In the freshwater of the springs used for irrigation in the Wadi as-Sir plant nursery, the increase in EC and other parameters with depth can be attributed to the evaporation and slight dissolution of soil minerals. In the Wadi as-Sir WWTP, on comparing the chemistry of the applied water and the infiltrated water at depths of 20, 40 and 60 cm, it was found that the EC increased at the depth of 20 cm, and then it decreased at 40 cm, and further at 60 cm. The water salinity is therefore at its highest at the depth of 20 cm and it decreases gradually with depth. The collection of samples from different depths extended over a time period with an average of around 72 hours after irrigation. Therefore, the first two depths 20 and 40
 (a) (b) (c)
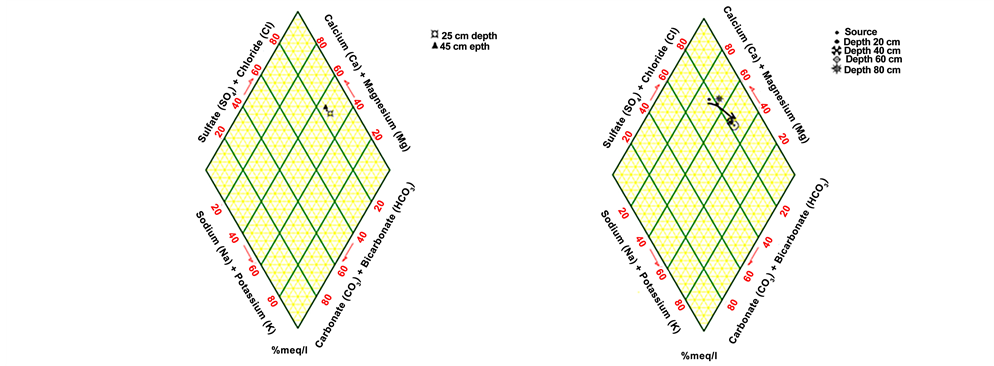 (d) (e)
Figure 3. Plotting of samples on Piper diagram for different sites: (a) rain-fed area. b: Groundwater. (c) Wadi as-Sir WWTP. (d) Queen Alia airport WWTP. (e) mixed water in Deir Alla site.
cm remain under the effects of irrigation and evaporation which may show higher or lower salt content.
Different impacts affect the development of soil salinity and the degradation of infiltration water into groundwater bodies. These impacts are: the composition of irrigation water, type of irrigation: furrow, drip, subsurface or sprinkler, evaporation, protected (greenhouse), mulch or open to climatic effects and the type of applied irrigation water.
The results of suction cup tests applied on a variety of soil types, using different water compositions, and testing different climatic conditions, show the following:
1) As long as generous excess irrigation is used, soils and groundwater will only be affected by the type of applied water, as the same applied water percolates down to the groundwater.
2) Low permeability soils tend to accumulate salts as a result of evaporation, dissolution and plant uptake of minerals.
3) Protected irrigation water application (greenhouse, mulch and subsurface irrigation) saves soil water from evaporation and does not allow salts to concentrate in soils or in the infiltrated water to the groundwater.
4) Plant uptake of soil water chemicals causes a decrease in some soil water constituents, such as NO3, PO4, K, Na, and Cl and conserves many others. Therefore crop water irrigation requirements should be applied to soils. At the same time, however, the losses from irrigation evaporation and transpiration must be minimized by the use of greenhouses, mulches, drips and even subsoil irrigation.
Cite this paper
Mohammad, A.H., Abdullat, G. and Alzughoul, K. (2017) Changes in Total Dissolved Solids Concentration dur- ing Infiltration through Soils (Rain, Fresh Groundwater and Treated Wastewater). Jour- nal of Environmental Protection, 8, 34-41. http://dx.doi.org/10.4236/jep.2017.81004
References
- 1. Rimawi, O. (1991) Chemical Changes of Yeast Industry Wastewater during Infiltration in Ruseifa Area, Jordan. Hydrological Science Journal, 44, 799-810.
https://doi.org/10.1080/02626669909492274 - 2. Jasem, H. (2009) Groundwater Vulnerability in Wadi Kafrain Catchment Area and Its Surroundings. Using GIS, Ground Truthing and Lab Analysis. Ph.D. Thesis, University of Jordan, Unpublished.
- 3. Lee, G.F. and Jones-Lee, A. (1995) Public Health and Environmental Safety of Reclaimed Wastewater Reuse. In: The Role of Recharge in Integrated Water Management, Proceedings of Seventh Biennial Symposium on Artificial of Groundwater, Water Resources Research Center, University of Arizona, Tucson.
- 4. Mohammad, A.H., Almomani, T. and Alhejoj, I. (2015) Groundwater Vulnerability for the Surface Outcropping Aquifers in Jordan. Journal of Environmental Protection, 6, 250-258. https://doi.org/10.4236/jep.2015.63025
- 5. Drever, J.I. (1997) The Geochemistry of Natural Water: Surface and Groundwater Environments. 3rd Edition, Prentice Hall, New Jersey.
- 6. Piper, A.M. (1944) Graphical Procedure in Geochemical Interpretation of Water Analysis. Transactions American Geophysical Union, 25, 914-928.
https://doi.org/10.1029/TR025i006p00914 - 7. Rockworks (1998) Geological Data Management Analysis & Display Software (Computer Software). Golden, Colorado-USA.
- 8. Abdallat, A. (2011) Effects of Improved Treatment in Khirbet As Samra Plant and Its Effects on the Recipient Water Bodies and Irrigated Soils—An Environmental Study. Master Thesis, University of Jordan, Unpublished.