Journal of Environmental Protection
Vol.5 No.3(2014), Article ID:43363,7 pages DOI:10.4236/jep.2014.53024
Determination Uranium Concentrations and Effective Dose of Drinking Water for Nineveh Governorate—Iraq, Using Kinetic Phosphorescence Analyzer (KPA)
1Department of Physics, College of Science, University of Baghdad, Baghdad, Iraq; 2Ministries of Environment, Radiation Protection Center, Baghdad, Iraq.
Email: shafeq_sh@yahoo.com, qscgy_qs@yahoo.com
Copyright © 2014 Shafik Shakier Shafik et al. This is an open access article distributed under the Creative Commons Attribution License, which permits unrestricted use, distribution, and reproduction in any medium, provided the original work is properly cited. In accordance of the Creative Commons Attribution License all Copyrights © 2014 are reserved for SCIRP and the owner of the intellectual property Shafik Shakier Shafik et al. All Copyright © 2014 are guarded by law and by SCIRP as a guardian.
Received December 31st, 2013; revised January 27th, 2014; accepted February 21st, 2014
Keywords: Uranium; KPA; Drinking Water; Intake; Annual Effective Dose; Nineveh
ABSTRACT
In this work, the concentrations of natural Uranium and the annual effective dose (ET QUOTE 
 in Sv∙y−1) in drinking water for Nineveh Governorate in northern Iraq were determined using a pulsed-laser Kinetic Phosphorescence Analyzer (KPA). Furthermore, the relationship between pH for water samples and the concentration of Uranium was studied. The drinking water samples are taken approximately from all regions of Nineveh as; 15 samples of tap water are taken from refinery stations, 13 samples of water samples are taken from wells that are used for drinking, and 18 samples of drinking water are withdrawn from wells in Adayyah region (this region is located near nuclear wastes site). Thus, the total studied samples are 46. The results of Uranium concentration for all samples ranged from 2.61 ± 0.08 to 9.14 ± 0.012 µg∙L−1 with an overall average value about 5.87 ± 0.046 µg∙L−1, and the total annual effective dose ranged from 2.3 to 8.04 µSv∙y−1. The results also showed that the pH number increases with increasing Uranium concentration and have, in general, high values in well water.
1. Introduction
There are many studies and researches [1-4], which focus on measuring the concentration of Uranium in drinking water in the province of Nineveh. However, these studies used different techniques in the process of measuring the concentration of Uranium in drinking water such as solid state nuclear track detector (SSNTD). These techniques differ in the accuracy of measurements, i.e. in the minimum detectable efficiency, so it became necessary to measure the concentration of Uranium in drinking water using modern technology with high ability to detect very small concentrations such as KPA technique. KPA, the main characteristic showed in Table 1 (which was used in this work), is a technique that provides rapid, precise and accurate determination of Uranium concentration in aqueous solutions. KPA is a sensitive and selective analytical technique, with low detection limits (is about 0.01 µg∙L−1) [5].
On the other hand, water systems are required to undergo extensive monitoring for radioactive contamination to ensure that their drinking water is safe and monitoring of Uranium contents in different kinds of water must be routinely done for surface, underground, mineral, drinking and well waters. The estimation of Uranium in water may also be significant for the hydrogeochemical prospection for Uranium, for health risk assessments and also for mitigation processes.
Accordingly, drinking water containing high levels of Uranium can cause adverse health effects. Consequently of non-biodegradable nature, the heavy metals including Uranium accumulate in vital human organs and exert progressively growing toxic actions [6]. Most notably, long-term ingestion of Uranium and some other heavy
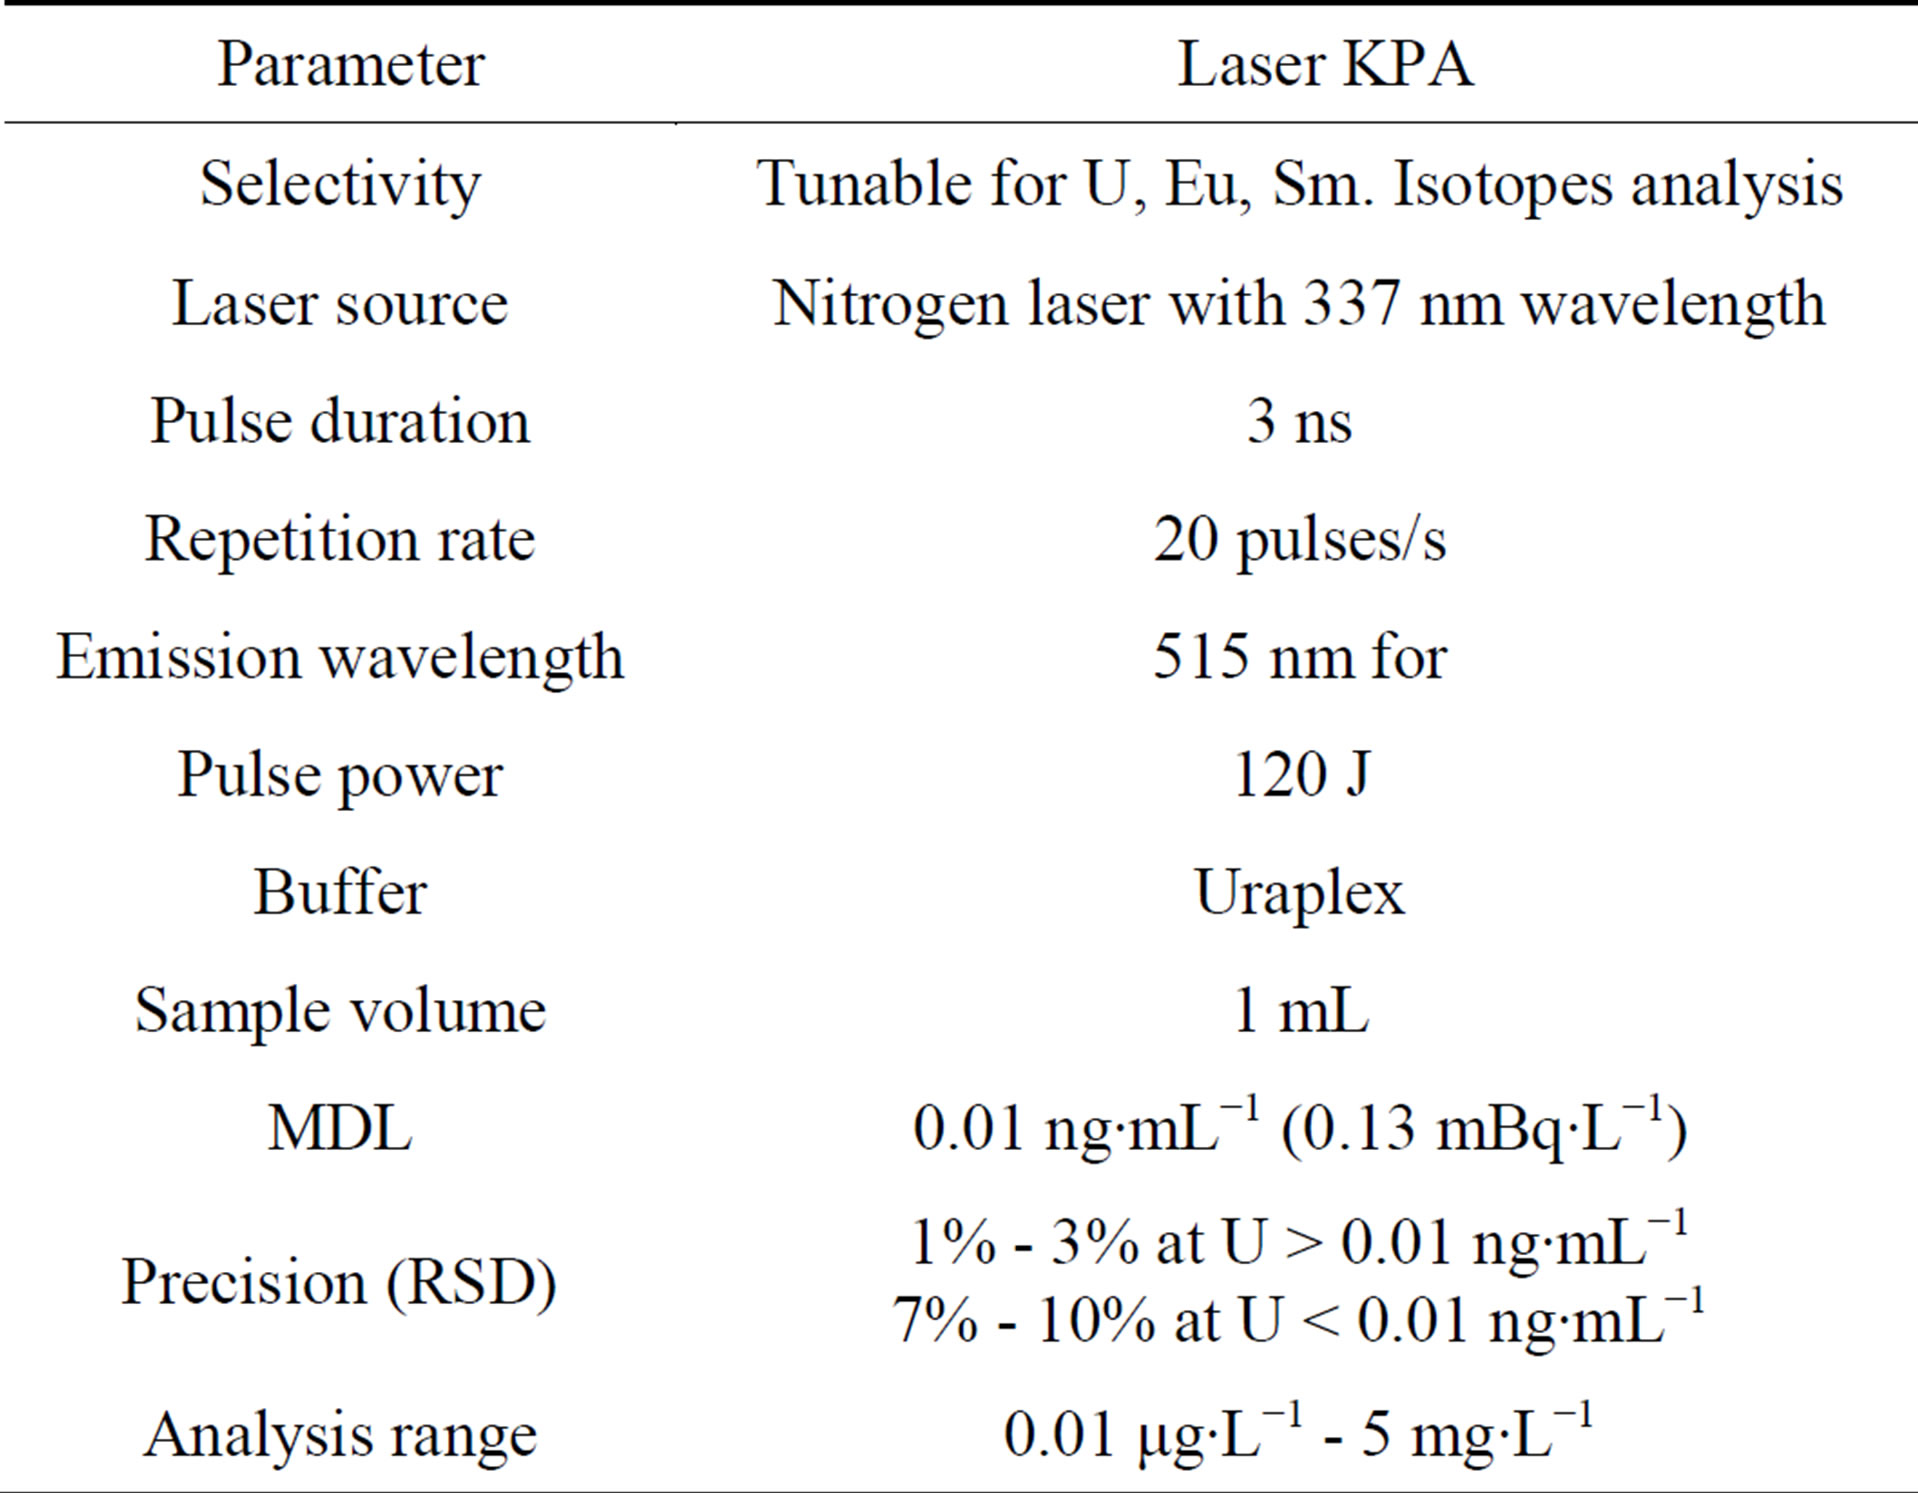
Table 1. The main characteristics of the KPA [13].
metals may increase the risk of kidney damage, cancer and cardiovascular diseases [7,8], whereas the experimental evidence suggests that the respiratory and reproductive systems are also affected by Uranium exposure. Public community water supplies must comply with the maximum contaminated limits (MCL) for Uranium concentration recommended by various National and International Agencies like 15 µg∙L−1, 30 µg∙L−1 and 9 µg∙L−1 [9-12] etc.
Governorate of Nineveh depends on the Tigers River to supply the public with drinking water. There are several refinery stations to refine the river water and to supply it to consumers. In addition to the refinery stations, some public of Nineveh using well or/and mineral water in drinking.
Nineveh is located in northern Iraq and Mosul city represents capital of it. The geographic coordinates of Mosul is between latitude 37˚1'45.51"N, longitude 42˚21'40.14"E and latitude 35˚25'12.78"N, longitude 42˚47'31.17"E, and the height above sea level ranges from 202 to 364 m, while Adayyah locates 50 km to the west of the Mosul city, and lies at latitude 36˚10'95.9"N and longitude 42˚45'62.8"E. After the 2003 Gulf War, destroyed equipment, concrete, rubble and miscellaneous solid wastes were trucked to this village. These materials were dumped into excavations in the soil and subsequently covered. Most of the equipment and rubble were contaminated by Uranium compounds as yellowcake.
The aim of this work is to measure and determine the concentrations and effective dose of Uranium in all varied drinking water used by publics living in Nineveh governorate and in Adayyah village which think to have contamination with Uranium because of the anarchy and stolen processes in Al-Ramahi factory for phosphate production in Adayyah village.
2. Sample Collection
Water samples were collected from mostly all regions of Nineveh, which included water samples from residential districts and from refinery stations where these stations recited water from the Tigris River and then launched into residential districts. The samples can be distributed as: fifteen tap water samples taken from different parts of Nineveh, thirteen water samples collected from wells from different regions with different depths ranged from 15 to 25 m, and eighteen samples of well waters were collected from the Adayyah with depths about 30 m.
3. Methodology
Uranium concentration measurements were performed using the KPA-11; (Chemchek Instruments Inc., USA) [14].
Uranium concentration (UC) in the sample is calculated using the following equation [15]:
 (1)
(1)
where Ut is the total Uranium (the weight of the total uranium), Wa is the aliquant weight in grams, and Fb is the dilution factor in (gram sample/gram solution). The KPA-11 is controlled by KPAWin software operating under Windows for automatic calculation of Uranium concentration [13].
Uranium standard solutions were prepared using Uranium Octoxide U3O8. Firstly a stock standard solution of 1000 mg∙L−1 (1000 ppm) was prepared by dissolving 117.9 mg of U3O8 in 100 mL of 0.82 M nitric acid (HNO3) in volumetric flask. To construct the calibration curve for kinetic phosphorescence analysis series of calibration standard were prepared to cover a wide range of Uranium concentration which may be expected in drinking water samples. Uranium concentrations in the series of standards were 0.5, 1, 2, 3, 4, 5, 7, 8 and 10 µg∙L−1. This set of standards was used to construct the calibration curve. In addition, background measurements, as in calibration, were performed using nine calibration standard solutions for each analytical range, ranging in concentration from the detection limit up to 10 µg∙L−1. A blank sample of 0.82 M HNO3 was used to determine the background and reagent UC. The blank’s phosphorescence intensity was subtracted from all KPA measurements.
4. Sample Preparation Procedure
4.1. Procedure for pH Measurements in Water
The pH of water was measured using the procedure of the American Society for Testing and Materials (ASTM) [16]. Place the water sample in a clean glass beaker provided with a thermometer and a stirring bar. Then, pH measured with stirring at a rate that will prevent splashing and avoid loss or gain of acidic or basic gases by interchange with the atmosphere. Measure successive portions of the water sample until readings on two successive portions differ by no more than 0.05 pH unit. Two portions will usually be sufficient if the water is well-buffered.
4.2. Procedure of Water Sample Preparation for KPA-11
The sample preparation of drinking water was measured using the procedure of the ASTM [16]:
1) Pipit 5 mL of sample into a glass vial previously treated.
2) Add 1 mL of concentrated HNO3 and two or three drops of 30% hydrogen peroxide.
3) Place the vial on a hot plate and heat to dryness. Take care that spattering of the sample does not occur, placing the vial in a 50 mL beaker makes it easier to handle and not so apt to be knocked over.
4) Remove the vials from the hot plate and add 1 mL of concentrated HNO3, two or three drops of 30% hydrogen peroxide, and heat to dryness. Repeat as necessary until only a white or translucent residue remains.
5) Add 1 mL of 4 M HNO3 and warm gently, if necessary, to dissolve the residue. Then add 4 mL of water. Swirl to mix thoroughly.
6) Analyze the solution using KPA-11.
5. Results and Discussion
The KPA-11 detection limit (DL) for Uranium concentration was determined by analyzing the same standard solution of 0.05 µg∙L−1 for ten different times. The standard deviation (S.D) of the background measurements was then determined in terms of concentration. The calculation of DL at the 99% confidence level was found using the formula: DL = 2.8 × S.D [17]. The obtained value of SD was 0.0035 µg∙L−1 with detection limit about 0.01 µg∙L−1.
Uranium concentration, the annual effective dose, and the pH results for all samples have been illustrated in Tables 2 and 3. The range of Uranium concentration for tap water samples is 2.61 ± 0.017 to 5.13 ± 0.032 µg∙L−1 with an overall average value of 3.73 ± 0.0201 µg∙L−1, and is 3.28 ± 0.008 to 4.31 ± 0.008 µg∙L−1 for wells waters samples with an overall average value of 3.74 ± 0.0127 µg∙L−1. The pH of tap water samples was ranged from 7.6 to 7.93 whereas for wells waters samples from 7.63 to 8.32. The overall results showed that the Uranium concentration increases with increasing pH value, and the Uranium concentration for wells waters samples have values larger than tap water samples. This can be attributed to the refinery processes on tap water in refiner stations which reduce the sands and plankton in waters.
The health and environmental protection agencies have recommended safe limit of Uranium in drinking water for human beings. United States EPA was recommended 30 µg∙L−1, WHO was recently recommended 15 µg∙L−1, UNSCEAR was recommended safe limit as 9 µg∙L−1 and ICRP was recommended the safe limit as 1.9 µg∙L−1 [9-12]. Therefore, one can note that the results of uranium concentration compatible with safe values for all agencies except for ICRP [14]. On the other hand, one can easily note that the pH number for wells water samples larger than tap water samples and all samples larger than the recommended limits (6.8 - 7.5).
In Adayyah village, the main and only source of drinking waters is the wells. Table 4 showed all the results of the Adayyah wells waters. The range of Uranium concentration for these samples is 3.43 ± 0.004 to 9.14 ± 0.012 µg∙L−1 with an overall average value of 5.815 ± 0.017 µg∙L−1. The pH was measured for samples and the results showed that the range is 7.62 to 8.47. Again, one can note that the pH values increasing with increases Uranium concentration and the values is high comparing with standard limits.
Daily intake was estimated from the amount of a substance in food or drinking water, expressed on a body mass (usually mg/kg body weight), which can be ingested daily over a lifetime by humans without appreciable health risk.
The daily intake of water average over the whole population is given by the international standard consumption rate of 1.4 L∙d−1 [17] and ICRP consumption rate of 2 L∙d−1, so, for risk assessment a worst case value of 2 L∙d−1 [18].
Daily intake in the taps water varied from 5.22 ± 0.034 to 10.26 ± 0.064 μg∙d−1 with an overall average value 7.74 ± 0.049 μg∙d−1, in the wells water ranges from 7.22 ± 0.042 to 8.62 ± 0.016 μg∙d−1 with an overall average value 7.92 ± 0.029 μg∙d−1, and in Adayyah wells water ranges from 6.86 ± 0.008 to 18.28 ± 0.024 μg∙d−1 with an overall average value 12.57 ± 0.016 μg∙d−1.
Uranium which is found in water considered as natural Uranium (Unat), knowing that the specific activity for natural Uranium which is 25.4 Bq∙mg−1 and including 3 types of uranium isotopes (238U, 235U and 234U). The activity can be calculated for these isotopes by knowing the specific activity and the mass fraction of them (illustrated in Table 5) and using the equation:
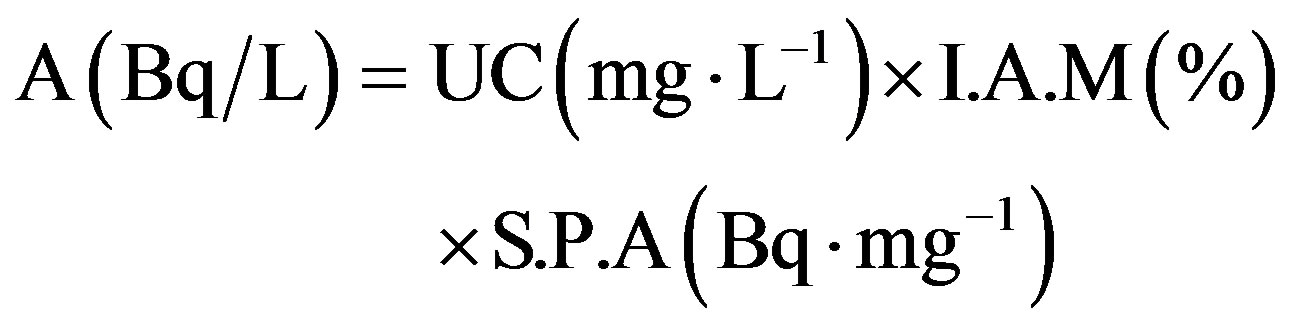 (2)
(2)
where A is the specific activity (Bq∙L−1), I.A.M is the
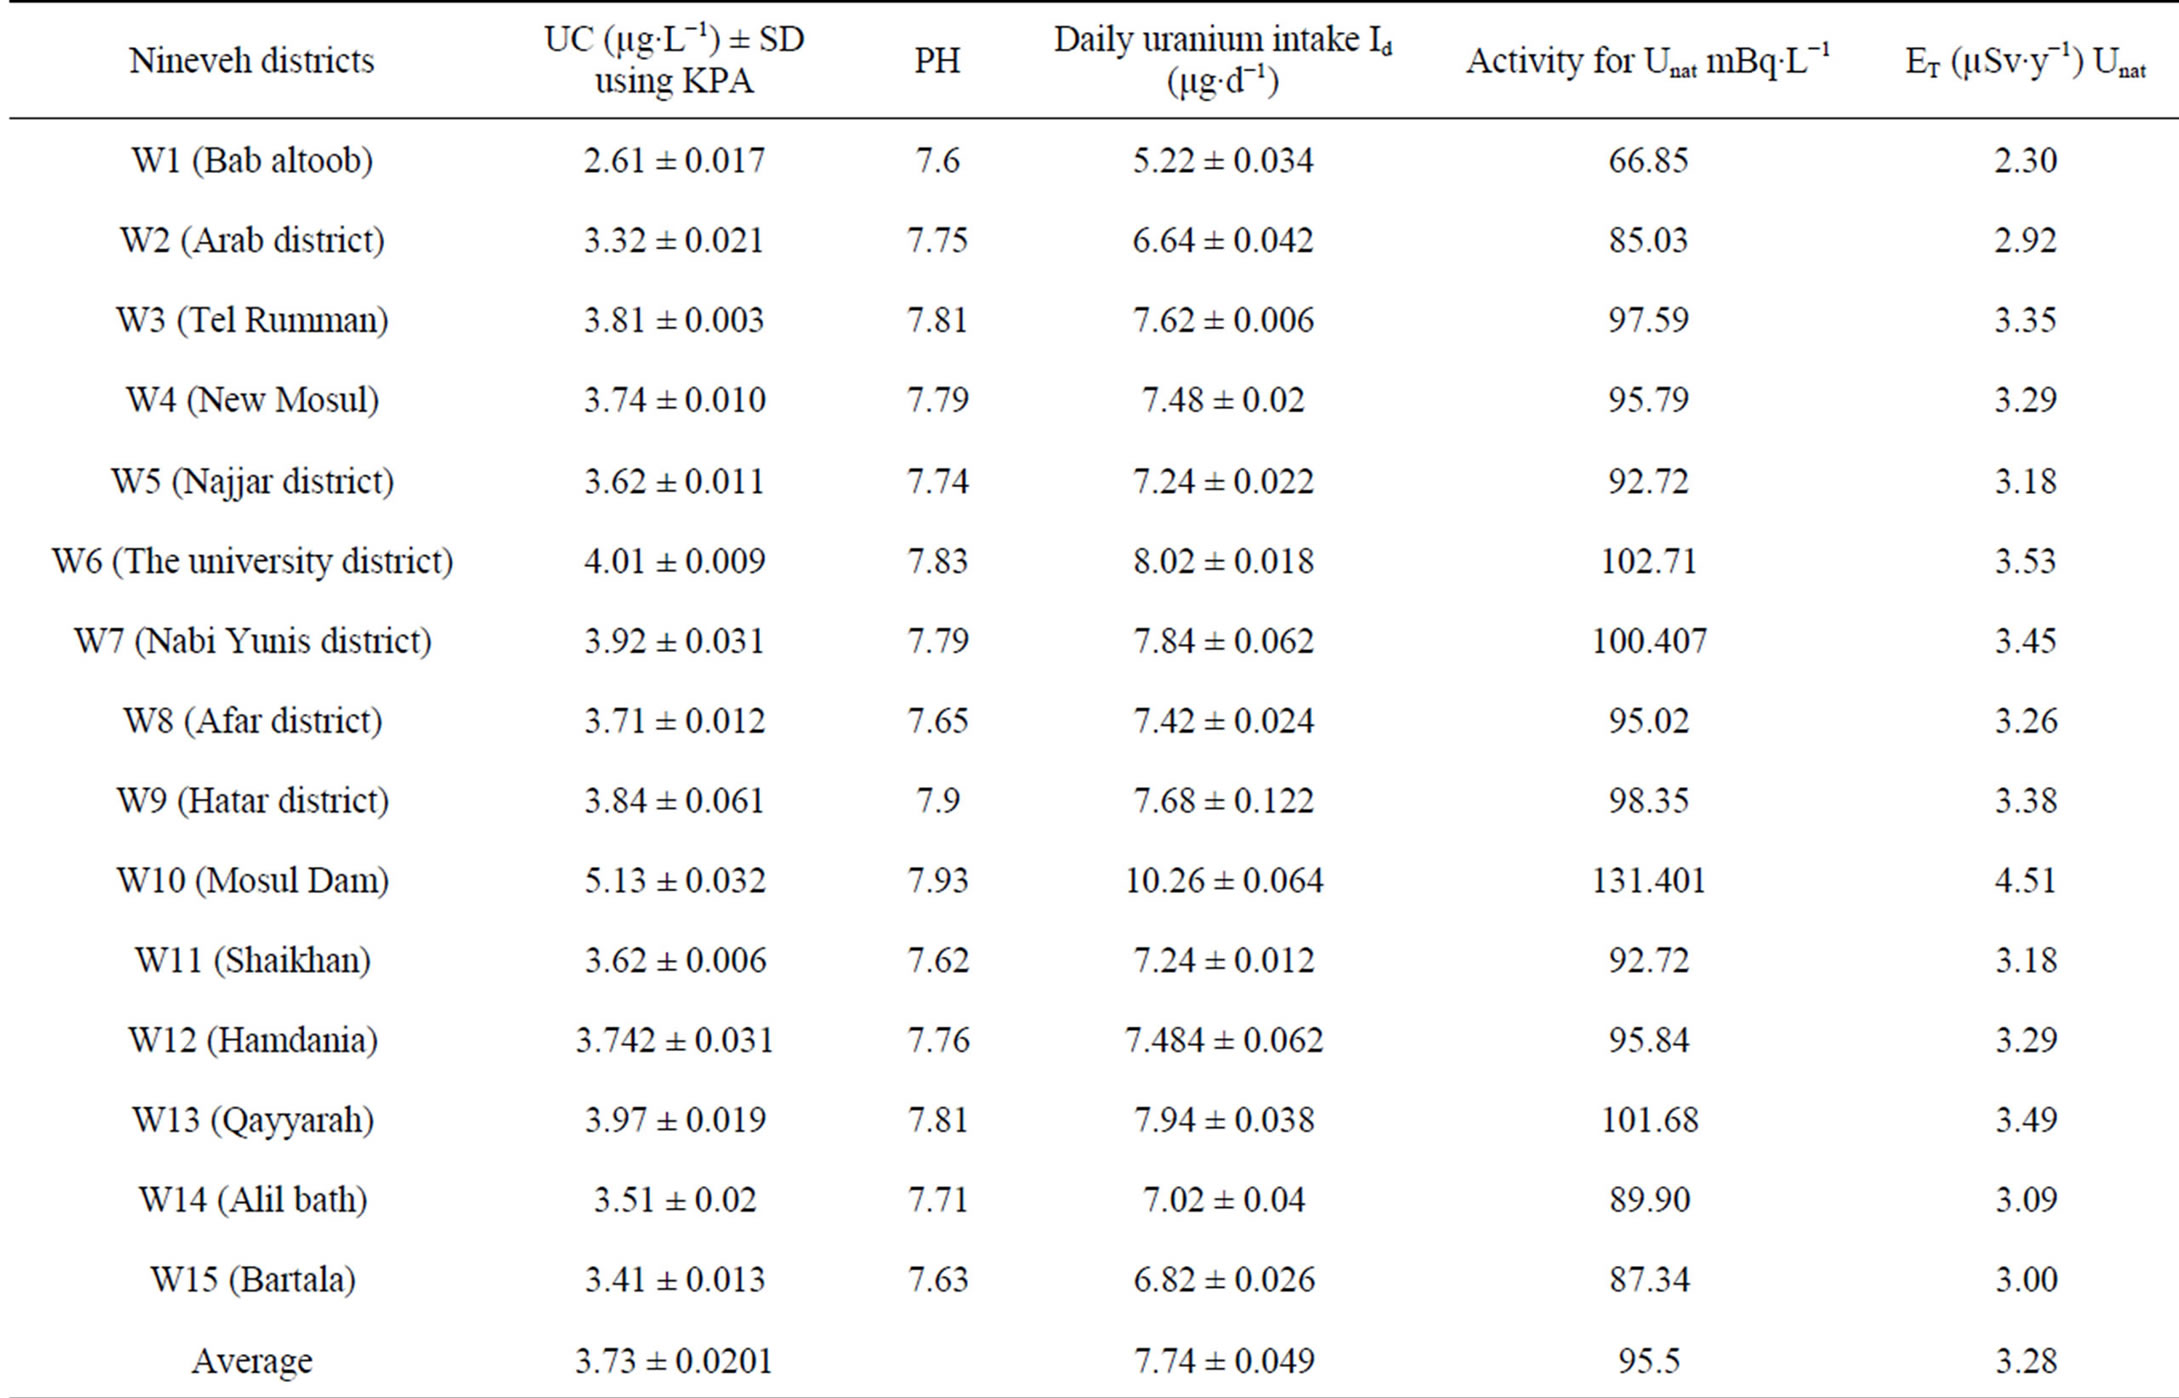
Table 2. UC, pH, daily uranium intake Id (μg∙d−1), Uranium natural activity (mBq∙L−1) and annual effective dose to the public ET (µSv∙y−1) in taps water of Nineveh.
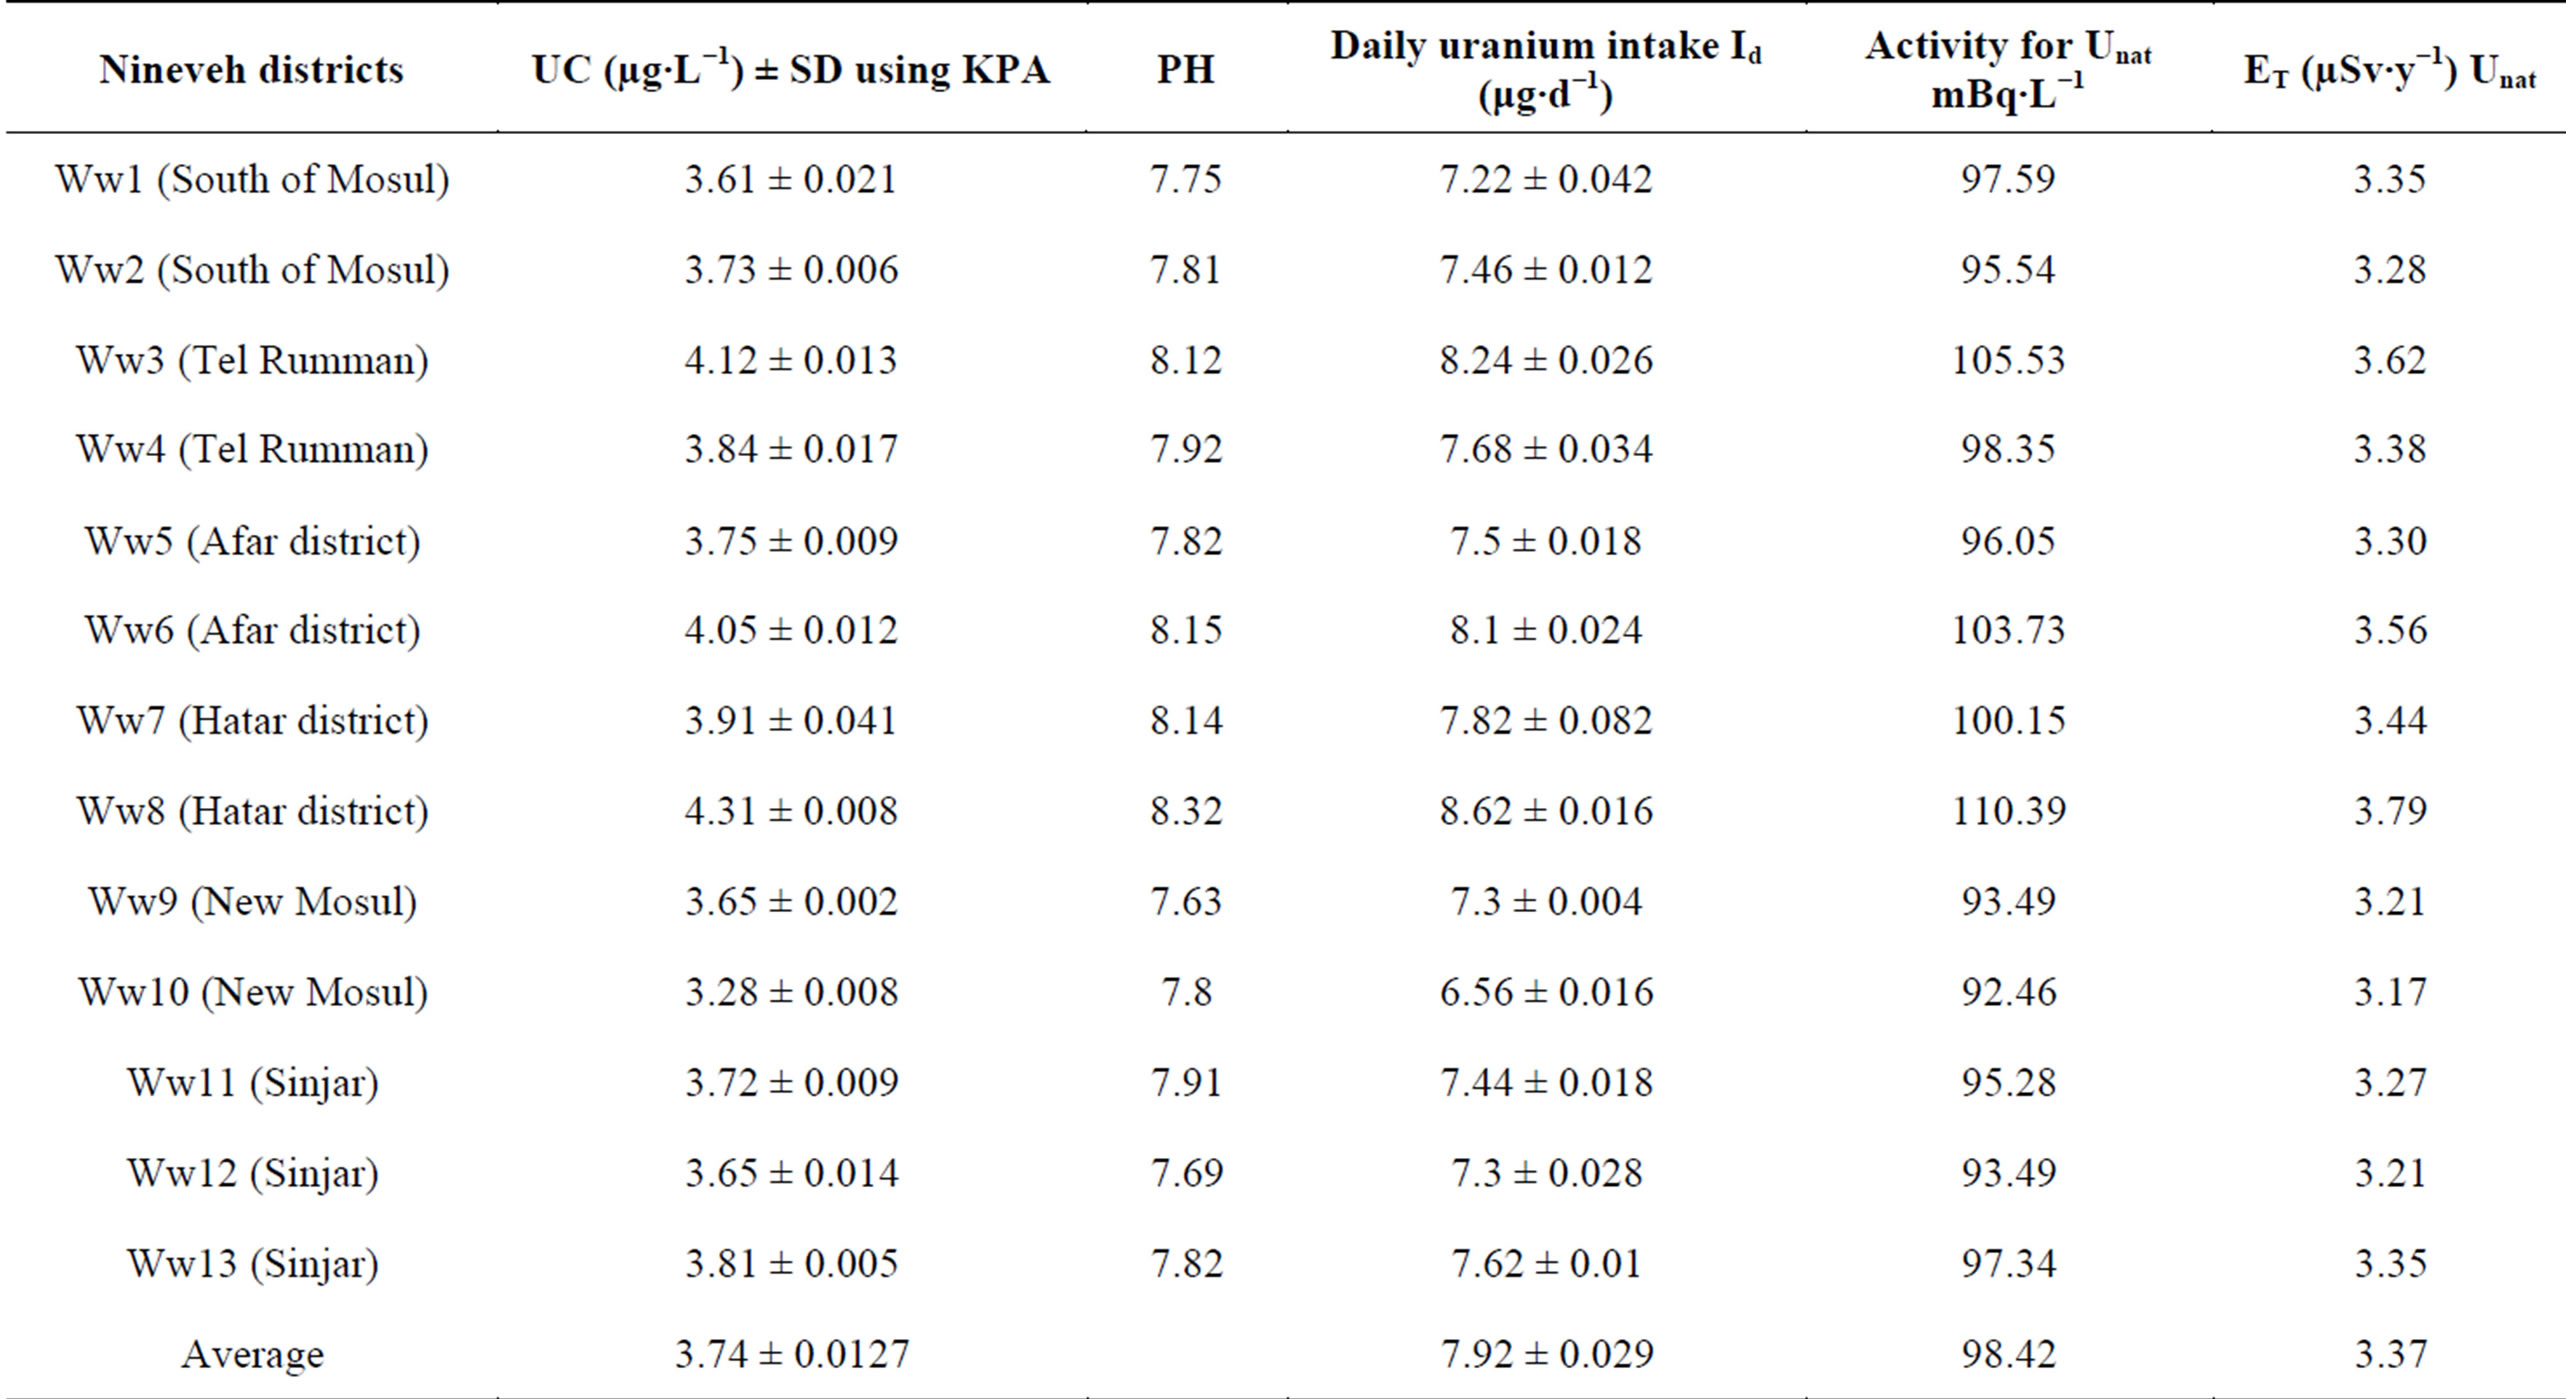
Table 3. UC, pH, daily uranium intake Id (μg∙d−1), Uranium natural activity (mBq∙L−1) and annual effective dose (ET inµSv∙y−1) to the public in wells water of Nineveh.

Table 4. UC, pH, daily uranium intake Id (μg/d), Uranium natural activity (mBq/L) and annual effective dose (ET in µSv∙y−1) to the public in Adayyah wells water of Nineveh.
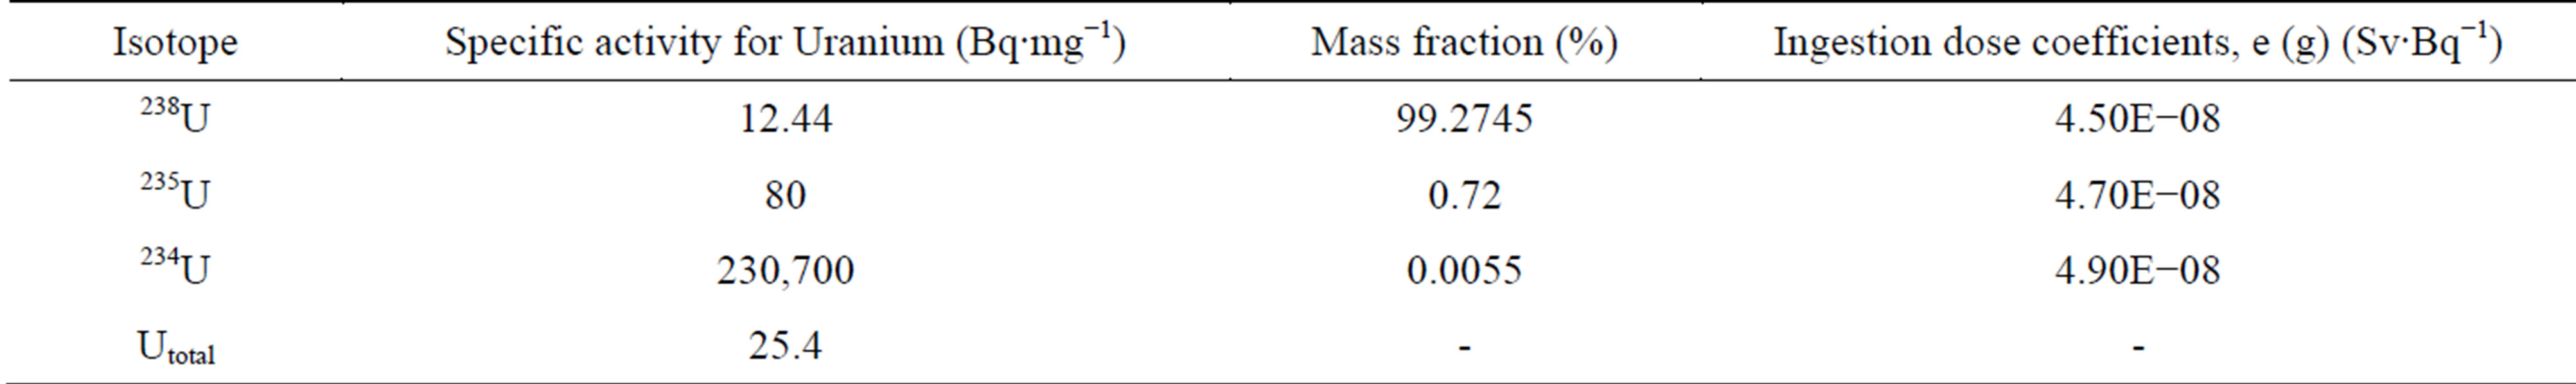
Table 5. Radioactive properties of natural uranium isotopes [19-22].
isotopic abundance (%) by mass fraction, and S.P.A is the specific activity [19].
Table 2 shows that the specific activity of Unat in taps water of Nineveh is in the range of 66.85 to 131.40 mBq∙L−1. Table 3 shows that the specific activity of Unat in wells water of Nineveh is in the range of 92.46 to 110.39 mBq∙L−1. Table 4 shows that the specific activity of Unat in Adayyah wells water of Nineveh are in the range of 87.85 to 234.11 mBq∙L−1. The range of Unat in all types’ water of Nineveh ranged from 66.85 to 234.11 mBq∙L−1.
6. Annual Effective Dose
The annual effective dose, ET (Sv∙y−1), to the public (after calculated the 238U, 235U and 234U, originated from the ingestion of drinking water), can be given according to [20]
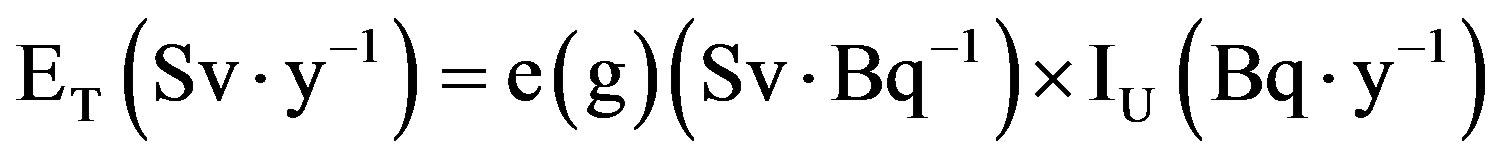 (3)
(3)
where  is the dose coefficients (Sv∙Bq−1).
The annual intake of uranium (IU (Bq∙y−1)) isotopes from drinking water for an adult consuming 2 L∙d−1 (IU238 (Bq∙y−1), IU235 (Bq∙y−1) and IU234 (Bq∙y−1)) is considered by Equation (7).
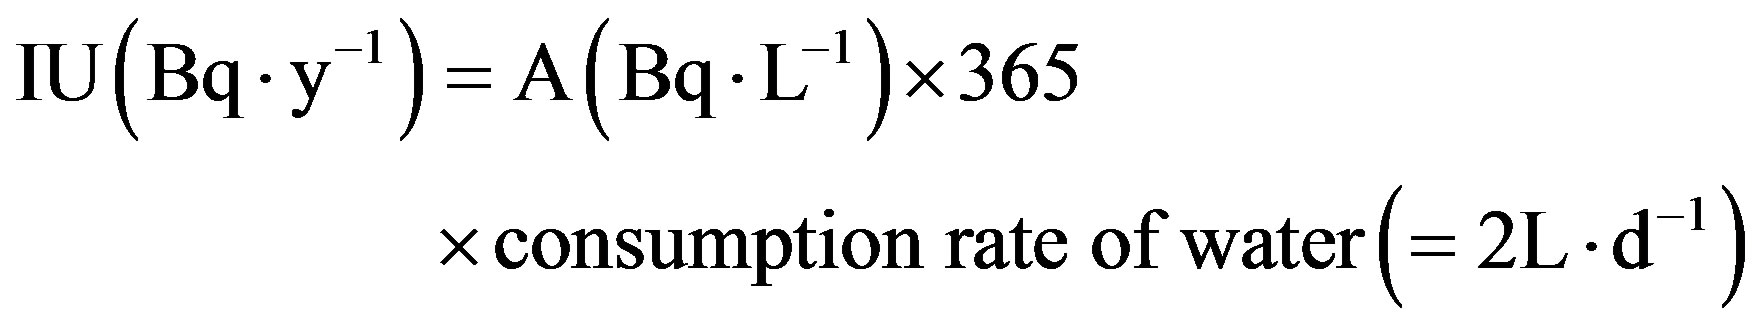 (4)
(4)
Table 2 showed the results of the ET of the water samples of Nineveh city which has the minimum and maximum values as 2.30 to 4.51 µSv∙y−1 with an overall average value of 3.28 µSv∙y−1 for tap water. Whereas Table 3 showed the results of the ET of the wells waters samples of Nineveh which have the maximum and minimum values as 3.17 to 3.79 µSv∙y−1 with an overall average value of 3.37 µSv∙y−1. In addition, ET was calculated for all samples of wells waters of Adayyah village. The results are showed in Table 4 and it demonstrated that range of ET is 3.02 to 8.04 µSv∙y−1 with an overall average value of 5.11 µSv∙y−1, respectively. Finally, and as in Uranium concentration measurements, the results of ET illustrated that the wells waters have values larger than tap water. However, all ET results are within the internationally permissible limits [22,23].
7. Conclusions
Uranium concentration in all types of waters used for drinking in Nineveh governorate in Iraq is ranged from 2.61 ± 0.08 to 9.14 ± 0.012 µg∙L−1 with an overall average value about 5.87 ± 0.046 µg∙L−1. From these results, one can note increasing Uranium concentration with increasing pH. The values of Uranium concentration in all water samples are more than the recommended value of ICRP (1.9 µg∙L−1) [10], but most of the values are comparable or less to the safe limit of WHO (15 µg∙L−1), EPA (30 µg∙L−1), and for UNSCEAR recommended safe limit (9 µg∙L−1) [9-12].
The results of the daily intake of uranium, Id (μg∙d−1), for all water samples, which used for drinking in Nineveh, are ranged from 5.22 ± 0.034 to 18.28 ± 0.024 μg∙d−1.
The higher total annual effective doses for natural Uranium were found in Adayyah well water, while the total annual effective doses in taps water and water wells of Nineveh are much closer to each other. Annual effective dose for natural uranium in all water samples varied from 2.30 to 8.04 µSv∙y−1 with an overall total average value of 5.17 µSv∙y−1. The estimated radiological impact of 5.17 µSv∙y−1 is only a minor fraction of recommended ICRP annual effective dose of 1 mSv∙y−1 and the global average annual radiation dose of 2.4 mSv∙y−1 to man from all natural radiation sources, and is comparable with global average ingestion dose of 0.18 mSv∙y−1 due to these radionuclides [23].
REFERENCES
- R. B. Khader, “Measure the Background Radiation in Some Parts of Nineveh Province,” Rafidain Journal of Science, Vol. 21, No. 2, 2010, pp. 92-104.
- S. Al-Azzawi, B. Maarouf and N. Mazouri, “Environmental Radiological Pollution from the Use of DU Weaponry against Ninevah Governorate during the Wa,” Proceedings of the Conference on the Effects of the Use of DU Weaponry on Human and Environment in Iraq, Baghdad, 26-27 March 2002.
- A. Al-Tikriti, “Measuring the Concentration of Radioactive Substances in Water and Sediments of the Tigris River Spectroscopy Way to Gamma Rays,” 2002.
- A. H. A. Al-Jubori, “Determination of Depleted Uranium Concentration in the Remains of Military Equipments in a Specified Location from the South of Iraq by Using CR-39 & HPGe Detectors,” M.Sc. Thesis, College of Science, University of Mosul, Mosul, 2003.
- P. Decambox, P. Mauchien and C. Moulin, “Direct and Fast Determination of Uranium in Human Urine Samples by Laser-Induced Time-Resolved Spectrofluorometry,” Applied Spectroscopy, Vol. 45, No. 1, 1991, pp. 116-118. http://dx.doi.org/10.1366/0003702914337768
- Agency for Toxic Substances and Diseases Registry (ASTDR), Atlanta, 1999.
- M. Kumaresan and P. Riyazuddin, “Chemical Speciation of Trace Metals,” Research Journal of Chemistry and Environment, Vol. 3, No. 4, 1999, pp. 59-79.
- UNSCEAR, “Sources and Effects of Ionizing Radiation,” New York, 2000.
- World Health Organization (WHO), “Guidelines for Drinking-Water Quality,” Addendum to Volume 2. Health Criteria and Other Supporting Information, WHO, Geneva, 1998b.
- ICRP (International Commission on Radiological Protection), “Annals of the ICRP,” ICRP Publication 65, Pergamum Press, Oxford, 1993.
- World Health Organization (WHO), “Guidelines for Drinking-Water Quality, Vol. 1,” Recommendations, 3rd Edition, WHO, Geneva, 2006.
- United Nations Sources and Effects of Ionizing Radiation (UNSCEAR), “Report to the General Assembly with Scientific Annexes,” UNSCEAR, New York, 2000, pp. 126- 127.
- Chemchek Instruments, “The KPA Catalogue and Documents,” 2006.
- B. A. Bushaw, “Analytical Spectroscopy,” Proceedings of the 26th Conference on Analytical Chemistry in Energy Technology, W. S. Lyon, Ed., Elsevier, Amsterdam, 1984, pp. 57-62.
- C. K. Liu, R. W. Holloway and J. Akridge, “Radon, Radium and Uranium in Drinking Water,” C. R. Cothern and P. A. Rebers, Eds., Lewis Publishers, Boca Rabon, 1990, p. 165.
- American Society for Testing Materials (ASTM), “USA Annual Book of ASTM Methods,” ASTM, Philadelphia, 1992, pp. 425-427.
- United Nations Sources and Effects of Ionizing Radiation (UNSCEAR), “Report to the General Assembly with Scientific Annexes,” New York, 2000, pp. 126-127.
- International Commission on Radiological Protection (ICRP), “Report of the Task Group on Reference Man,” Pergamon Press, Oxford, 1975.
- M. M. Majali, “Radiation Protection Principles and Applications,” Oman, 2005.
- International Atomic Energy Agency (IAEA), “Management of Reprocessed Uranium Current Status and Future Prospects,” IAEA Publication, Vienna, 2007.
- United Nations Sources and Effects of Ionizing Radiation (UNSCEAR), “Report to the General Assembly with Scientific Annexes,” New York, 2000, pp. 126-127.
- M. E. Wrenn, P. W. Durbin, B. Howard, J. Lipsztein, J. Rundo, E.T. Still and D. L. Willis, “Metabolism of Ingested Uranium and Radium,” Health Physics, Vol. 48, 1985, pp. 601-633. http://dx.doi.org/10.1097/00004032-198505000-00004
- International Commission on Radiological Protection (ICRP), “Recommendations of the International Commission on Radiological Protection,” ICRP Publication, 1990, pp. 1-3.