Journal of Environmental Protection
Vol. 4 No. 7A (2013) , Article ID: 34124 , 9 pages DOI:10.4236/jep.2013.47A004
Research on the Non-Point Pollution Loads in the Lake Uluabat Basin
![]()
Faculty of Engineering-Architecture, Department of Environmental Engineering, Uludag University, Bursa, Turkey.
Email: karaer@uludag.edu.tr
Copyright © 2013 Aslıhan Katip, Feza Karaer. This is an open access article distributed under the Creative Commons Attribution License, which permits unrestricted use, distribution, and reproduction in any medium, provided the original work is properly cited.
Received May 3rd, 2013; revised June 5th, 2013; accepted July 8th, 2013
Keywords: Lake Uluabat Basin; Nitrogen; Non-Point Pollution Loads; Phosphorus; Transport Coefficients
ABSTRACT
Lake Uluabat, having an international significance and subject to the Ramsar Convention, is fed by the basin of Mustafakemalpaşa Stream which runs through fertile lands utilized for livestock breeding and agriculture. In this study, total amount of nitrogen (TN) and phosphorus (TP) loads of non-point pollutants (agriculture, livestock breeding, vegetation, surface runoff and small settlements) was calculated. It was found out that most intensive pollution load stemmed from livestock breeding which causes dispersion of 13653.57 tons·year−1 of TN and 3224.45 tons·year−1 of TP into the Lake Uluabat. Additionally, seasonal changes in concentration of TN and TP were observed during the period of 2008-2009 in Lake Uluabat. It was concluded that the rise of agricultural activities in summer months was the reason underlying the increase in pollution during the months in question.
1. Introduction
As an increasingly common global problem with substantial ecological and socioeconomic consequences; eutrophication can be described as the natural and artificially-induced increase of inorganic nutrients entering aquatic environment, degradation of water quality as a result of excessive accumulation of microscopic plants and algae, reduction of the natural lifetime of the water source and the resulting restriction of water use [1,2]. Nitrogen and phosphorus, which are restrictive nutrients, play a great role in terms of inducing algae growth and biological production in the aquatic ecosystem. Therefore, dispersion of high amounts of nitrogen and phosphorus into water sources give rise to the odds of eutrophication taking place and creates an impact on water quality [3].
Throughout the recent years, anthropogenic nitrogen and phosphorus loads, which pollute water as a result of the global increase of population and industrialization, have increased [2]. Nitrogen and phosphorus enter the aquatic ecosystem through point and non-point sources. If pollution enters a given environment through controllable and quantifiable point discharge, such sources are classified as point sources. And if pollution enters the environment in a non-point manner, then the polluting source is classified as a non-point source [4]. When compared to non-point sources, point sources are 1) more easily controllable, 2) quantifiable and definable and 3) overall more toxic [5]. In the case of non-point sources, 1) it is more difficult to locate pollutants within the source, 2) pollutants are spread over a large area and surface only occasionally, 3) dispersion of pollutants into the water is attributed to the geological/geomorphologic structure of the catchment basin as well as meteorological circumstances and 4) the pollutants in question may cause longterm chronic effects on human health [5]. As it is more difficult to control non-point sources than point sources, they are of higher significance in terms of pollution [6-8]. Pollution caused by non-point sources results from agricultural activities (irrigation, drainage, surface runoff, erosion, use of pesticides and fertilizers); surface runoff that takes place in cities; the construction industry; mining activities and forestry applications; pesticides and fertilizers used in parks, meadows and golf pitches; Salinization of roads; atmospheric sedimentation; livestock breeding activities; and hydrological modification work (examples being dams, water channels, excessive pumping of underground water and siltation) [2,5,9].
In this research, nitrogen and phosphorus loads entering into the Lake Uluabat through the non-point sources (agriculture, livestock breeding, small settlements and the basin’s vegetation) were calculated. These sources are present in the basin of Mustafakemalpaşa (MKP) Stream —the source that feeds the lake and which is situated on the intersection of Orhaneli Stream that has its source located in the town of Çavdarhisar, Kütahya, and Emet Stream that has its source in the district of Gediz. The impact of the pollution load that enters into the lake was also evaluated and precautions to be taken were suggested.
2. Experimental
2.1. Field of Research, Sampling and Analysis
Lake Uluabat is located in Marmara Region in the northwest of Turkey between the coordinates of 40˚10′ north and 28˚35′ east. It has a length of 24 km in the eastwest direction, making up a significant portion of the Susurluk Basin, and 12 km in the north-south direction. It has a height of 9 meters from sea level and average depth of 3 m. The depth decreases to 1.53 m. in arid months and increases to 4.04 m. during periods of precipitation. The surface area of the lake was calculated to be 161 km2 when maintaining maximum water level and 138 km2 at minimum level [10,11].
Lake Uluabat is subject to the RAMSAR Convention or the “Convention on Wetlands of International Importance Particularly as Habitats for Water Birds”, which was concluded in Ramsar, Iran, in 1971, and a member of the Living Lakes network that is run by the GNF (Global Nature Fund). There are numerous settlements, plants, workplaces, agricultural fields and mines within the catchment basin of Lake Uluabat, which is located in Marmara Region—a focus of population and industry. This situation depreciates the lake’s water quality and impacts its trophic level [12,13]. Apart from this, heavy metal pollution has been detected in the lake’s water and sediments in recent researches [14-16], the primary reason of which is thought to be the point discharge resulting from untreated industrial waste water.
The MKP Stream is the most important stream that feeds Lake Uluabat. The flow rate and water quality of this stream varies with climatic conditions. An observation of the monthly changes in the flow rates of MKP Stream between 2008 and 2009 reveals that the highest and lowest levels were measured as 159 m3·s−1 and 5.74 m3·s−1 in the months of March and August respectively [15,17]. The drainage area of Mustafakemalpaşa Stream covers 10,756 km2 and is formed as a result of the intersection of Emet Stream, which lies to the south of the lake, and Orhaneli Stream, which is to the southeast, in the vicinity of Village Çamandar. Within the catchment basin of Mustafakemalpaşa Stream, the districts of Mustafakemalpaşa, Orhaneli, Keles, Büyükorhan and Harmancık in Bursa; Tavşanlı, Emet, Hisarcık, Domaniç and Çavdarhisar in Kütahya; and Dursunbey in Balıkesir are located. The site location map of Lake Uluabat basin is illustrated in Figure 1(a).
The water samples derived from Lake Uluabat in order to find out its water quality were taken on monthly basis for a period of one year between May 2008 and May 2009 at 8 measurement stations on the lake which were chosen by taking into consideration of distance to pollutant sources, variable depth levels and hydrodynamic characteristics [15,17]. Lake Uluabat and sampling stations are illustrated in Figure 1(b). The TN (Total Nitrogen) level was measured using the water vapor distillation method [18] and the TP (Total Phosphorus) level was found out using the ascorbic acid method [19].
2.2. Calculation of Pollution Loads
Transport coefficients derived from the available litera-
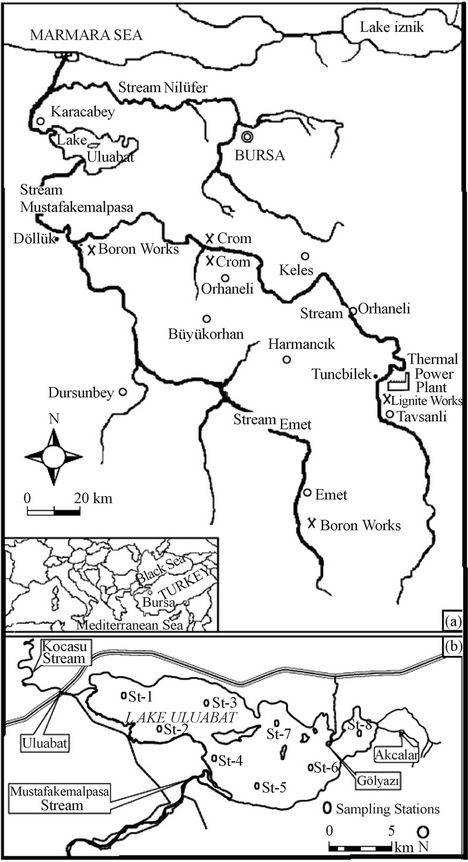
Figure 1. The site location map of Lake Uluabat basin and sampling stations.
ture data were used to calculate the TN and TP pollution loads stemming from non-point pollutants (vegetation, agriculture, livestock breeding and small settlements). Pollution loads attributed to vegetation cover and agriculture were calculated by multiplying the transport coefficients used in previous studies conducted in Marmara region [20] by the land utilization area of the catchment basin of MKP Stream. The land utilization area on the catchment basin of MKP Stream was visualized using satellite views of Landsat-5 as part of the Research on Sediment Accumulation in the Lake Uluabat-MKP Stream System, which is a sub-project of the Project for Management of Wetlands. Land classifications are based on the classification of land maps with a scale of 1/100,000 which was drafted by the Directorate General of Rural Services [21]. TN and TP loads stemming from vegetation and agriculture were given by the Equation (1) below:
(Vegetation and agriculture)
TN and TP loads = Land utilization area * Transport (1)
coefficients The TN and TP loads resulting from small settlements within the catchment basin of MKP Stream with a population below 2000 were calculated by multiplying daily pollution load unit coefficients per person [20,22] by population values [23]. The TN and TP loads stemming from small settlements were given by the Equation (2) below:
(Small settlements)
TN and TP loads = Population * Transport (2)
coefficients Total nitrogen and phosphorus pollution loads resulting from livestock breeding were calculated by multiplying annual pollution load coefficients per animal [24] by the number of animals in the region [25]. The TN and TP loads stemming from small livestock breeding were given by the Equation (3) below:
(Livestock breeding)
TN and TP loads = Number of animals * Pollution (3)
load coefficient per animal The transport coefficients used to calculate total nitrogen and phosphorus loads resulting from vegetation cover, agriculture and small settlements are given on Table 1 and the coefficients used to calculate the total nitrogen and phosphorus loads resulting from livestock breeding are given on Table 2. Mean values of coefficients used for cattle bred to obtain milk and meat were taken in order to determine a pollution coefficient each for nitrogen and phosphorus. These values were used in the calculations. All of the coefficients suitable for Turkey were used.
3. Results and Discussion
The land utilization map of the basin of MKP Stream includes 9 classifications, namely bare land, dry agriculture, weak vegetation cover, irrigated agriculture, waterhumid land, heaths, forest-fields, mixed forests and broadleaf forest. The land utilization map of basin of MKP Stream is given on Figure 2 and the areas as well as their percentages to the total area are found on Table 3. Overall, the land utilization map indicated that a large portion of the basin is utilized for agricultural purposes. The majority of the natural vegetation present in the basin lies within the scope of meadows and the rest comprises forests. There is no settlement of considerable size
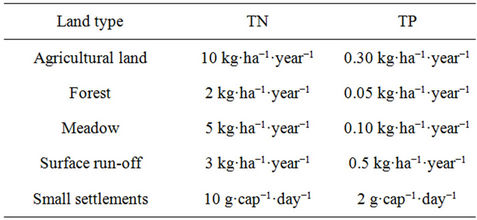
Table 1. Transport coefficients used to calculate total Nitrogen and phosphorus loads resulting from vegetation cover, agriculture and small settlements.
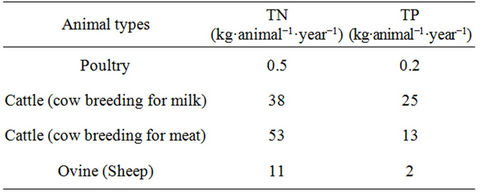
Table 2. Transport coefficients used to calculate total nitrogen and phosphorus loads resulting from livestock breeding.
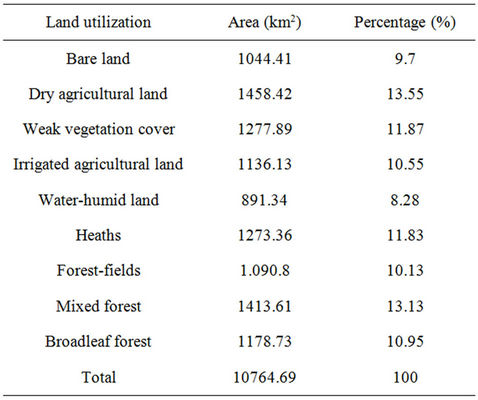
Table 3. Land utilization classifications for the basin of Mustafakemalpaşa stream (Anonymous 2002).
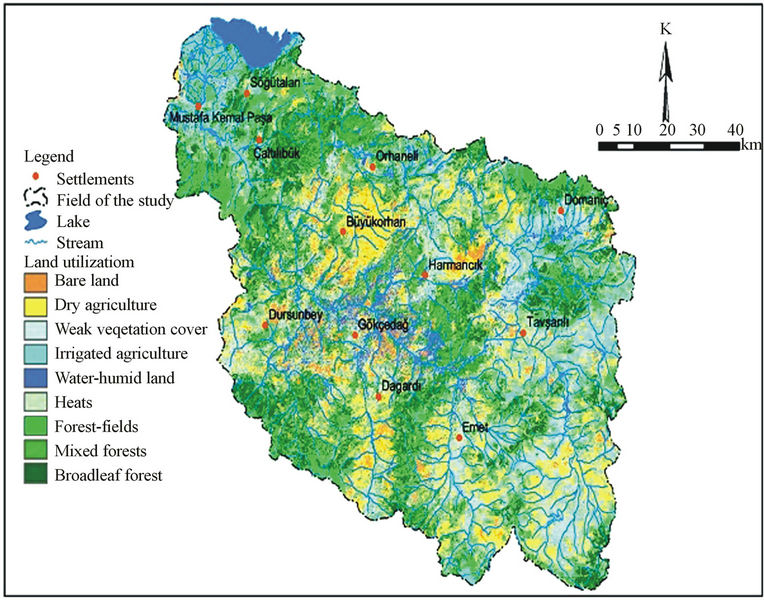
Figure 2. Land utilization areas in the basin of Mustafakemalpaşa stream (Anonymous 2002).
within the basin.
When calculating pollution loads, forests (fields, heaths, mixed) and broad leaf forests were considered as forest areas, dry/irrigated agricultural fields were considered as agricultural land, weak vegetation cover was considered as meadows and bare land was considered as surface runoff site. The TN and TP loads calculated for vegetation cover and agricultural activities are given on Table 4.
Assessment of pollution loads resulting from vegetation cover and agriculture shows that 4538.11 tons of TN and 167.60 tons of TP are transported to MKP Stream annually. It was found out that the highest TN and TP loads stem from agriculture and the lowest TN and TP loads are attributable to surface runoff and meadows respectively.
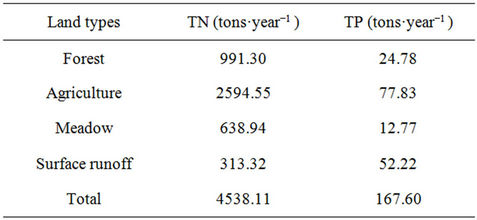
Table 4. TN and TP loads calculated for vegetation cover and agricultural activities.
Assessment of pollution loads resulting from livestock breeding shows that 9019.31 tons of TN and 3037.63 tons of TP are transported to MKP Stream annually. It was found out that the highest TN and TP loads stem from cattle and the lowest loads stem from poultry. The numbers of cattle, poultry and ovine bred in settlements located within the basin of MKP Stream [25] are given in Table 5 and the TN and TP loads resulting from livestock breeding are given in Table 6.
Waste disposed of by farms engaged in livestock production and leakages from stored agricultural products such as silage lead to water pollution. Reasons such as failure to store manure in an appropriate storage house, not burying dead animals in pits with upon pouring lime on the body, lack of properly arranged slaughterhouses or feedstuff storage spaces at the relevant enterprises underlie environmental pollution as well [26].
Piles of manure accumulating in livestock breeding enterprises, which nowadays tend to be concentrated around settlement centers, have become factors threatening environmental health due to lack of sufficient agricultural land to use apply them on, improper storage conditions, the stench and leakages caused and pests and microorganisms like flies, bugs etc. which reproduce in them [26,27]. Therefore, manure storage spaces capable of properly storing the manure output of every enterprise for specific intervals should be planned [27]. Manure storage houses should be positioned so as to minimize
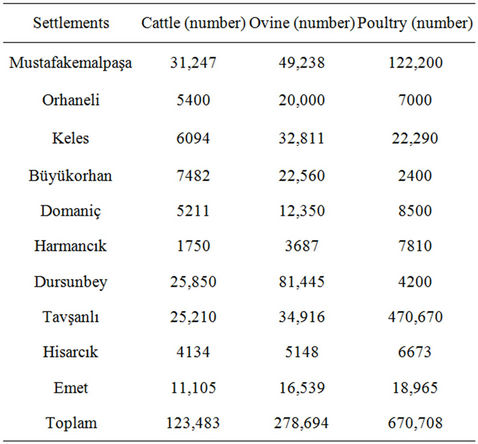
Table 5. Numbers of cattle, poultry and ovine bred in settlements located within the basin of Mustafakemalpaşa Stream.
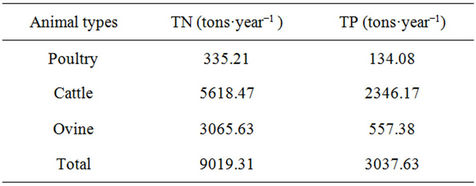
Table 6. TN and TP loads resulting from livestock breeding.
potential pollution of lakes and similar water sources, rivers and underground water. Manure storage houses should be situated at least 30 meters away from water wells and similar structures inside and in the vicinity of the enterprise in question and at least 15 meters from milking units. When determining locations for manure storage houses, allowing facilitated operation of loading and unloading equipment throughout the years should be taken into account [27].
Attention needs to be paid in order to prevent seepage of liquid waste to be disposed of into residences within the enterprise or surface and underground waters, draining and collecting them in underground tanks [28]. When planning construction of manure storage houses, it should be noted that the ground has to be leak-proof and allow removal before causing a polluting impact in case leakage happens [27]. Divisional channels should be built within the projected site of manure storage houses, so as to prevent clean surface water from dispersing into them [26].
Thanks to proper storage and management of waste water generated at livestock breeding enterprises, it can be used as irrigation water for meadows and plants utilized as feed or to meet the need for plant nutrients. The most important point to be noted during the course of application is to use waste water in agricultural production in amounts which is sufficient to meet needs of irrigated plants and will not cause environmental pollution at the same time. Actually, prior to use waste water in agricultural production as irrigation water and to meet the need for plant nutrients, it should be analyzed and a proper application amount must be set [29]. While such an effort might encumber the enterprise with additional costs, use of waste water during irrigation seasons in a planned and proper manner will decrease the irrigation water and fertilizer costs of the enterprise and make up for this additional initial cost [30].
In addition to countless pathogens and microorganisms, waste water discharged into the lake from settlements contains elements which support intensive growth of algae and cause indications of pollution in water, such as excessive amounts of organic matter, nitrogen, phosphorus, silicium and potassium. Furthermore, excessive amounts of salt, soap and detergents are also dispersed into the lake’s water in the same way [31,32]. TN and TP loads caused by small settlements located within the basin of Lake Uluabat with a population count below 2000 have been measured to be 96.151 tons·year−1 and 19.22 tons·year−1 respectively. The highest and lowest TN loads, 6.61 tons·year−1 and 0.56 tons·year−1, were found to be resulting from Günlüce and Gölkıyı respectively. Similar to the TN loads, the highest and lowest loads of TP were also found to be stemming from Günlüce (1.32 tons·year−1) and Gölkıyı (0.11 tons·year−1) respectively.
Natural treatment systems (constructed wetlands) play an important role in management of waste water and control of water population in small settlements in many nations around the world [33]. Natural treatment systems have started to be used widely in our nation as well. There are natural treatment facilities in place in some villages located in the provinces of Konya, Samsun, Tokat and Bursa [34,35]. They have actually been used for more than 6 years in the villages of Eskikaraağaç and Yenikaraağaç in particular, which are situated in the vicinity of Lake Uluabat. Establishing this system in other villages without the required infrastructures and keeping track of their purification efficiency rates are bound to make substantial contributions in terms of preventing pollution of surface waters. When calculating the load values for individual settlements, the villages of Eskikaraağaç and Yenikaraağaç were not taken into account due to their having natural treatment systems in place. The TN and TP loads of settlements located within the basin of MKP Stream and around Lake Uluabat with a population below 2000 are given in Table 7.
Considering the entirety of nonpoint sources of pollution, it was found out that the highest pollution loads
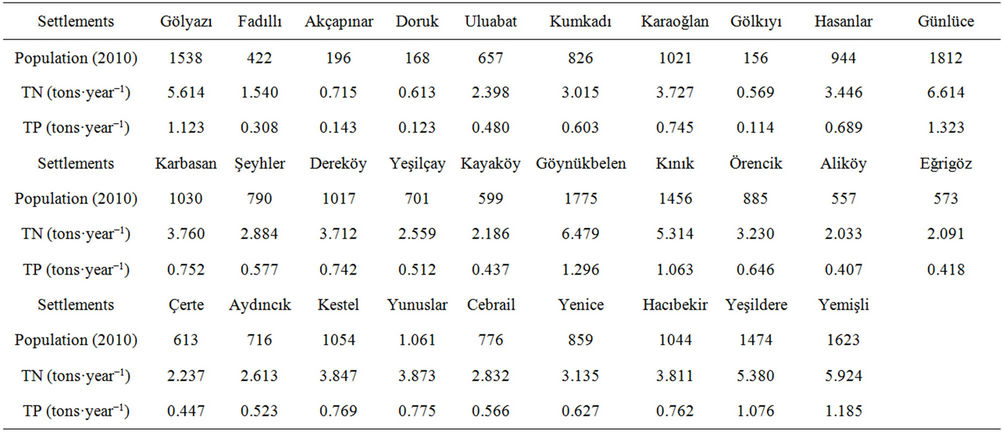
Table 7. TN and TP loads of settlements located within the basin of MKP stream and around Lake Uluabat with a population below 2000.
stem from livestock breeding, while the lowest pollution loads for TN and TP stemmed respectively from small settlements and meadows, with a total of 13653.57 tons·year−1 of TN and 3224.45 tons·year−1 of TP dispersing from nonpoint sources of pollution into Lake Uluabat. Changes in TN and TP loads of the basin of Lake Uluabat are indicated in Figure 3 with a breakdown of the respective sources of pollution.
Agricultural and livestock breeding activities within the basin of Lake Uluabat were assessed in accordance with the agro-ecological zoning of the province of Bursa. Agro-ecological zoning means categorization of areas into sub-categories together with others with similar environmental features, potential yield and convenience for utilization. These agro-ecological areas are laid out in
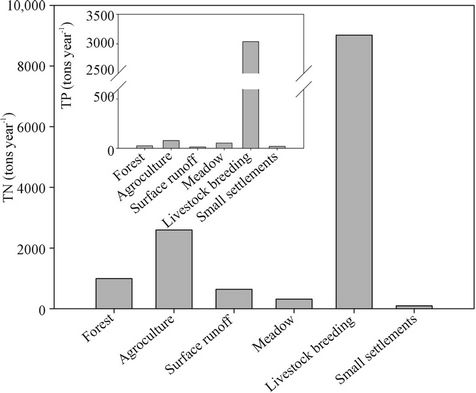
Figure 3. Changes in TN and TP loads in accordance with sources of pollution.
accordance with climatic conditions, land form, soil structure, land cover and socioeconomic composition [36,37]. In the Master Plan of Agriculture for Bursa, the province is taken into consideration in 4 agro-ecological areas [36]. The 1st sub-region comprises the districts of Osmangazi, Yıldırım, Yenişehir, İnegöl, Kestel and Gürsu; the 2nd comprises Nilüfer, Karacabey and Mustafakemalpaşa; the 3rd comprises Mudanya, Orhangazi, Gemlik and İznik; and the 4th comprises Keles, Orhaneli, Büyükorhan and Harmancık. The basin of Lake Uluabat covers the districts which lie within the scope of subregions number 2 and 4.
Considering the agricultural and livestock breeding activities carried out in the sub-regions of Bursa, there are 257 agricultural pesticide dealers in total operating in the province. In 2003, the total amount of pesticides used all around the province was 884 tons. As of 2001, the regions which received the most intensive pesticide support in Bursa were the 3rd, 1st and 2nd sub-regions respectively. In 2004, the total amount of fertilizers used in the province of Bursa was approximately 107,000 tons, which corresponds to 1.05% of the total consumption in Turkey (10 million and 152 thousand tons). According to the records kept by the provincial directorate of agriculture, the highest amount of fertilizers was used in the 2nd subregion. The agricultural production of the 2nd sub-region focuses mainly on vegetables and fruits cultivated for exporting purposes [36].
Overall, 2.9% of all cattle in Turkey, 1% of sheep, 1% of goats and 0.7% of poultry are found in the province of Bursa. The highest number of poultry is maintained in the 1st and 2nd sub-regions. Broiler chickens are bred in the Mustafakemalpaşa district of the 2nd sub-region. Especially in the 1st and 2nd sub-regions of Bursa, livestock breeding is concentrated primarily around dairy farming [36]. As can be understood, the portion of the basin of Lake Uluabat which lies within the borders of Bursa is one of the regions where agricultural and livestock breeding activities are most intensive.
Ground rents in Bursa are quite high due to the rapid development of tourism, industry and urbanization. Agricultural land is changing hands for non-agricultural use in the 1st and 2nd sub-regions, where industrialization is immense [36]. According to data of 1995, a considerable portion of the agricultural land has indeed been used for non-agricultural purposes due to mistakes made in the past [38,39]. Appropriate sites can be selected by paying attention to the balance of conservation and utilization, while environmental problems can be prevented in advance even before they occur by making strategic decisions on land utilization. Therefore, Environmental Plans with scales of 1/25,000, 1/50,000 and 1/100,000 should be drafted to outline land utilization decisions and policies for agricultural, tourism, residential, industrial and transportation etc. purposes, attributing specific roles to every specific region in accordance with their respective potentials [39].
Natural and synthetic fertilizers applied to enhance fertility of soil and agricultural pesticides cause pollution of water sources [39]. The amounts of pesticide used, timing and methods of application are quite important in terms of giving rise to the problem of pesticide pollution. The primary precautions to be taken in order to prevent pesticide-induced pollution include use of pesticide only when it is strictly necessary, applying them on time and in required amounts as outlined in instructions of use, practicing integrated methods of prevention like using them only on the specific targeted area and avoiding irrigation following application of pesticides [40,41]. It is of essence to be careful when using these pesticides, which might leave behind residues and pollute the environment and keep track of their consequences [39].
Another type of pollution resulting from agricultural activities occurs due to use of chemical fertilizers containing nitrogen and phosphate. The amount of fertilizer to be applied on soil should be restricted as instructed in the Regulation on Good Agricultural Practices [42]. Furthermore, soil erosion can be prevented to a significant extent by using natural plant nutrients [43,44].
The geological structure, vegetation cover and dimensions of the drainage basin as well as the human activities present directly impact water quality [45,46]. It is important to determine the characteristics of the basin in order to evaluate water quality in lakes. This is why the seasonal changes in the TN and TP parameters in Lake Uluabat were examined following analysis of the load of non-point pollutants within the basin-nitrogen and phosphorus. Concentrations were analyzed by taking into consideration the mean value of 8 stations established on the lake. The highest TN concentrations were observed in summer (19.87 mg·L−1) and the lowest in winter (4.84 mg·L−1). The values measured in autumn and spring were 7.06 mg·L−1 and 4.98 mg·L−1 respectively. Whereas the increased temperature and evaporation increase concentration rates in summer, there is a declining tendency in winter because of the precipitation and resulting surface runoff within the basin [47,48]. The maximum TP concentration values were measured in summer (0.275 mg·L−1) and minimum in spring (0.088 mg·L−1). This can be attributed to the increase in algae population because of increased photosynthesis and consumption of phosphorus [49,50]. The TP concentrations were measured to be 0.089 mg·L−1 and 0.262 mg·L−1 in winter and autumn respectively. The seasonal variations in TN and TP concentrations in Lake Uluabat are shown in Figure 4.
As plant growth is faster in spring and summer months, the use of fertilizers and pesticides increases in those months and decreases in winter and autumn months. It is difficult to make a precise definition of the growth season. In the simplest sense, growth season is described as the period between the time when the minimum temperature required for plant growth and development is attained and the time the development in question is finalized [51]. Another reason why the TN and TP concentrations in Lake Uluabat are high in summer months is thought to be due to the increased use of fertilizers and pesticides in those months. To ensure high yield and quality in agricultural produces, fertilizers containing nitrogen and phosphorus are used. Fertilizers are used during the growth season of plants [52].
4. Conclusion
In this study, the non-point pollutants of the basin of Lake Uluabat were examined and it was found out that while the highest TN and TP loads stemmed from livestock breeding in the basin’s area that lies within the
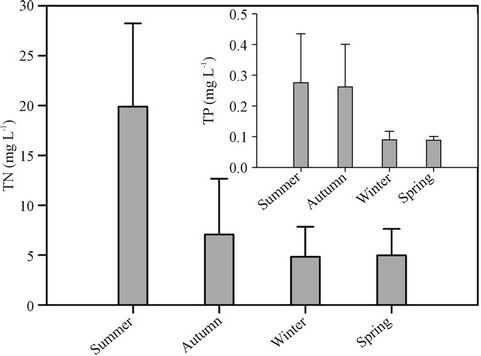
Figure 4. Seasonal variations in TN and TP concentrations in Lake Uluabat.
borders of the Bursa province. It was also found out that the increase in pollution observed in the lake in summer months was induced by agricultural activities.
5. Acknowledgements
The project was funded by the Environment, Atmosphere, Earth and Marine Sciences group (ÇAYDAG) (Project No: 107Y278) of the Scientific and Technical Research Council of Turkey (TÜBİTAK) and Scientific Research Foundation (Project No: M-2007/27) of Uludag University.
REFERENCES
- F. D. Özecik, “Investigation of Eutrophication in Lake Sapanca,” Master of Science Thesis, Gebze Institute of Technology, Institute of Engineering, and Science, Gebze, 2006.
- J. He, R. Balasubramanian, D. F. Burger, K. Hicks, J. C. I. Kuylenstierna and S. Palani, “Dry and Wet Atmospheric Deposition of Nitrogen and Phosphorus in Singapore,” Atmospheric Environment, Vol. 45, No. 16, 2011, pp. 2760-2768. doi:10.1016/j.atmosenv.2011.02.036
- P. J. Worsfold, P. Monbet, A. D. Tappin, M. F. Fitzsimons, D. A. Stiles and I. D. McKelvie, “Characterisation and Quantification of Organic Phosphorus and Organic Nitrogen Components in Aquatic Systems: A Review,” Analytica Chimica Acta, Vol. 624, No. 1, 2008, pp. 37-58. doi:10.1016/j.aca.2008.06.016
- D. Orhon, S. Sözen, B. Üstün, E. Görgün and Ö. Karahan-Gül, “Preliminary Report on Water Management and Sustainable Development,” Vizyon 2023, İstanbul, 2002.
- K. Loague and D. Corwin, “Point and Non-Point Source Pollution in Encyclopedia of Hydrological Sciences,” John Wiley & Sons, Ltd., 2005, pp. 1427-1439.
- J. A. Camargo and Á. Alonso, “Ecological and Toxicological Effects of Inorganic Nitrogen Pollution in Aquatic Ecosystems: A Global Assessment,” Environment International, Vol. 32, No. 6, 2006, pp. 831-849. doi:10.1016/j.envint.2006.05.002
- R. W. Howarth, D. Anderson, J. Cloern, C. Elfring, C. Hopkinson and B. Lapointe, “Nutrient Pollution of Coastal Rivers, Bays, and Seas,” Issues in Ecology, Vol. 7, No. 1, 2000, pp. 1-15.
- Anonymous, “Clean Coastal Waters: Under Standing and Reducing the Effects of Nutrient Pollution,” National Research Council, National Academic Press, Washington DC, 2000.
- B. M. Dowd, D. Press and M. L. Huertos, “Agricultural Nonpoint Source Water Pollution Policy: The Case of California’s Central Coast,” Agriculture, Ecosystems and Environment, Vol. 128, No. 3, 2008, pp. 151-161. doi:10.1016/j.agee.2008.05.014
- A. Katip, “Water Quality Monitoring of Lake Uluabat,” PhD Thesis, Uludag University, Institute of Science, Bursa, 2010.
- S. İleri, “The Assessment of Physico-Chemical Parameters and Geographic Information System Analysis of Water and Sediment Quality of Lake Uluabat in Terms of Environment,” MSc Thesis, Uludag University, Institute of Science, Bursa, 2010.
- S. Akdeniz, F. Karaer, A. Katip and E. Aksoy, “A GISBased Method for Shallow lake Eutrophication Assessment,” Journal of Biological & Environmental Sciences, Vol. 5, No. 15, 2011, pp. 195-202.
- A. Katip and F. Karaer, “Assessment of Water Quality of Uluabat Lake in Accordance with Turkish Legislation and International Criteria,” Uludag University Journal of the Faculty of Engineering and Architecture, Vol. 16, No. 1, 2011, pp. 25-34.
- A. Elmacı, A. Teksoy, F. O. Topaç, N. Özengin, S. Kurtoğlu and H. S. Başkaya, “Assessment of Heavy Metals in Lake Uluabat, Turkey,” African Journal of Biotechnology, Vol. 6, No. 19, 2007, pp. 2236-2244.
- A. Katip, F. Karaer, H. S. Başkaya, S. İleri and S. Sarma- şık, “Fraction Distribution and Risk Assessment of Heavy Metals and Trace Elements in Sediments of Lake Uluabat,” Environmental Monitoring and Assessment, Vol. 184, No. 9, 2012, pp. 5399-5413. doi:10.1007/s10661-011-2348-4
- A. Katip, F. Karaer, S. İleri, S. Sarmaşık, N. Aydoğan and S. Zenginay, “Analysis and Assessment of Trace Elements Pollution in Sediments of Lake Uluabat, Turkey,” Journal of Environmental Biology, Vol. 33, No. 5, 2012, pp. 961-968.
- Anonymous, “Modeling and Ecological Effects of Heavy Metals and Trace Element Pollution in Shallow Lakes,” Scientific Research Foundation Project of Uludag University (Project No: M-2007/27), Bursa, 2007-2010.
- J. M. Bremner and C. S. Mulvaney, “Methods of Soil Analysis,” American Society of Agronomy, Inc., Publisher, Madison, 1982.
- APHA, AWWA, “Standart Methods for the Examination of Water and Wastewater,” 20th Edition, American Public Health Association, Washington, 1998.
- F. Karaer and A. Küçükballi, “Monitoring of Water Quality and Assessment of Organic Pollution Load in the Nilüfer Stream, Turkey,” Environmental Monitoring and Assessment, Vol. 114, No. 1-3, 2006, pp. 391-417. doi:10.1007/s10661-006-5029-y
- Anonymous, “Wetland Management Project Uluabat Lake Mustafakemalpasa Stream Sediment Accumulation System Research Sub-Project Final Report,” Republic of Turkey, Ministry of Environment, Sensitive Ecosystems and Protected Areas General Directorate of Environmental Protection and Hacettepe University, Department of International Research and Application Center for Karstic Water Resources, Beytepe-Ankara, 2002.
- A. Tanık, B. Baykal and E. Gönenç, “The Impact of Agricultural Pollutants in Six Drinking Water Reservoirs,” Water Science and Technology, Vol. 40, No. 1, 1999, pp. 11-17.
- Anonymous, “Turkey Statistical Institute, Population Statistics and Projections,” 2010. http://www.turkstat.gov.tr/Start.do
- K. Güneş, “Point and Nonpoint Sources of Nutrients to Lakes-Ecotechnological Measures and Mitigation Methodologies: Case Study,” Ecological Engineering, Vol. 34, No. 2, 2008, pp. 116-126. doi:10.1016/j.ecoleng.2008.07.004
- Anonymous, “Turkey Statistical Institute, Animal Production Statistics,” 2010. http://www.turkstat.gov.tr/Start.do
- S. Karaman, “Environmental Problems in Animal Production and Possible Solutions,” KSU Journal of Science and Engineering, Vol. 9, 2006, pp. 133-139.
- A. Mutlu, “Research on Environmental pollution Caused by Animal Facility near Adana Province,” M.Sc. Thesis, Çukurova University, Institute of Science, Department of Agricultural Structures and Irrigation, Adana, 1999.
- J. P. Harner, J. P. Murphy and V. David, “Manure Stroge Structures for Kansas Dairies,” Proceeding of the 5th International Symposium, Bloomington, 29-31 May 1997, pp. 730-736.
- J. C. Barker, “Lagoon Design and Management for Livestock Waste Treatment and Storage,” North Carolina State University Cooperative Extension Service Publications, Raleigh, 1996.
- R. E. Hermanson and E. L. “Thomason, Managing Livestock Manure to Protect Groundwater,” Washington State University Cooperative Extension Service, Extension Bulletin Pullman, Washington, 1992.
- Y. Nuhoglu and T. Öymen, “Examination of Relationship between Water Resources and Fish Populations in EASTERN Black Sea region,” Ekoloji, Vol. 6, No. 1, 1993, pp. 28-33.
- U. Alkan, S. Çalışkan and Ü. Mescioğlu, “The Level of Microbiological Pollution in Uluabat Lake,” Ekoloji, Vol. 33, No. 1, 1999, pp. 3-5.
- Anonim, “Manual, Constructed Wetlands Treatment of Municipal Wastewaters,” National Risk Management Research Laboratory (USEPA), EPA/625/R-99/010, Cincinnati, 2000.
- S. Saraçoğlu, “Treatment of Domestic Wastewaters of Eskikaraağaç Village With Subsurface Flow Constracted Wetland,” Master of Science Thesis, Uludag University, Institute of Science, Bursa, 2006.
- Ö. Sivrioğlu, “Investigation of Nitrogen and Phosphorus Removal in Constructed Wetlands and Other Methods,” Master of Science Thesis, Uludag University, Institute of Science, Bursa, 2010.
- Anonymous, “Bursa Agriculture Master Plan,” Ministry of Agriculture and Rural Affairs Bursa Provincial Directorate of Agriculture, Bursa, 2005.
- Anonymous, “Provincial Agriculture and Rural Development Support Project in Ankara Agricultural Master Plan,” Ministry of Agriculture and Rural Affairs, Ankara Provincial Directorate of Agriculture, Ankara, 2006.
- C. Cangir, “Non-Objective Land Use in Agricultural Soils,” Turkey Agricultural Engineering, the Fourth Technical Congress. Union of Chambers of Turkish Engineers and Architects, Chamber of Agricultural Engineers, Ankara, 1995.
- S. Özgür, “Research on the Pollution Loads of Marmara Sea Basin,” Master of Science Thesis, Gebze Institute of Technology, Institute of Engineering, and Science, Gebze, 2006.
- E. Olhan and Y. Ataseven, “Laws and Regulations Concerning to Pollution Originating Agricultural Activities in Drinking Water Basin Areas in Turkey,” Journal of Tekirdag Agricultural Faculty, Vol. 6, No. 2, 2009, pp. 161-169.
- K. K. Tanji, “Pollution Prevention in Natural Resources Management with a Focus on Nitrates and Pesticides in Agricultural Production Systems,” Proceedings of Global Pollution Prevention—USEPA, Washington DC, 3-5 April 1991, pp. 271-288.
- K. Ekmekçi, A. İ. Acar, Y. B. Yurtlu and M. Hasdemir, “Evaluation of the Good Agricultural Practices in Relation to Agricultural Mechanization,” Selçuk Journal of Agriculture and Food Sciences, Vol. 26, 2012, pp. 97- 103.
- F. Karaer, “Relationship of Ecological Agriculture and Environmental Pollution in Ecological/Organic Farming and the Environment,” Ecological Life Association Publications, Bursa, 2008, pp. 27-39.
- E. Rehber, “Economics of Organic Farming,” Ekin Publisher, Bursa, 2011.
- D. W. Clow and J. K. Sueker, “Relations between Basin Characteristics and Stream Water Chemistry in Alpine/Subalpine Basins in Rocky Mountain National Park, Colorado,” Water Resources Research, Vol. 36, No. 1, 2000, pp. 49-61. doi:10.1029/1999WR900294
- H. B. Pionke, W. J. Gburek and A. N. Sharpley, “Critical Source Area Controls on Water Quality in an Agricultural Watershed Located in the Chesapeake Basin,” Ecological Engineering, Vol. 14, No. 4, 2000, pp. 325-335. doi:10.1016/S0925-8574(99)00059-2
- C. G. Radhika, J. Mini and T. Gangaderr, “Studies on Abiotic Parameters of a Tropical Fresh Water Lake—Vellayani Lake, Thiruvanthapuram District, Kerala,” Pollution Research, Vol. 23, No. 1, 2004, pp. 49-63.
- A. Singh, P. C. Srivastava and P. Srivastava, “Relationships of Heavy Metals in Natural Lake Waters with Physico-Chemical Characteristics of Waters and Different Chemical Fractions of Metals in Sediments,” Water Air Soil Pollution, Vol. 188, No. 1-4, 2008, pp. 181-193. doi:10.1007/s11270-007-9534-6
- C. F. Cerco and S. P. Seitzinger, “Measured and Modeled Effects of Benthic Algae on Eutrophication in Indian River-Rehoboth Bay, Delaware,” Estuaries, Vol. 20, No. 1, 1997, pp. 231-248. doi:10.2307/1352733
- O. Buhvestova, K. Kangur, M. Haldna and T. Möls, “Nitrogen and Phosphorus in Estonian Rivers Discharging into Lake Peipsi: Estimation of Loads and Seasonal and Spatial Distribution of Concentrations,” Estonian Journal of Ecology, Vol. 62, No. 2, 2011, pp. 18-38. doi:10.3176/eco.2011.1.03
- E. Açıkgöz, “Relationship between Climate Factors and Agricultural Production,” In: E. Açıkgöz and S. Arcak, Eds., Ecology and Environmental Science, TC Anadolu University Press, Eskişehir, 2012, pp. 108-127.
- Y. Işık, N. Göksu, O. Okur, T. Atçeken and C. Alptürk, “Nitrogen and Phosphorus Fertilizer Request of Wheat in Konya Region,” Journal of Plant Research, Vol. 2, No. 1, 2010, pp. 17-24.