Journal of Environmental Protection
Vol. 4 No. 4A (2013) , Article ID: 30810 , 7 pages DOI:10.4236/jep.2013.44A004
Agricultural Soil and Water Quality Assessment and CO2 Storage on Wetland Reserve
![]()
Agricultural Engineering Research Unit, Rome, Italy.
Email: pieranna.servadio@entecra.it, simone.bergonzoli@entecra.it
Copyright © 2013 Pieranna Servadio, Simone Bergonzoli. This is an open access article distributed under the Creative Commons Attribution License, which permits unrestricted use, distribution, and reproduction in any medium, provided the original work is properly cited.
Received February 15th, 2013; revised March 17th, 2013; accepted April 18th, 2013
Keywords: Soil; Water; Wetlands; Organic Agriculture; Conventional Agriculture
ABSTRACT
In this paper, investigations on agricultural and forestry soil and on water quality assessment were carried out in a natural wetlands reserve, at valley of a mountain, near at the sea and under hydraulic risk (the coast of the Etruschis), in central Italy; Physical-chemical parameters were measured by taking samples of soil on two fields cultivated with an artichoke bed and respectively managed with organic and conventional techniques adjacent the natural wetlands reserve and destined to a controlled development of the agriculture, to protect the reserve. These parameters were also measured on forestry soil inside the reserve and CO2 storage on soil was evaluated. The water chemical analysis of the two ponds inside the reserve was also carried out. The soil managed with organic farming has showed higher chemical fertility. Both organic and conventional field showed high level of soil compaction susceptibility evidenced by high values of penetration resistance and shear strength; while porosity and hydraulic conductivity presented low values. The research highlights that the ecological land use can influence and improve the environmental quality. In fact thanks to the higher organic matter content into the soil, the average values of stored CO2 show that the organic (∆COT = 1200 kg·ha–1) and forestry (∆CFT = 2200 kg·ha–1·year–1) treatments have stored higher amount of organic carbon in the soil with respect to the conventional one. Organic matter and dry bulk density can be considered good indicators of the soil quality. The results of the water chemical analysis show a good quality of the brackish water of the ponds situated in the wetlands reserve.
1. Introduction
Soil contains three quarters to four fifths of the terrestrial organic carbon mass, almost three times the amount of carbon in the atmosphere. Due to its size, small changes in the soil carbon mass can have large effects on atmospheric C concentration and hence on global warming. Previous models have not included wetlands and did not account for the thawing of permafrost soils which both have huge C masses. In addition, previous models did not include effects of land use change [1].
Natural ecosystems have been severely destroyed because of anthropic disturbance, unreasonable utilization and neglect of protection and restoration. These disturbed or degraded ecosystems are confronted with poor soil fertility, shortage of water and deteriorated micro-environment, which would severely restrict the development of farm production, and furthermore, would affect the quality of living space of local citizens [2]. The degradation and loss of wetlands all over the world, has made the restoration of wetlands a top priority [3]. Restoration of habitat can include rectifying an impact by repairing, rehabilitating or restoring the affected environment [4]. It aims to ensure that further loss of habitat does not occur and/or that severely degraded patches of habitat are returned to a more natural and functional state. Restoration of degraded habitats is particularly important for marine and estuarine ecosystems, especially in urban environments [5]. Some of the last remaining semi-natural areas around many coastal cities are patches of coastal habitats. Nevertheless, there has been substantial loss of wetlands because of destruction from filling and dredging for agriculture and urban development [6-8]. Urban wetlands, although subjected to many disturbances, still provide many functions which make their restoration important. These include provision of habitat for fish and wildlife species [9,10] and recreational, educational and aesthetic values [11] which are particularly important given that little natural habitat is available in cities. The objectives of this study were to investigate on agricultural and forestry soils properties and water of two ponds to assess and evaluate the effects of different systems of land use on physical—chemical properties and CO2 storage capacity in a natural wetlands reserve, at valley of a mountain, near at the sea and under hydraulic risk (the coast of the Etruschis).
The tests were carried sampling and mapping fields and ponds to found some soil physical quality indicators, to assess the correct use of the soil and the water quality.
2. Matherials and Methods
2.1. Soil and Treatments
The study was conducted in a Natural Reserve of Central Italy (178 m.a.s.l.), (42˚0'8309" N; 11˚58'57133" E) on two adjacent fields: agricultural soils (zone B); forestry soil (populated by Luarus spp. and Ulmus spp.) and on two small ponds (zone A) (Figure 1).
Soil moisture balance highlights an annual water deficiency with a potential evapotranspiration of last ten years (mm 820) higher than the rainfall (mm 660). The area is drought four months per year, exactly from May to the end of August. Soil remains dry more than 90 cumulative days per year, so it belongs to the ustic-xeric soil moisture regime.
Considering that mean annual soil temperature is 17˚C and that mean summer and winter soil temperatures differ for more than 5˚C, soil temperature regime is defined thermic. Natural Reserve is a coastal area evolved on sandy materials deriving from fluvial and marine deposits. This is a deep soil with a trunk profile; characterized by a deep clay-illuvial horizon with Iron-Manganese nodules. Erosive and alluvial events determined huge soil variability. In fact area of Tolfa Mountains, just above the Reserve, is geologically constituted by a volcanicpliocenic coat interested by a hydrothermal alteration due to volcanic activity and to a deep igneous activity that promoted the formation of sulphides, kaolinite and alu-
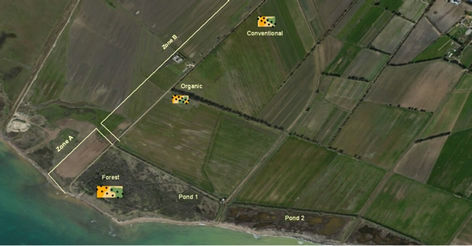
Figure 1. View of the tests site: Zone A: forestry soil, ponds 1 and 2; Zone B: agricultural soils, conventional and organic treatments.
nite deposits. Crops show problems in absorbing nutrients when into the soil there are sulphides, phosphate hydrates, silicates of iron and kaolinite and even more in sandy soils.
Field tests were carried out on two agricultural soils inside the zone B, on a forestry soil and on two small ponds inside the zone A. Agricultural soils were seeded with artichoke (Cynara scolimus) three years before the tests but one was an organic field (OT) while the other was a conventional one (CT). Organic field was ploughed at 0.3 m depth, conventional fields was ploughed at 0.4 m depth before seeding and harrowed at 0.20 m depth each year.
2.2. Sampling Test and Mapping
In order to assess the soil quality, in June 2011, on the two agricultural fields and on the adjacent forestry soil, physical and mechanical properties were measured using a grid sampling from 0 to 0.20 m depth. GPS position of each sample was taken (Figure 1) to produce interpolated maps using software ArcGIS and the spatial analyst tool IDW [3,12,13], to describe spatial variability of these soil properties. Detected soil parameters were: cone index (CI), shear strength (SS), dry bulk density (BD), water content (WC), total porosity (P), saturated hydraulic conductivity (Shc), and some others chemical parameters: organic matter content (OM), pH, electrical conductivity, total limestone, cation exchange capacity, total nitrogen, available phosphorous and colloids index. Water samples were also taken from two small ponds (1 and 2) and chemical analyses were performed.
2.2.1. Soil Physical Mechanical Measurements
In the two agricultural fields the following physicalmechanical parameters of the soil, from 0 to 0.20 m depth, were investigated. Penetration resistance was determined as a cone index (CI), according to the ASAE standard using a self-recording electronic penetrometer (Eijkelkamp penetrologger) with a 60˚ cone and base area of 100 mm2, driven into the soil at a constant rate (5 cm·s–1). In each field, ten penetrometer readings were taken in increments of 1 cm to a depth of 0.20 m. The average of the measured values from soil surface to 0.20 m depth was used to develop a correlation with soil water content. Soil shear strength was measured using a field inspection vane tester from 0 to 260 kPa (Eijkelkamp). In each field ten shear strength readings were taken in increments of 0.05 m to a depth of 0.20 m.
Dry bulk density was measured by taking ten samples of soil using a corer sampling ring of 100 cm3 of volume at 0 - 0.20 m depth. These samples were weighed and dried until they reached a constant weight.
Total porosity was calculated from bulk density and particles density, from soil samples. In fact, ten samples (cores) were collected in the surface layer (0 - 0.20 m) of the two fields.
Saturated hydraulic conductivity was measured using the constant pressure method. For each plot, 10 measures were taken on topsoil (at depths of 0 to 0.20 m depth).
2.2.2. CO2 Stored in the Soil
Determination of saving of CO2 emissions owing to immobilization in the soil was carried out from the analysis of soil organic carbon content and dry bulk density. Soil organic carbon content in each field (in the layer 0 - 0.20 m) was found using the formula reported by Borin et al., 1997 [14]:
 (2)
(2)
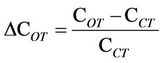
where C is soil organic carbon content (Mg·ha–1);  is soil organic carbon content (g·hg–1), BD is dry bulk density (Mg·m–3), d is depth (m) of samples that for all treatments was 0.20 m. The difference in the average of carbon content in the 0 - 0.20 m layer in FT and OT compared with CT was then found.
 (3)
(3)
 (4)
(4)
where ∆COT, FT is the yearly average increase of carbon content in the 0 - 0.20 m soil layer in OT and FT with respect to CT (kg·ha–1·year–1).
Lastly, the stored CO2 into the soil was calculated:
 (5)
(5)
where 44 and 12 are the molecular weight of CO2 and C, respectively.
2.2.3. Soil Chemical Parameters
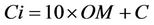
In each field, ten soil samples were collected, from 0 to 0.20 m depth, and the following chemical properties of the soil were determined by standard methods as reported by Beni, Servadio et al., 2012 [15]. Soil pH using a glass electrode (2.5:1 water/soil ratio suspension); particle-size distribution with the sedimentation procedure; available copper (Cu) by diethylenetriaminepentaacetic acid (DTPA); available phosphate (P2O5) with the Olsen method [30 min extraction with 0.5 M sodium bicarbonate (NaHCO3) pH = 8.5, soil/solution ratio 1:20]; cation exchange capacity (CEC) by the barium chloride (BaCl2)-triethanolamine (TEA) method; exchangeable bases [sodium (Na), potassium (K), magnesium (Mg), calcium (Ca)] with 1 M ammonium acetate (NH4OAc) solution (soil/solution ratio 1:10, shaking time 30 min); total soil N by the Kjeldahl method; total organic C with the wet oxidation; organic-matter content derived from the total organic C × 1.72. The physical and mechanical behavior of the soil was described by studying laboratory and field conditions. Colloid index (Ci), a parameter used to evaluate colloid behavior, was calculated as follows:
 (6)
(6)
where OM is organic-matter content (%) and C is clay content (%).
2.3. Statistical Methods
Statistical analyses of differences between treatments were made with analysis of variance by means of the student’s test conducted, at the same depth of sample, between the three treatments. In tables and in figures, mean results are flanked on the same line by letters. Each two means which share a letter do not differ significantly, level of significance £0.01.
3. Results
3.1. Soil Physical Mechanical Parameters
Mean values of soil physical-mechanical parameters, 0 - 0.20 m depth, and evaluation of saved CO2 into the soil (0 - 0.20 m depth) for different treatments are shown in Table 1.
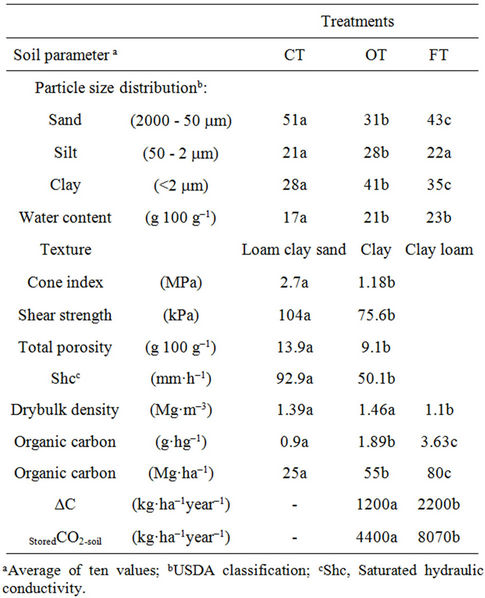
Table 1. Mean values of soil physical-mechanical parameters, and evaluation of soil CO2 stored (0 - 0.20 m depth) forthe three different treatments.
Table 1 shows different type of soil texture between the three treatments: loam clay sand (CT), clay (OT) clay loam (FT). These differences in soil texture between treatments, even if they are very close, and particularly the presence of clay into organic treatments, and into forestry inside to the Zone A, closer to the sea, can be explained by last geologic events and sea level rising and lowering due formation and retreats of glaciers.
During retreats of glaciers large areas of Lazio and Tuscany emerged from the sea with deep layers of clay and sand accumulated into the sea over geological eras. Particularly on the headland of the Natural Reserve, where marine erosion is high, is possible to identify clay layers, well endowed of organic matter, originated from ancient coastal ponds of past geological eras. Destruction of sandy dunes that protected coastal pond from the sea and land reclamation definitively destroyed this coastal environment [16].
Analysis of the results (Table 1) highlighted values of soil water content statistically different between CT, OT and FT treatments. This difference can be explained by soil texture, and by the aquifer that is more superficial because OT is closer to the Zone A with respect to CT and then to the sea while FT is inside the Zone A. In fact, sometimes the dewatering pump must be operated to avoid flooding. Analysis of the Cone Index and of the shear strength results showed significant differences between OT and CT treatments in favor of treatment OT.
These differences can be explained as well as by soil texture also by water content that influenced soil strength values, in fact, according to [17] significant linear correlation between soil water content and Cone index in the superficial layers was found (Figure 2) and a statistically significant correlation was found between soil penetration resistance and shear strength (Figure 3).
Analyzing the results of total porosity and saturated hydraulic conductivity, statistically significant differences were found between OT and CT in favor of CT

Figure 2. Significant linear type correlation, between soil water content and Cone index (p < 0.01) · conventional; ¨ organic.
treatments. According to results found by other authors [18-20], OT treatment showed lower values of these two parameters (total porosity lower than 20%). These results highlighted greater susceptibility to soil compaction of OT due to the clay soil and relative high water content. A significant correlation was found between saturated hydraulic conductivity and total porosity (Figure 4).
This level of soil compaction might be ameliorated adopting conservative tillage operations, for example a deep ripping to drain water and a superficial tillage operation (0.20 m depth) to increase porosity and softness without destroying soil structure.
3.2. CO2 Stored in the Soil
Analyzing the results showed in Table 1, dry bulk density was statistically lower for FT treatment with respect to OT and CT treatments while soil organic carbon contents were different between three treatments in favor of OT and FT. Thanks to the higher organic matter content in the soil, results show an average increase of yearly carbon content (0 - 0.20 m layer) in the organic (∆COT = 1200 kg·ha–1) and forestry (∆CFT = 2200 kg·ha–1·year–1)

Figure 3. Significant esponential type correlation, between Cone index and shear strength (p < 0.01) · conventional; ¨ organic.
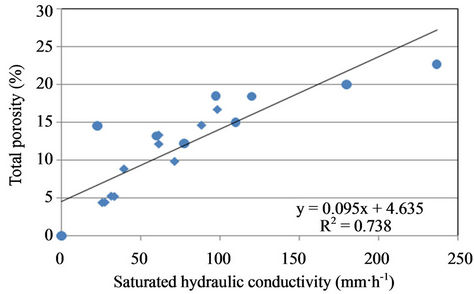
Figure 4. Significant linear type correlation, between saturated hydraulic conductivity and total porosity (p < 0.01) · conventional; ¨ organic.
treatments with respect to the conventional one. These values are equivalent to a stored CO2 in the soil of 4400 (kg·ha–1·year–1) and 8070 (kg·ha–1·year–1) for OT and FT, respectively.
3.3. Soil Chemical Characteristics
Soil chemical characteristics of superficial layer, 0 - 0.20 m depth, of three treatments (CT, OT and FT) are shown in Table 2. Soil pH of treatments OT and CT was moderately alkaline while FT was alkaline with the same average level of electrical conductivity while they differ for many other parameters (Table 2). CT is well endowed, OT and FT are rich of Exc. Ca and Mg so they can compensated and improve soil structure in presence of high values of a pollutant element as Exc. Na (148, 187, 432 mg·kg–1 for CT, OT and FT respectively). OT and FT soils are well endowed of organic matter (3.26% and 6.24% respectively), of total nitrogen and of available phosphorous (45% and 44% respectively) and are characterized by high level of CEC (28 and 29 meq%) and colloids index (73 and 97 respectively).
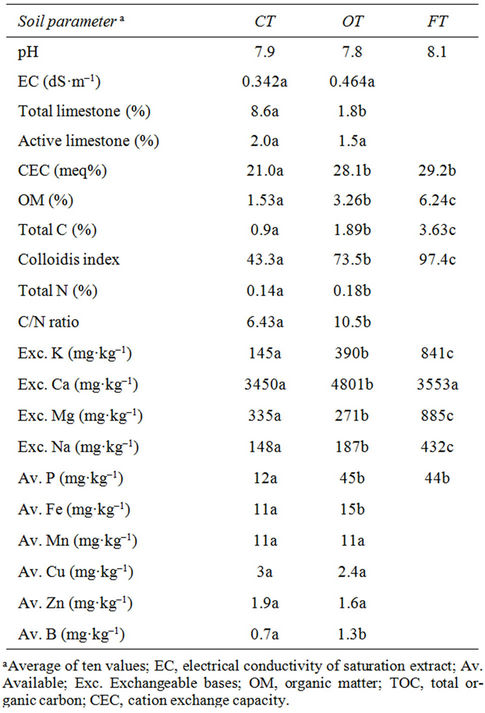
Table 2. Mean values of soil chemical characteristics, 0 - 0.20 m depth for the three different treatments.
CT soil has a lower level of fertility than OT and FT, an higher percentage of total limestone and a greater concentration of active limestone. Besides of the phosphorrous, Table 2 shows the availability of some others essential elements for the plants (Fe, MN, CU, ZN, and B), particularly endowed for the OT treatments.
3.4. Soil Organic Matter Mapping
Results of the interpolation of soil organic matter maps performed by using the software ArcGIS and the spatial analyst tool IDW are shown in Figures 5-7.
From the analysis of Organic Matter (Figures 5-7) interpolated maps it emerged the presence of homogeneous and well defined zones that highlighted the spatial variability within the field [21]. Organic matter can be considered a good indicator of the soil quality.
The results of the water chemical characteristics analysis of Ponds 1 and 2 are shown in the Table 3.
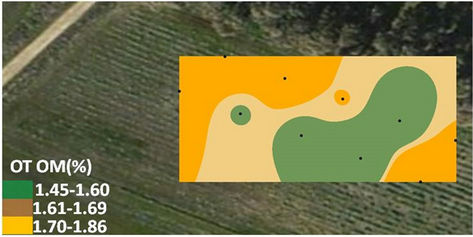
Figure 5. View of field maps of organic matter content (OM) of the Organic Treatment (OT).
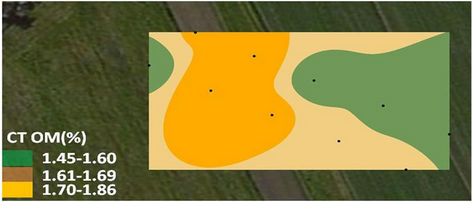
Figure 6. View of field maps of organic matter content (OM) of the Conventional Treatment (CT).
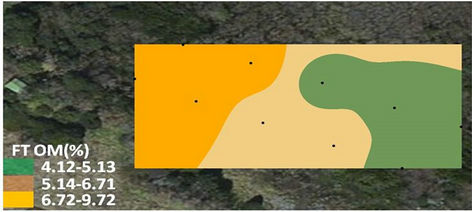
Figure 7. View of field maps of organic matter content (OM) of the Forestry (FT) Treatment.
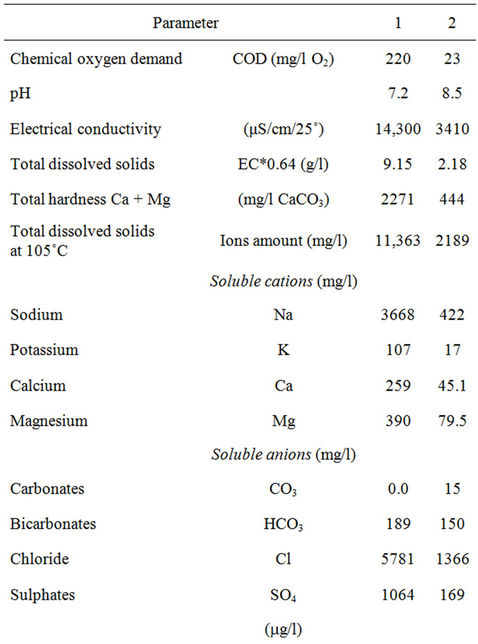
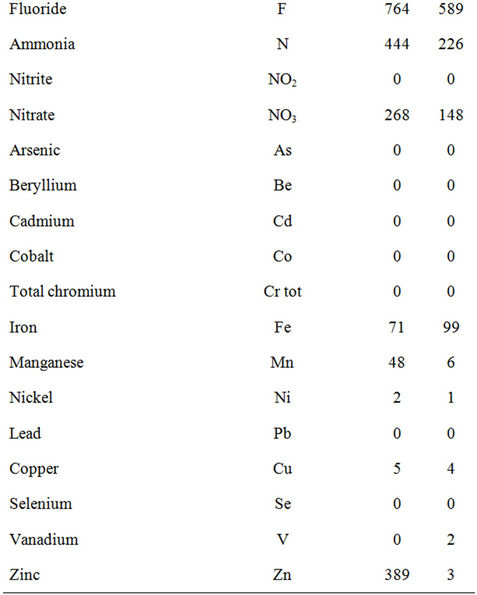
Table 3. Water chemical characteristics of the Ponds 1 and 2.
Due to the proximity of the ponds to the sea, the results of the water chemical analysis show a brackish water with high values of total hardness Ca + Mg particularly in the Pond 1 (2271 mg/l CaCO3).
Values of soluble cations and soluble anions were higher in Pond 1 than in Pond 2; except for what concern Carbonates which values were higher in Pond 2.
Apart few elements with raised concentration as fluoride (764 and 589 μg/l) found in the Ponds 1 and 2 respectively; Iron (71 and 99 μg/l) found respectively in Ponds 1 and 2, Manganese (48 μg/l) and Zinc (389 μg/l) found in the Pond 1, the concentration of the other elements reenters in the maximum level for the irrigation water [22]. The presence of Iron-Manganese is because the ponds are situated in a deep soil with a trunk profile; characterized by a deep clay-alluvial horizon with IronManganese nodules.
Many elements as Nitrite, Arsenic, Berillium, Cadmium, Cobalt, total Chromium, Lead and Selenium resulted totally absent. The results show a good quality of the water present in the Ponds situated in the wetlands reserve (Zone A).
4. Conclusions
The study carried out on agricultural and forestry soils properties and water of two ponds has allowed to assess and evaluate the effects of different land use on physical-chemical properties and CO2 storage capacity.
The obtained results highlighted that the soil use was correlated with some quality indicator particularly organic matter and dry bulk density and consequently with CO2 stored into the soil.
In fact results show values of stored CO2 equivalent to a reduced release of gas into the atmosphere of around 4400 kg·ha–1·year–1 for the OT treatment and around 8070 kg·ha–1·year–1 for the FT treatment.
The results of water chemical analysis show a good quality of the water present in the ponds situated in the wetlands reserve (Zone A).
Obtained results confirmed how agricultural and forestry activities protected the wetland reserve. Wetland ensuring supplying of important ecological functions: water purification, flooding control, aquifer recharge, stabilization of coastline against marine erosion, mitigation of local climatic changes and biodiversity conservation.
The field sampling and mapping has allowed a more efficient resource management and enhanced our understanding and possibility to predict temporal and spatial variability of soil property in response to management practices. Some physical-chemical indicators of soil strength such as SS, BD and OM used to monitor soil status and to manage it with precision techniques and to asses soil workability were found.
5. Acknowledgements
This work was carried out under the auspices of the special project “Sceneries of adaptation of the Italian agriculture to the climatic changes” (AGROSCENARI) D.M. 8608/7303/2008 of 7.8.2008 of the Agricultural Research Council, and Italian Ministry of the Agricultural and Forestry Politics.
REFERENCES
- M. Kochi and A. Freibauer, “Hotspots of Loss of Soil Organic C under Climate and Land Use Change,” Proceedings of Carbon in a Changing World, Rome, 24-26 October 2011, pp. 11-12.
- R. Hai, D. Weibing, W. Jun, Y. Zuoyue and G. Qinfeng, “Natural Restoration of Degraded Range Land Ecosystem in Heshan Hilly Land,” Acta Ecologica Sinica, Vol. 27, No. 9, 2007, pp. 3593-3600. doi:10.1016/S1872-2032(07)60076-6
- C. Tong, R. A. Feagin, J. Lu, X. Zhang, X. Zhu, W. Wang and W. He, “Ecosystem Service Values and Restoration in the Urban Sanyang Wetland of Wenzhou, China,” Ecological Engineering, Vol. 29, No. 3, 2007, pp. 249-258. doi:10.1016/j.ecoleng.2006.03.002
- R. Lewis, “Creation and Restoration of Coastal Plain Wetlands in Florida,” In: J. A. Kusler and M. E. Kentula, Eds., Wetland Creation and Restoration: The Status of the Science, Island Press, Washington DC, 1990, pp. 73-101.
- J. E. Grayson, M. G. Chapman and A. J. Underwood, “The Assessment of Restoration of Habitat in Urban Wetlands,” Landscape and Urban Planning, Vol. 43, No. 4, 1999, pp. 227-236.
- J. B. Zedler, “Restoring Cordgrass Marshes in Southern California,” In: G. W. Thayer, Ed., Restoring the Nation’s Marine Environment, Maryland Sea Grant College, Maryland, 1992, pp. 7-51.
- J. Stricker, “Reviving Wetlands,” Wetlands, Vol. 14, No. 2, 1995, pp. 20-25.
- C. A. Simenstad and R. M. Thom, “Functional Equivalency Trajectories of the Restored Gog-Le-Hi-Te Estuarine Wetland,” Ecological Application, Vol. 6, No. 1, 1996, pp. 38-56. doi:10.2307/2269551
- J. B. Zedler and M. W. Weller, “Overview and Future Directions,” In: J. A. Kusler and M. E. Kentula, Eds., Wetland Creation and Restoration: The Status of the Science, Island Press, Washington DC, 1990, pp. 405-413.
- C. A. Simenstad and R. M. Thom, “Restoring Wetland Habitats in Urbanised Pacific Northwest Estuaries,” In: G. W. Thayer, Ed., Restoring the Nation’s Marine Environment, Maryland Sea Grant College, Maryland, 1992, pp. 423-471.
- R. J. West, “Rehabilitation of Seagrass and Mangrove Sites —Success and Failures in NSW,” Wetlands, Vol. 14, No. 2, 1995, pp. 13-19.
- P. Servadio and E. Blasi, “Agricoltura e Occhio Digitale. I GIS e le Loro Applicazioni nel Settore Agricolo. L’Informatore Agrario n. 49,” 2003.
- P. Servadio, S. Bergonzoli, D. Dell’Unto and C. Beni, “Maize Yield and Physical-Chemical Fertility Mapping for the Management of the Soil,” Journal of Information Technology in Agriculture, Vol. 4, No. 1, 2011, pp. 1-8
- M. Borin, C. Menini and L. Sartori, “Effect on Tillage Systems on Energy and Carbon Balance in North-Eastern Italy,” Soil & Tillage Research, Vol. 40, No. 3-4, 1997, pp. 209-226. doi:10.1016/S0167-1987(96)01057-4
- C. Beni, P. Servadio, S. Marconi and U. Neri, “Anaerobic Digestate Administration: Effect on Soil Phisical and Mechanical Behaviour in Southern Italy,” Comunications in Soil Science and Plant Analisys, Vol. 43, No. 5, 2012, pp. 821-834. doi:10.1080/00103624.2012.648359
- F. Cauli and W. Ceccarelli, “Macchiatonda una Riserva Sulla Costa Degli Etruschi,” Edizioni Cine Teulada, Roma, 2001.
- O. K. Eradat and B. D. Witney, “The Determination of Plough Draught-Part I. Prediction from Soil and Meteorological Data with Cone Index as the Soil Strength Parameter,” Journal of Terramechanics, Vol. 19, No. 2, 1982, pp. 97-106. doi:10.1016/0022-4898(82)90014-3
- A. Marsili, P. Servadio, M. Pagliai and N. Vignozzi, “Changes of Some Physical Properties of a Clay Soil Following Passage of Rubberand Metal-Tracked Tractors,” Soil & Tillage Research, Vol. 49, No. 3, 1998, pp. 185-199.
- P. Servadio, A. Marsili, M. Pagliai, S. Pellegrini and N. Vignozzi, “Effects on Some Clay Soil Qualities Following the Passage of the Rubber-Tracked and Wheeled Tractors in Central Italy,” Soil & Tillage Research, Vol. 61, No. 3-4, 2001, pp. 143-155. doi:10.1016/S0167-1987(01)00195-7
- P. Servadio, A. Marsili, N. Vignozzi, S. Pellegrini and M. Pagliai, “Effects on Some Soil Qualities in Central Italy Following the Passage of Four Wheel Drive Tractor Fitted with Single and dual Tires,” Soil & Tillage Research, Vol. 84, No. 1, 2005, pp. 87-100. doi:10.1016/j.still.2004.09.018
- P. Servadio, S. Bergonzoli, D. Dell’Unto amd C. Beni, “Models of Soil Compaction by Agricultural Machineries Wheeling and Soil Qualities Mapping,” International Conference on Agricultural Engineering (AgEng 2010). Towards Environmental Technologies, Clermont-Ferrand, 6- 8 September 2010, pp. 1-10.
- L. Giardini, “Agronomia Generale Ambientale e Aziendale,” Patron Editore, Bologna, 1992.