Journal of Environmental Protection
Vol. 3 No. 10 (2012) , Article ID: 23840 , 8 pages DOI:10.4236/jep.2012.310148
Shoreline Instability Study on Fun Island Resorts, Maldives
![]()
School of Civil Engineering, Linton University College, Mantin, Malaysia.
Email: e.loh@legendagroup.edu.my, usamath@gmail.com, tjdeepak@gmail.com
Received June 25th, 2012; revised July 27th, 2012; accepted August 29th, 2012
Keywords: Erosion; Glaciation; Global Warming; Abrasion; Groynes
ABSTRACT
Shoreline changes induced by erosion and accretion are natural processes that take place over a range of time scales. They may occur in response to smaller-scale events, such as storms, regular wave action, tides and winds, or in response to large-scale events such as glaciation that significantly alter sea levels (rise/fall) and tectonic activities that cause coastal land subsidence or emergence. Environmental related issues are one of the major problems which the native islanders of the Maldives are facing throughout the history. The global warming and sea level rise have been a threat for the people of these islands. The scope of this paper is to find the shoreline instability of the coastal area along Fun Island Resort Maldives and aim is to find the abrasion, erosion on the coastal area of the island throughout the monsoon season. The coastal structures adopted as a protection against erosion has been damaged due to the 2004 Tsunami and the groynes are still to be repaired. A map was generated with the data collected on the topographic survey which shows that the maximum height of the vegetation line was found to be just +2.15 m above Mean Sea Level (MSL). Beach profiles around the island were taken to access the damage to the shoreline of the island.
1. Introduction
The Maldives is an archipelago of 1190 islands which is grouped in double chains of 26 atolls stretching in a North-South direction in the Indian Ocean. The atolls are composed of live coral reefs and sand bars. The Maldives is a country which bears the lowest Mean Sea Level (MSL) in the world which has an average ground level of 1.5 meters above sea level and the maximum natural ground level is 2.3 meters from the sea level. These coral islands are surrounded by the sea which plays a vital role on the change of the coastal areas of the islands.
Development within coastal areas has increased interest in erosion problems; it has led to major efforts to manage coastal erosion problems and to restore coastal capacity to accommodate short and long-term changes induced by human activities, extreme events and sea level rise. The erosion problem becomes worse whenever the countermeasures (i.e. hard or soft structural options) applied is inappropriate, improperly designed, built, or maintained and if the effects on adjacent shores are not carefully evaluated. Shoreline changes induced by erosion and accretion are natural processes that take place over a range of time scales. They may occur in response to smaller-scale events, such as storms, regular wave action, tides and winds, or in response to large-scale events such as glaciation that significantly alter sea levels (rise/fall) and tectonic activities that cause coastal land subsidence or emergence. Often erosion is addressed locally at specific places or at regional or jurisdictional boundaries instead of at system boundaries that reflect natural processes. This anomaly is mostly attributable to insufficient knowledge of coastal processes and the protective function of coastal systems.
2. Study Area-Fun Island Resort (FIR)
Fun Island Resort (FIR) (Bodufinolhu) is a 100 room three star resort located on the South Eastern corner of South Male’ Atoll [1-6]. Villa Shipping and Trading Company [7] further reported that the reef on FIR exists has an area of about 16 km2 and it is large compared to average Maldivian reefs.
However since the beginning of FIR development in 1983, number of coastal structures have been constructed to maintain white sandy beaches and to protect the island from erosion [1]. As to improve the status of the FIR beach, one of the beach replenishing projects carried out was in 1998/1999 [1]. This project helped to increase the width of the beach to an average 40 - 50 metres all around the island and at 2003 FIR is about 12 hectares in area [1]. CDE had agreed that FIR has undergone major coastal changes on various occasions and coastal modification has resulted [2] (Figure 1).
CDE surveyed FIR in 2008 and concluded from their evaluation that the terrestrial environment specified that there is no significant vegetation (natural vegetation) on the island. Recently research of VSTC in 2010 also proved that the assessment of the terrestrial environment indicated that there is no significant vegetation on FIR, only planted coconut palms and some pioneer vegetation on the reclaimed area with barren areas in between and found from the reef surveys that there are no significant levels of coral community at the proposal locations for the over water structures (jetty, water villas and restaurants) [7].
3. Methodology
The Figure 2 highlights the research methodology used to obtain the data for the study. Primary data was collected with a topographic survey and available secondary data were collected from various government agencies. The data were analyzed using mainly Autocad 2010 and MS Excel software. The study involves mostly of the erosion, abrasion and shoreline instability due to the wind, tide and the costal structures adapted in the study area.
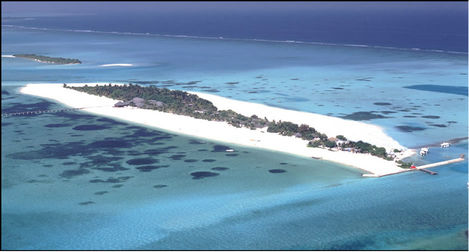
Figure 1. Aerial view of Fun Island Resort Maldives, source [8].
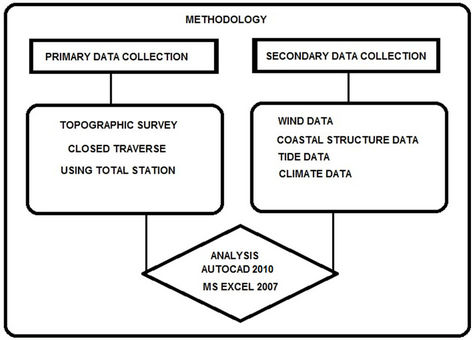
Figure 2. Methodology of the study.
A Topographic Survey of Fun Island Resort was conducted from 24th to 26th May 2011. The purpose of the topographic survey was to gather survey data about the natural and man-made features along the coastline of the island as well as its elevations. A total of eight station points (ST1 to ST8) were set around the island to form a closed traverse. Initially the survey started with the station point one (ST1) based on the main jetty of the island with reference to the bench mark (BM1) on the island. The elevations of several Intermediate points (IS) between the vegetation and the coastline to a depth of −0.7 m was recorded along the west side of the island from station point ST1. The western side of the island consisted mainly of the beach and the main jetty of the island.
A Foresight (FS) was taken to mark the station points ST2 on the southern side of the island and the station point ST3 was marked on the northern side of the island from the station point ST1. The instrument was then moved to the station point ST2 and a back reference Backsight (BS) was taken to the station point ST1. The intermediate points from this station was taken and a Foresight taken to station point ST4. These steps were repeated and the traverse was continued around the island and closed at station point ST3.
3.1. Survey Data Entry and Error Calculations for Traverse
The collected data from the site survey was entered on MS Excel and the error calculations for the traverse were calculated. The rule says that the sum of the interior angles of a traverse should be as follows:
Sum of interior angles = (n – 2) × 180˚
Where n is the number of station points.
Thus sum of interior angles should be
= (8 – 2) × 180˚ = 1080˚
The total of the interior angles we got from the survey data = 1080˚19'20"
Therefore the misclosure of the traverse = 1080˚ – 1080˚19'20" = −0˚19'20"
The misclosure is divided among the eight station points with each
= −0˚19'20"/8
= −0˚02'25"
The misclosure is then deducted from the interior angle to get the corrected angle.
The summation of the corrected angle is now 1080˚.
The Table 1 shows the initial and correct interior angles for the traverse data obtained from Fun Island Resort.
Once the error in the traverse is corrected the data is entered together with the rest of the data obtained from the survey. The elevations of the points are calculated using Height of Plane of Collimation (HPC) method.
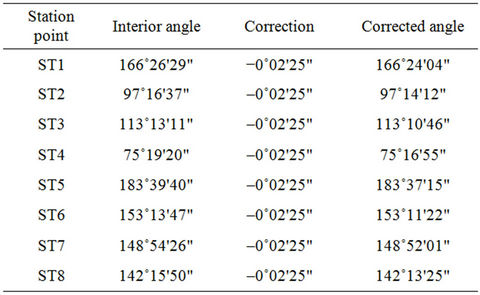
Table 1. Tabulation for corrected angles.
After the elevations are calculated this data is then used to draw the coastline and vegetation of Fun Island Resort including the contours of elevations.
4. Results & Discussions
4.1. Wind Data
The daily wind patterns for the two seasons for the years 2010 and 2011 for Hulhule have been studied for the detail analysis of the winds. The analysis of the winds indicates that the central region of the Maldives is predominantly westerly and north easterly (refer Figure 3). It also indicates that there is almost no wind from the quadrant between east and south. The analysis of the wind data for the two seasons indicate that during the Northeast monsoon the wind is predominantly from ENE and E (refer Figure 4) with wind speed reaching 11-17 knots for 16% of this period. Another 12% of the time the wind speed reaches 7 - 10 knots during this period.
The wind direction changes distinctly from W, WSW and WNW throughout the Southwest monsoon. The wind speed for this monsoon reaches 11 - 17 knots for 12% of the period and 7 - 10 knots for 34% of the period.
These results have been confirmed by Kench and Brander [5] to be consistent with the mean long term trend in the wind climate in the central region of the Maldives.
4.2. Wave Data
According to DHI, (1999) the significant height (Hs) in the southern regions of the Maldives exceeds 2.5 m in about 0.1 percent of the time (refer Figure 5). Figure 5 shows that the highest waves are from W and S. Significant wave heights exceeds 1 m in less than about one

Figure 3. Wind Rose Plot for the Northeast monsoon (Dec-Apr) for central region of Maldives obtained from Department of Metrological Center [3].
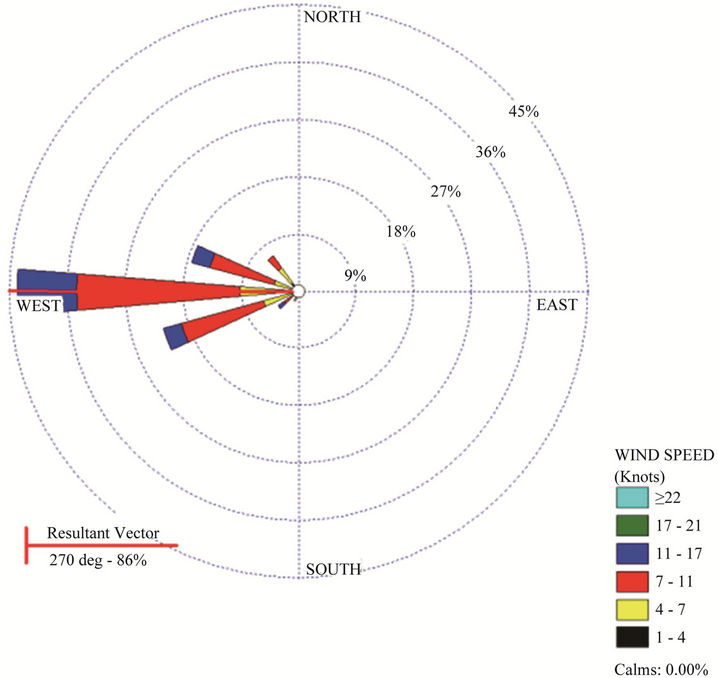
Figure 4. Wind Rose Plot for the Southwest monsoon (May-Nov) for central region of Maldives obtained from Department of Metrological Center [3].
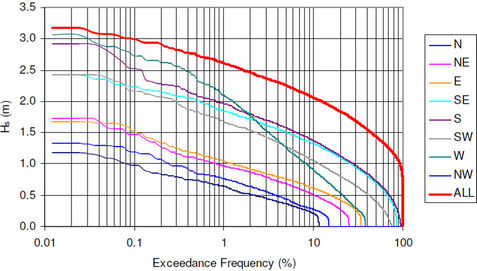
Figure 5. Wave height, hs, exceedence curves for Southern region of Maldives. Source [4].
percent of the time from N, NW, NE and E.
Table 2, shows the Astronomical tide levels recorded at the Department of Metrological Centre at Hulhule, Kaaf Atoll, Maldives. This station has continuous records of the tide data for the past 30 years. The table shows that the highest astronomical tide level is +0.64 m (MSL) and that the lowest astronomical tide level is –0.56 m (MSL). It is assumed that the tidal signal at Hulhule will be the same as at Fun Island Resort due to the close of the permanent tide station at Hulhule.
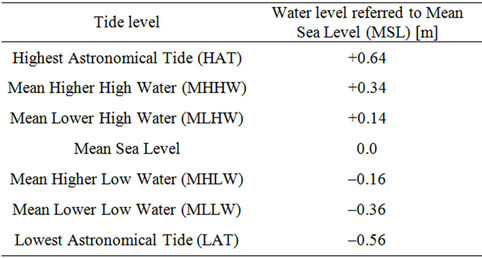
Table 2. Tide levels at Hulhule, Kaafu Atoll, Maldives.
The graph (refer Figure 6) shows the tide levels obtained for 20th to 27th May 2011, which falls in the duration of the physical site survey was carried out. The graph indicates that the tide height during this period was between +0.5 m (MSL) and –0.6 m (MSL). The graph (refer Figure 7) shows the tide levels for the month of May 2011.
4.3. Fun Island Coastal Area Topographic Survey Data
As discussed in the previous chapter, the coastal area
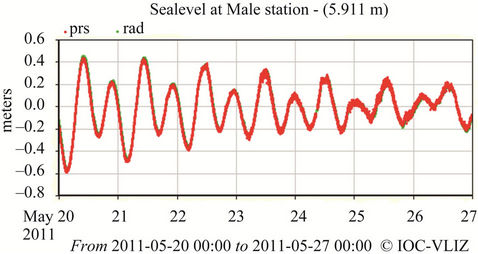
Figure 6. Tide levels at Hulhule Station between 20th to 27th May 2011.
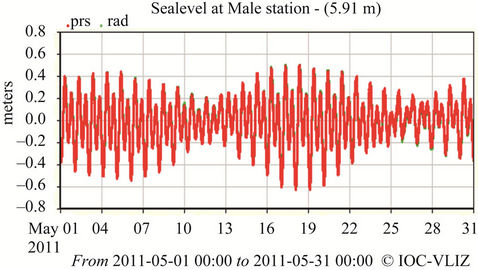
Figure 7. Tide levels at Hulhule Station for the month of May 2011.
topographic survey data was computed by using Autocad 2010 (refer Figure 8). The survey shows that Fun Isand has an average elevation of +2.0 m (MSL). The high tide level is considered as +0.5 m (MSL) and the low tide level is considered as –0.5 m (MSL).
Seven additional beach profiles where major erosion has occurred are taken (refer Figure 9) to demonstrate the levels and the environmental impacts of the locations. These profiles (refer Figures 10-16) are supported with the pictures shown together with each profile.
Figure 10, shows the north eastern side of Fun Island. It can be observed here that this area has a major problem of erosion. The erosion could be a result of the strong currents between Fun Island and Medhufinolhu and tidal fluctuations. This area of the island is also exposed directly to the winds during both the monsoons and does have erosion effects during both the monsoons.
Figure 11, shows the profile for the eastern side of the island. Erosion can be observed on this part of the island as well. However the erosion in this part of the island is not as savvier as on the northeastern side of the island. It was noted during the survey that this area is protected from the northeast monsoon winds by the vegetation of the island. Thus this area does not have much of an erosion problem during the northeast monsoon though it is affected by the winds and waves of the southwest monsoon.
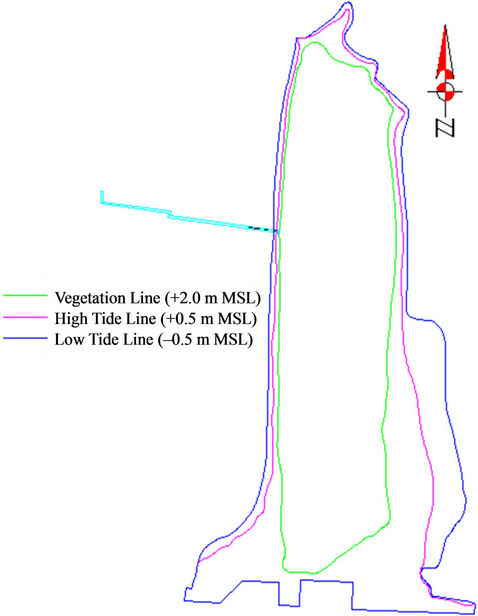
Figure 8. Coastline profile of the Island developed from the site survey May 2011.
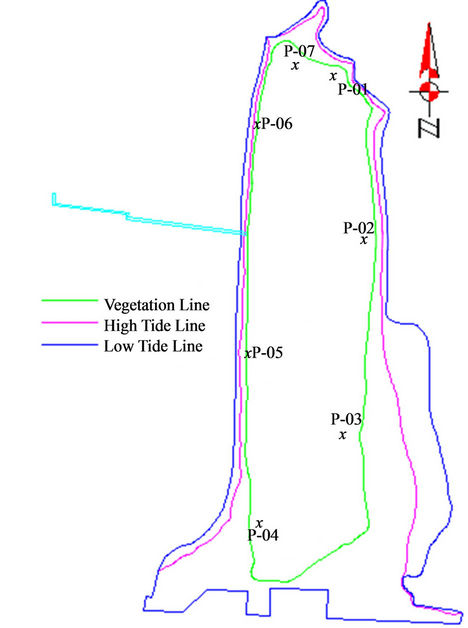
Figure 9. Locations for beach profiles.
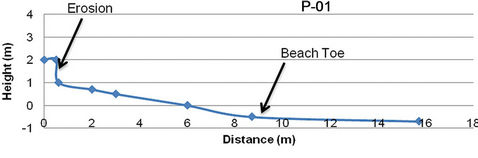
Figure 10. Beach profile P-01.
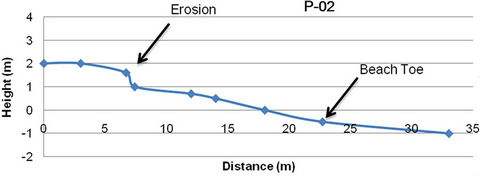
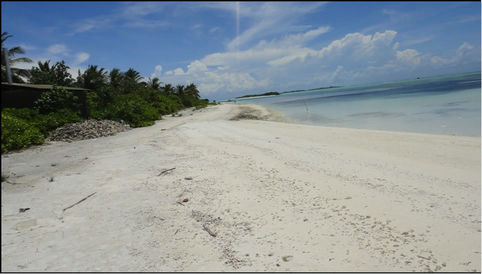
Figure 11. Beach profile P-02.
Figure 12, shows the beach profile of the southwestern side of the island. The height on this part of the island is slightly increased than the rest of the island due to the excess soil obtained from the dredging of the harbor. Thus the natural processes along the beach have been altered by the modification of the surroundings and yet the impact of this is not fully known. However it was observed that there are slight signs of erosion along this area as well. It was also observed that during the low tide the beach extends about 20 m unlike the rest of the island.
Figure 13, shows the southwestern side of the island. It was observed that this area has a major problem of erosion. The reason for erosion within this area could be due to the strong currents between Fun Island and Olhuveli
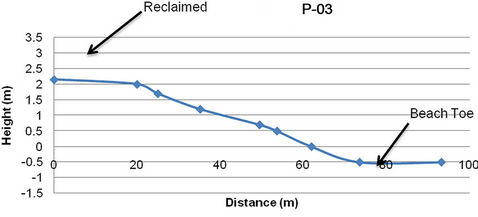
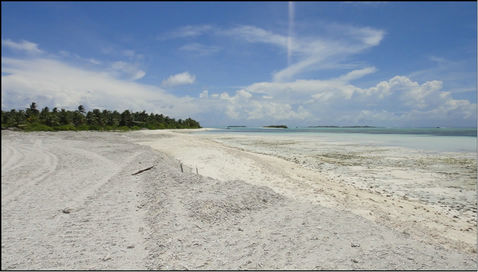
Figure 12. Beach profile P-03.
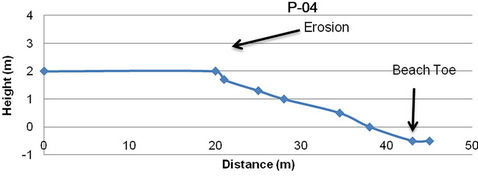
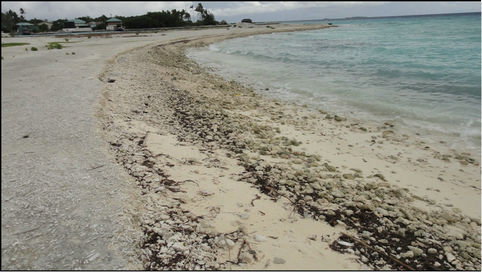
Figure 13. Beach profile P-04.
Island. It was also noted that the lagoon is deeper in this area than the rest of the island. This side of the island is directly exposed to the winds of both northeast monsoon and southwest monsoon. Thus the effect of erosion occurs during both the monsoon.
Figure 14, shows the profile for the western side of the island. Erosion can be observed on this part of the island as well. It was noted during the survey that this area is directly exposed to both northeast and southwest monsoon winds. Thus the effect of erosion occurs during both the monsoon. The groyne constructed on this side of the island to protect it against erosion has been damaged
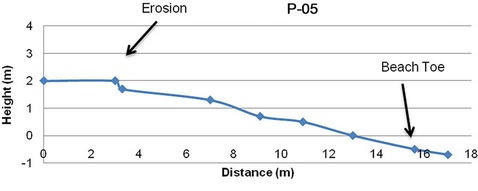
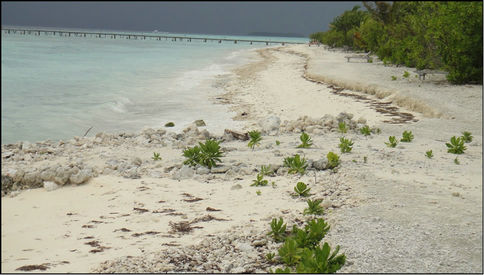
Figure 14. Beach profile P-05.
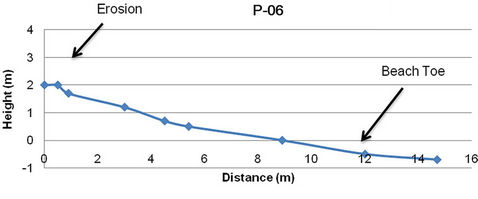
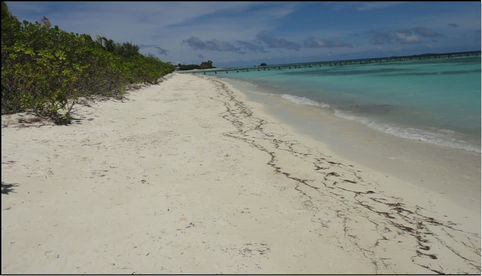
Figure 15. Beach profile P-06.
during the 2004 Tsunami and this could also be one of the reasons for the increased erosion in this part of the island.
Figure 15, shows the northwestern side of the island. Slight evidence of erosion can be found on this part of the island. It was observed that the erosion of this area is minimized by the damaged groyne on the northeastern side of the island.
Figure 16, shows the northern side of the island. According to Mr. Abdulla Kamil, Resident Manager, Fun Island Resort, the beach here moves noticeably to the east during the northeast monsoon and to the west during

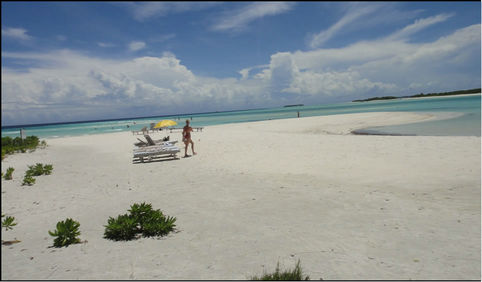
Figure 16. Beach profile P-07.
the southwest monsoon. The movement of the beach can be seen in the Figure 17 which shows the merged map of 2007 and 2011 of Fun Island Resort.
The merged map (Figure 17) shows that the shoreline of the island has changed within the three years. The southern end is changed due to the sheet-piling and dredging of the harbor. The southeast side of the island has been reclaimed to some extent with the excess soil obtained from the deepening of the harbor. However on the northern end it can be seen in the Figures 4-15 that the sand bank at the northern end of the island has changed shape and moved towards east. We can see sign of abrasion along the north eastern end of the island.
5. Recommendation
There are various alternative approaches such as Beach Nourishment, Sea Walls, Break Waters… etc., for shoreline management of Fun Island Resort. Being a tourist resort, the island has limitations in construction of structures within the island as well as its coastal area. Taking this in consideration, Beach Nourishment is one of the best options the island has in order to maintain its beach and a stable shoreline. Beach Nourishment is the artificial placement of sand obtained from the lagoon or elsewhere in order to replenish the volume of sand along the coastline. It does not require hard structures and is considered as an environmentally compassionate strategy since it just adds more sediment to the shoreline.
However beach fills are dynamic structures that respond to the slightest environmental changes and it is often difficult to completely understand the nature and magnitude of such changes. Therefore it is essentials to
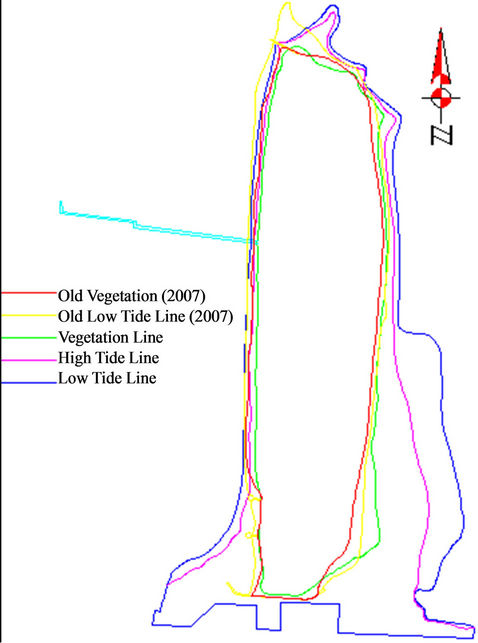
Figure 17. Merged map of 2007 and 2011 of Fun Island Resort.
carry out a comprehensive shoreline monitoring program over a long period of time after the initial beach fill in order to identify the physical changes to the nourished beach. This would allow to assess the short term and the long term morphological changes to the shoreline and assess the re-nourishment frequencies and to improve the design of the beach fill when required and to assess the best techniques for Beach Nourishment as a shoreline protection method.
The beach monitoring program for Fun Island Resort could consist of the following physical data collection components:
• Periodic survey of the shoreline and vegetation;
• Periodic survey of the beach toe position.
These physical components would provide the necessary information on the changes to the shoreline of the island and can be compared relatively with the previous such data collected.
6. Conclusions
Based on the findings from the analysis and the site survey observations, it can be concluded that the shoreline of Fun Island Resort is instable. It is noted that Fun Island lies on the outer rim of the atoll. The shoreline change varies in response to the difference in the location of the island and exposure to the wind and waves. It is known that the shape of the island also influences the wave refraction and diffraction patterns that control the change in shoreline. Therefore it can be concluded that the shorelines of Fun Island is known to change between the two seasons driven by the fluctuations in the monsoonal wind and wave conditions of the surrounding.
It was also found that the coastal structures adapted on Fun Island also have an influence on its shoreline. The construction of the harbor at the southern side of the island has changed the shoreline at this end of the island by the reclamation and increasing the footprint of the island.
The groynes on the island are anchored on the shoreline which extends across the beach and reef flat perpendicular to the shoreline to interrupt normal long shore currents and sediment transportation process in order to trap and retain sand on the up drift side of these structures. However down drift erosion occurs due to these groynes. Therefore it is likely that these groynes have a significant impact which compromises the near shore current processes, sediment transportation and change in shoreline.
REFERENCES
- Commerce Development and Environment Pvt Ltd., “Initial Environmental Examination, Deppening of Entrance channel and Mooring Area,” Fun Island Resort South Male Atoll, Maldives, 2003.
- Commerce Development and Environment Pvt Ltd., “Initial Environmental Examination, Deppening of Entrance Channel and Mooring Area,” Fun Island Resort South Male Atoll, Maldives, 2008.
- Department of Meteorology (Dom), “Severe Weather Events in 2002, 2003 and 2004,” 2005. http://www.meteorology.gov.mv/default.asp?pd=climate& id=3
- DHI, “Physical Modelling on Wave Disturbance and Breakwater Stability,” Fuvahmulah Port Project, Denmark, 1999.
- P. S.Kench, R. F. McLean and S. L. Nichol, “New Model of Reef-Island Evolution: Maldives, Indian Ocean,” Geology, Vol. 33, No. 2, 2005, pp.145-148.
- Villa Shipping and Trading Company, “Environmental Impact Assessment Report, Re Development of Fun Island Resort, South Male’ Atoll, Maldives,” Land and Marine Environmental Resources Group Pvt Ltd., Maldives, 2008.
- Villa Shipping and Trading Company, “Environmental Impact Assessment Report, Addendum 1; Re Development of Fun Island Resort, South Male’ Atoll, Maldives,” Land and Marine Environmental Resources Group Pvt Ltd., Maldives, 2010.