Journal of Environmental Protection
Vol. 3 No. 4 (2012) , Article ID: 18458 , 8 pages DOI:10.4236/jep.2012.34040
Estimation of Phosphorus Bioavailability in the Water Column of the Bronx River, New York
![]()
1Department of Chemistry and Chemical Technology, Bronx Community College, City University of New York, New York, USA; 2Department of Environmental Geographic and Geological Sciences, Lehman College, City University of New York, New York, USA.
Email: jingyu.wang@bcc.cuny.edu
Received January 14th, 2012; revised February 9th, 2012; accepted March 9th, 2012
Keywords: SRP; TP; OP; Native Phosphatases Hydrolysis; River; Water Quality
ABSTRACT
Phosphorus (P) is a primary limiting nutrient in rivers and streams, and excessive P results in eutrophication of freshwater systems, in turn, excessive algal growth/toxic algal blooms, oxygen depletion, and water quality degradation. This study analyzed P pool, and hydrolysis of organic P (OP) by native phosphatases (NPase) in the water samples collected in the Bronx River. The soluble reactive P (SRP) of most of the sites’ water collected in 2006 and 2007 were higher (average 67 µg∙L–1 and 68 µg∙L–1, respectively) than the US Environmental Protection Agency’s (EPA) standard of 15 µg∙L–1. The SRP% (SRP/TP%) average was 27% in 2006, much lower than in 2007 of SRP% average 83%. The OP% (OP/TP%) average was 73% in 2006, which was much higher than the OP% in 2007 (which was only 17%). The SRP concentrations and distributions (%), and the total P (TP) concentrations were in substantial amounts compared with other rivers. The NPase hydrolyzed OP% was up to 100% in 2006 and 2007 water samples. The average of NPase% was 59% in 2006 and 73% in 2007. The NPase average concentrations were 348 µg∙L–1 in 2006, and 175 µg∙L–1 in 2007. The NPase hydrolyzed up to 100% of OP% in the Bronx River water samples at 37˚C, indicating a potential threat of eutrophication of freshwater systems as the global rise in temperature may continue to occur.
1. Introduction
Phosphorus is commonly a limiting nutrient in rivers and streams [1,2], and it is an essential nutrient for all living organisms’ growth and energy transport [3,4], however, excess P results in eutrophication and water quality degradation in rural and urban freshwater systems [5,6]. Nutrient limitation is considered as a key nutrient that is a primary limiting factor; plant growth in ecosystems was proportional to the nutrient supply rate, if key nutrient supply excess necessary then consequently causing eutrophication. Restriction of nutrient loading or discharge is to control eutrophication [7]. Nutrient enrichment results in excessive algal growth and toxic algal blooms, resulting in decrease in dissolved oxygen level [8,9]. Sewage effluent is a major P source [1]. Phosphorus concentrations in the water column varied by the bed sediments released P, the anthropogenic discharge, and particulate P in suspended sediments [10]. Various P compounds assimilated or deposited in sediments and biota can be chemically or enzymatically hydrolyzed to orthophosphate, releasing to the water column [5]. Orthophosphate is the only P form that autotrophs can assimilate [5]. Extracellular enzymes hydrolyze OP to phosphate. Excessive P results in eutriphication in freshwater systems, consequently excessive autotrophs production, leading to oxygen depletion becoming anoxic, high bacteria population and water degradation [5]. Dissolved organic phosphorus (DOP) palys an important role in natural water ecosystems [11]. Enzymatically hyrolyzable P (EHP), the monoesters of orthophosphoric acid, is the major organo-P in natural waters. It is important to know that EHP portion in DOP, to predict the bioavailability of P in water systems [2,11]. P cycling and transport in the river were controlled by physicochemical factors and biological factors [12]. For example, extracellular enzymes hydrolyze OP to orthophosphate; phosphatases hydrolyze phosphorus esters to orthophosphate P, a bioavailable form [13]. Anthropogenic nutrient enrichment of natural water can lead to water quality declines, low dissolved oxygen concentrations, toxic algal blooms and fish-kills [7,13-15]. Anthropogenic factors often result in large amount of P from point source (e.g. wastewater treatment plant) or non point source (e.g. fertilizer application to lawn, garden) discharged into freshwater systems [2,5,16-18].
The P bioavailability is the criteria for estimating the eutrophication potential in rivers and streams [2,19]; thus, analyzing OP hydrolysis by NPase in the water samples is crucial. This study was conducted to provide reference data on P bioavailability and estimation of the potential threat on water quality caused by NPase hydrolysis of OP under increased temperature (i.e. hydro-climatic changes caused by global warming) in the Bronx River located in Westchester County and the Bronx (one of the boroughs of New York City), NY.
2. Methodology
2.1. Study Area
Bronx River, originates from headwater Davis Brook, around 20 miles (32 km) in length, flows all the way through Westchester County and the Bronx to the estuary, and joins the East River (Figure 1) [2,17,20]. The Bronx River includes fresh and saline water. The Bronx River from city line (Site 9) to East Tremont Avenue Bridge (Site 12) is designated as Class B waters (dissolved oxygen is not less than 5 mg/L, fecal coliform shall not exceed 2400 MPN/100 mL), and the lower Bronx River from East Tremont Avenue Bridge is classified as the Class I saline surface water (dissolved oxygen is no less than 4.0 mg/L, total coliform standard shall not exceed 10,000 MPN/100 mL), and they are used for secondary contact recreation and fishing regulated by New York State. Water quality of both fresh and saline water systems are not in accordance with the EPA water quality standards: the fecal coliform level in the Bronx River was higher than the standard, and the dissolved oxygen level was lower than the standard in both fresh and saline water [20]. There are more than 100 stormwater and other discharges that flow to the river along the entire length from Westchester to the East River. The Hunts Point Wastewater Treatment Plant (WWTP) services this area [2,17,20].
2.2. Water Sample Collection and Physico-Chemical Analysis
Water samples were collected from 14 sites along the river (Figure 1), and were transported to Environmental Laboratory of Department of Environmental, Geographic
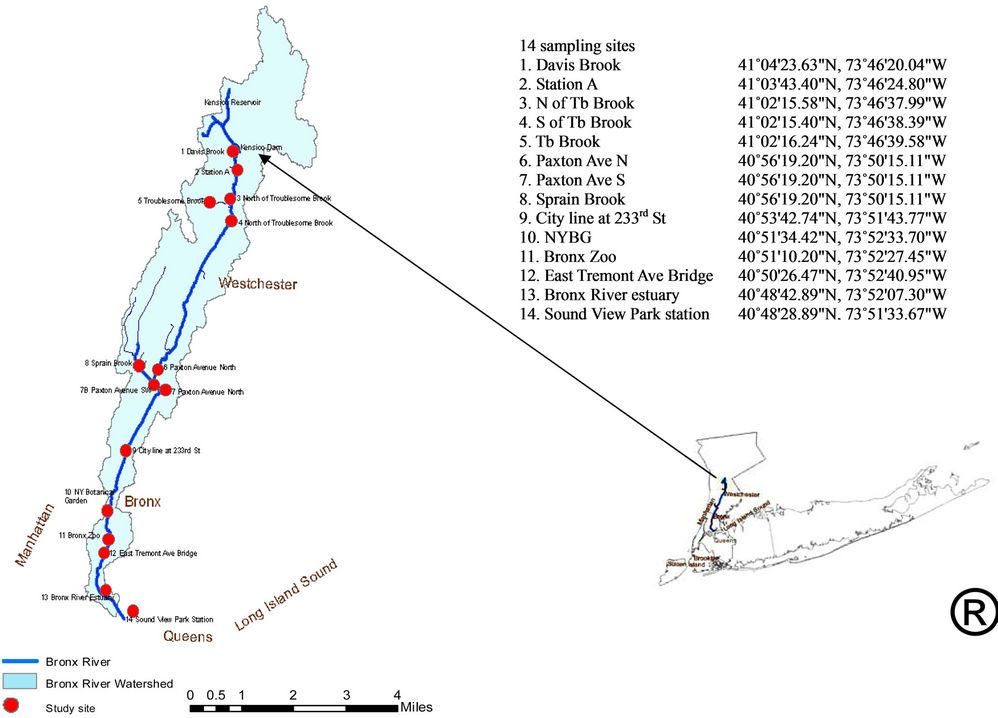
Figure 1. The bronx river study area and 14 sampling sites along the river.
and Geological Sciences at Lehman College of The City University of New York at the end of each sampling day, and stored at 4˚C in a Fisher Scientific Isotemp Laboratory Refrigerator until further experimentation [2,17]. Electrical Conductivity (EC) and pH combination electrodes were used to determine the EC and pH of the water samples [2,17]. Put 25 ml water sample from each site in a 50 ml beaker, and then the pH and EC were measured. The water samples were analyzed for SRP by UV- 2501PC UV-VIS Recording Spectrophotometer (Shimadzu Corporation) using ascorbic method at wavelength 880 nm [21]. The TP of water samples were determined by persulfate digestion block method [22]. An automatic ascorbic acid method [21] is used to determine the TP in the extracts. The difference between TP and SRP is considered as OP.
2.3. Water Sample Native Phosphatases Hydrolysis
1 ml water sample and 3.2 ml Tris (Tris(hydroxymethy)- aminomethane)-HCl buffered pH = 7 solution, plus 1 drop of toluene were incubated at 37˚C for 6 h [2,23], and then measured the SRP in the solution as modified method by Shand and Smith [24]. The NPase hydrolyzed P was measured by the difference of the SRP after the incubation and the SRP without incubation; the percentage of OP hydrolyzed by NPase was calculated, in order to estimate the potential capability of NPase to hydrolyze OP under increased temperature in the river (modified methods from [4,24,25]).
3. Results and Discussion
3.1. Selected Physico-Chemical Characteristics of Water Samples
There was no significant difference on pH along the river that ranged from 7.3 to 8.0 in 2006 and from 7.4 to 8.0 in 2007, so was EC (ranged from 530 to 353,000 µs∙cm–1 in 2006 and 540 to 378,000 µs∙cm–1 in 2007) other than the two estuary sites 13 and 14 had significantly higher EC values (Table 1). Among the fresh water sites, site 5 had higher EC, which could be related with dissolved minerals or local storm water runoff. The SRP in the Bronx River ranged from 2 to 221 µg∙L–1 in 2006 and from 27 to 162 µg∙L–1 in 2007 (Figure 2); the SRP average was 67 µg∙L–1 in 2006 and 68 µg∙L–1 in 2007, both were
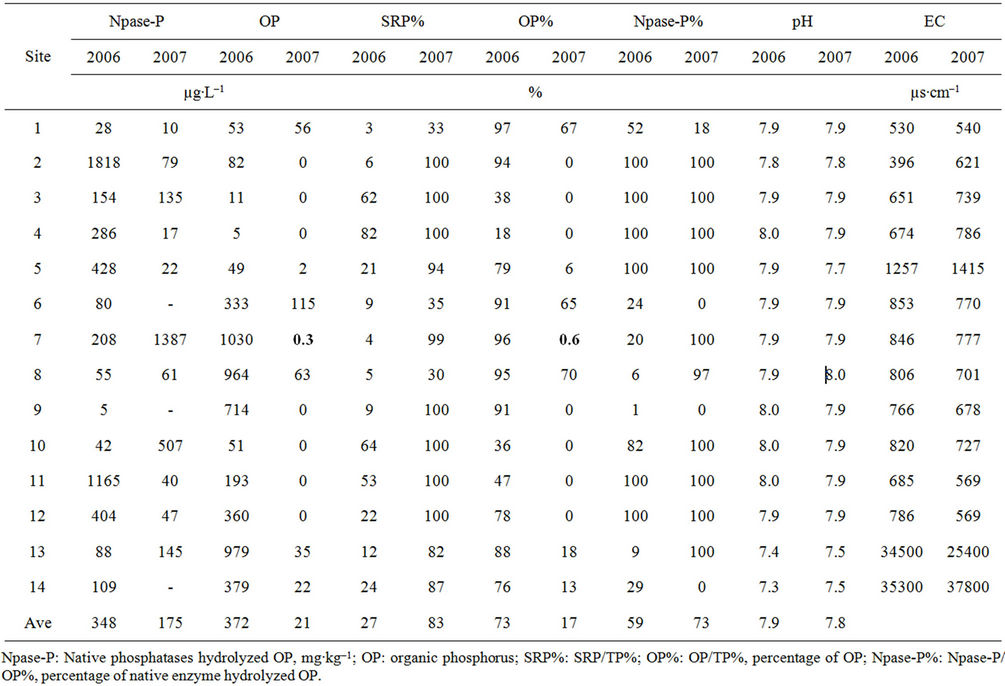
Table 1. Selected physico-chemical characteristics and enzymatic hydrolysis of organic P of the water samples collected in 2006 and 2007.
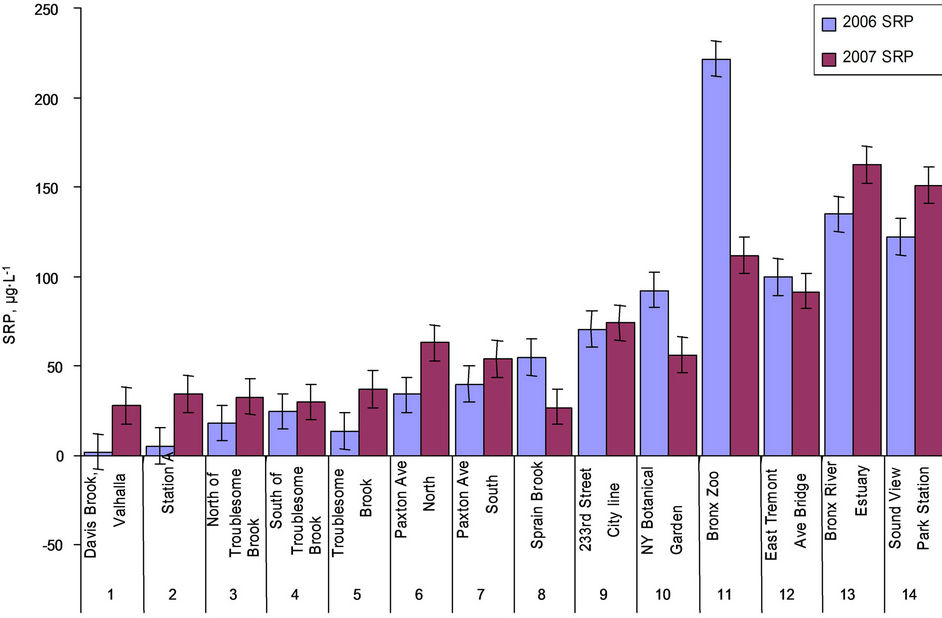
Figure 2. SRP in water samples collected in 2006 and 2007.
higher than the EPA standard of water quality value for P, which should be less than 15 µg∙L–1 for all source water reservoirs within New York City Watershed [26]. The SRP concentrations in sites 11, 12, 13 and 14 (Bronx Zoo, East Tremont Ave Bridge and the estuary sties) in both years were considerably higher than other sites, showed downstream increased pattern, and the phosphate levels varied with salinity meanwhile affected by dilution factors in estuary [27]. The TP ranged from 29 to 1113 µg∙L–1 in 2006 (the Sprain Brook tributary sites 7 and 8, the city line site 9, the estuary sites 13 and 14 had comparatively higher TP concentrations), and from 30 to 197 µg∙L–1 in 2007 (the Sprain Brook tributary site 6, Bronx Zoo site 11, estuary sites 13 and 14 had higher TP concentrations) (Figure 3); Sprain Brook tributary and estuary sites in both yeas were higher in TP concentrations than other sites. The OP ranged from 5 to 1030 µg∙L–1 in 2006, and from 0 to 115 µg∙L–1 in 2007 (Table 1); the Sprain Brook tributary and estuary sites were having higher OP values. There is only SRP (OP = 0 µg∙L-1) in seven sites of 2007 data. The average TP and OP levels in 2006 (438 µg∙L–1, 372 µg∙L–1) were much higher than in 2007 (89 µg∙L–1, 21 µg∙L–1). The SRP% (SRP/TP%) was from 3% to 82%, average 27% in 2006, which was much lower than in 2007 of SRP% average 83% that ranged from 33% to 100% (Table 1). The OP% (OP/ TP%) average in 2006 was 73%, ranged from 18% to 97% (Table 1), which was much higher than in 2007 of OP% average only 17% ranging from 0% - 70%.
3.2. SRP, OP and TP Comparison with Other Rivers
The SRP concentrations were ranged from 70 - 80 µg∙L–1 in interstitial water (IW) and 70 - 120 µg∙L–1 in surface water (SW) and the average SRP was 47% of TP in Garonne River, southern France [28]. The maximum SRP concentrations in Bronx river water sample in both years were higher than Garonne River, and the average SRP% in 2006 was lower and in 2007 was higher than that of Garonne River. The TP concentrations ranged from 160 - 180 µg∙L–1 in IW and 160 - 220 µg∙L–1 in SW, which was a smaller range than Bronx River water sample, the maximum values were lower than those in 2006 of Bronx River sample. The SRP ranged from 2 - 50 µg∙L–1 in Wye River located in Queenstown, MD [27] at spring season and it was in the range of SRP in Bronx River water sample, in summer the SRP reached the peak of 400 µg∙L–1 that was much higher than that of the Bronx River. The SRP and TP in streams within two east-central Illinois agricultural watershed (the Embarras and the Vermilion) was up to the same maximum concentrations of 2800 µg∙L–1 [29], which was much higher than SRP and TP maximum values in Bronx River water samples.
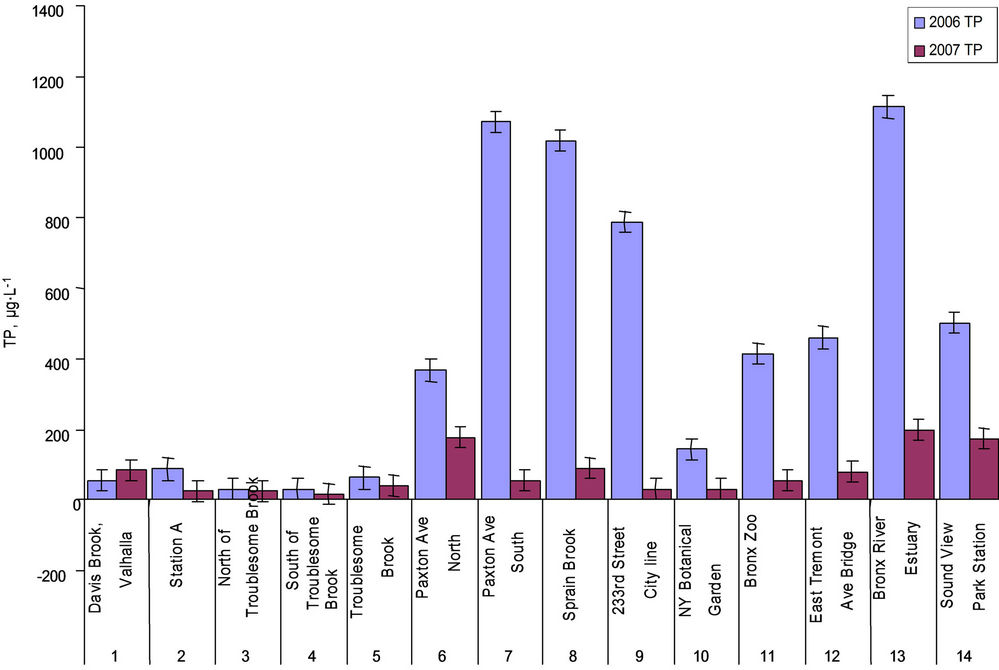
Figure 3. TP in water samples collected in 2006 and 2007.
The median SRP was 81 µg∙L–1 in Illinois streams, which shared similarity of SRP average values (67 µg∙L–1 in 2006 and 68 µg∙L–1 in 2007) in the Bronx River, and the median TP was 168 µg∙L–1 [29], which was much lower than the average in 2006 (438 µg∙L–1) and higher than in 2007 (89 µg∙L–1). The peak SRP concentration in River Lambourn during storm was 218 µg∙L–1, and 267 µg∙L–1 in River Enborne [30], which were close to the Bronx River maximum SRP concentration in 2006. The DOP in waters of Tamar estuary in SW England ranged from 1.1 to 2.2 µg∙L–1, and constituted 6% - 40% of the total dissolved phosphorus pool (TDP) [4]. The DOP concentrations were much lower than those of the Bronx River, and DOP percentage range was also smaller than that of the Bronx River.
The mean TP concentration of the upper Thames is 6600 µg∙L–1, and SRP form was 91%; There were six small sewage treatment plants in this agricultural subcatchment Rivers [12]. There is only Hunts Point WWTP in the estuary of the Bronx River compared with more WWTPs in the agricultural sub-catchment of Kennet and Dun Rivers, resulting in the TP concentration and SRP portion in upper Thames were way higher than those in the Bronx River for both years [12]. The TP in 2006 was much higher than the TP in Chesapeake Bay in 1970’s varied from 150 to 200 µg∙L–1, and the SRP for both years were also much higher than the dissolved orthophospate of 5 - 8 µg∙L–1 in Chesapeake Bay in 1970’s [31]. The TP ranged from 19.6 to 679.6 µg∙L–1, and the average ranged from 145.3 to 296.6 µg∙L–1 in four upland streams in northern England in year 1 [32]; the TP concentrations and the average TP values were lower than the Bronx River water sample TP in 2006 (average TP = 438 µg∙L–1) and greater than water sample TP in 2007 (average TP = 89 µg∙L–1). In year 2, the TP ranged from 10 - 316.2 µg∙L–1, average TP from 174.2 to 316.2 µg∙L–1 in the four streams in England; which was much lower than year 1 and still higher than Bronx River year 2-2007 data. Total P in streamwater samples in the Elk Creek, Canada showed that the TPmax increased from upper Elk of 15 µg∙L–1 to middle Elk of 20 µg∙L–1 and mouth of Elk of 60 µg∙L–1 [33], which were way lower than TP average concentrations in the Bronx River. The spatial pattern of TP increase from upper to lower river in Elk was not found in the Bronx River, instead the tributary and the estuary tended to have higher TP. The hydrochemistry spatial and temporal variations lead to P concentration and proportion and their bioavailability variations [34,35]. The phosphate needed to maintain equilibrium algal growth varied from 0.003 to 0.8 µg∙L–1 [36]. There was a great potential for algal growth in the Bronx River. The released P from sediments and hydrolyzed P from microorganisms were potentially bioavailable for algal growth, endangered dissolved oxygen level and water quality.
3.3. The Npase Hydrolysis of OP in Water Samples and Comparison with Other Studies
The NPase hydrolyzed OP% (NPase%) ranged from 1% to 100% for Bronx River water sample collected in 2006 and from 0% to 100% in 2007 water sample (Table 1). The average of NPase% was 59% in 2006 and 73% in 2007. The NPase hydrolyzed OP concentrations ranged from 5 to 1818 µg∙L–1 with a mean of 348 µg∙L–1 in 2006, and 0 - 1387 µg∙L–1 with a mean of 175 µg∙L–1 in 2007 The results showed that fair amount of OP had been hydrolyzed to SRP that available to plants in the river without any addition of enzyme at 37˚C. It is a potential threat on water quality when the temperature increases [17,25,37,38]. The OP was composed of 85% - 88% of TP in leachate from a grassland soil, and when leachate was incubated at 37˚C without any addition of phosphatases, there was 10% - 21% of TUP (total unreactive P) was hydrolyzed [2,25]. The OP in the Bronx River ranged wider than the OP in leachate, however NP hydrolyzed OP was up to 100% for both of years. It was showing that a greater threat to the freshwater ecosystems resulting from P transfers when temperature increases [2,25].
The total EHP pool ranged from 1.1 to 15 µg∙L–1, and EHP fraction of DOP was 23% - 100%, with a mean of 68% in the waters of the Tamar estuary in SW England [4]. The EHP concentration range was much narrower than that of Bronx River water, and the maximum value was only around 1% that of Bronx River water. The average hydrolyzed P% was in between that in 2006 and 2007. Kobori and Taga [39] found that EHP proportion relative to DOP was between 18% - 50% in water systems where biological activity was high. In the Bronx River, NPase% was in a wider range with much higher percentages. The treated of inflow and outflow agricultural drainage water hydrolyzed by phosphodiesterases was 54 µg∙L–1 that was 71% of OP [24]. The native enzymatically hydrolysable P in the Bronx River water was in a substantial amount compared with other studies. Therefore, when local temperature increases in summer (for example, July 2010, the temperature in NYC was higher than average record), there would be a potential for increased bioavailable phosphorus in the water column, causing eutrophication and threatening water quality.
4. Conclusion
The TP and OP average values in 2006 were much higher than in 2007; however, SRP was similar on average in both years. The SRP concentrations were much higher than EPA standard. Compared with other rivers, the P concentrations (SRP, OP, and TP) in the Bronx River were in substantial amounts and had a great potential for bioavailability. In both years, SRP concentrations showed downstream increased pattern; TP concentrations showed tributary and estuary increased pattern. The average SRP% in 2007 was almost three times of 2006, and average OP% in 2006 was more than 4 times of 2007. The NPase hydrolyzed up to 100% of OP% in the Bronx River water samples at 37˚C, indicating a potential threat of eutrophication of freshwater systems as the global rise in temperature may continue to occur.
REFERENCES
- C. Neal, H. P. Jarvie, W. R. J. illiams, M. Neal, H. Wickham and L. Hill, “Phosphorus-Calcium Carbonate Saturation Relationships in a Lowland Chalk River Impacted by Sewage Inputs and Phosphorus Remediation: An Assessment of Phosphorus Self-Cleaning Mechanisms in Natural Waters,” Science of The Total Environment, Vol. 282-283, 2002, pp. 295-310. doi:10.1016/S0048-9697(01)00920-2
- J. Wang and H. K. Pant, “Enzymatic hydrolysis of organic phosphorus in River Bed Sediments,” Ecological engineering, Vol. 36, No. 7, 2010, pp. 963-968. doi:10.1016/j.ecoleng.2010.03.006
- R. E. Hecky and P. Kilham, “Nutrient limitation of phytoplankton in freshwater and marine environments: a review of Recent Evidences of effects of enrichment,” Limnology and Oceanography, Vol. 33, No. 4, 1988, pp. 796-822. doi:10.4319/lo.1988.33.4_part_2.0796
- P. Monbet, I. D. McKelvie and P. J. Worsfold, “Dissolved Organic Phosphorus Speciation in the waters of the Tamar estuary (SW England),” Geochimica et Cosmochimica Acta, Vol. 73, No. 4, 2009, pp. 1027-1038. doi:10.1016/j.gca.2008.11.024
- D. J. Correll, “Phosphorus: a Rate Limiting Nutrient in Surface Waters,” Poultry science, Vol. 78, No. 5, 1999, pp. 674-682.
- A. C. Edwards and P. J. A. Withers, “Soil Phosphorus Management and Water Quality: A UK perspective,” Soil use and management, Vol. 14, No. 4, 1998, pp. 124-130. doi:10.1111/J.1475-2743.1998.TB00630.X
- V. H. Smith, G. D. Tilman and J. C. Nekola, “Eutrophication: impacts of excess Nutrient Inputs on Freshwater, Marine, and Terrestrial Ecosystems,” Environmental pollution, Vol. 100, No. 1-3, 1999, pp. 179-196. doi:10.1016/S0269-7491(99)00091-3
- C. Neal, H. P. Jarvie, S. M. Howarth, P. G. Whitehead, R. J. Williams, M. Neal, M. Harrow and H. Wickham, “The Water Quality of the River Kennet: Initial Observations on a Lowland Chalk Stream Impacted by Sewage Inputs and Phosphorus Remediation,” science of Total Environment, Vol. 251-252, 2000, pp. 477-496. doi:10.1016/S0048-9697(00)00400-9
- C. Neal, W. A. House, G. J. L. Leeks, B. A. Whitton and R. J. Williams, “Conclusions to the Special Issue of science of the Total Environment Concerning ‘The Water Quality of UK Rivers Entering the North Sea’,” science of total environment, Vol. 251-252, 2000, pp. 557-573. doi:10.1016/S0048-9697(00)00395-8
- W. A. House, T. D. Jickells, A. C. Edwards, K. E. Praska and E. H. Denison, “Reactions of phosphorus with sediments in fresh and Marine Waters,” Soil Use and Management, Vol. 14, No. 4, 1998, pp. 139-146. doi:10.1111/j.1475-2743.1998.tb00632.x
- F. I. Ormaza-Gonzalez and P. J. Statham, “A comparison of methods for the determination of dissolved and particulate phosphorus in Natural Waters,” Water research, Vol. 30, No. 11, 1996, pp. 2739-2747. doi:10.1016/S0043-1354(96)00081-4
- P. J. A. Withers and H. P. Jarvie, “Delivery and cycling of phosphorus in rivers: A review,” Science of the Total Environment, Vol. 400, No. 1-3, 2008, pp. 379-395. doi:10.1016/j.scitotenv.2008.08.002
- M. J. Bowes, W. A. House and R. A. Hodgkinson, “Phosphorus dynamics along a River Continuum,” science of total environment, Vol. 313, No. 1-3, 2003, pp. 199-212. doi:10.1016/S0048-9697(03)00260-2
- S. R. Carpenter, N. F. Caraco, D. L. Correll, R. W. Howarth, A. N. Sharpley and V. H. Smith, “Nonpoint pollution of surface waters with phosphorus and nitrogen,” Ecological applications, Vol. 8, No. 3, 1998, pp. 559-568. doi:10.1890/1051-0761(1998)008[0559:NPOSWW]2.0.CO;2
- A. M. Duda, “Addressing nonpoint sources of WaterPollution must become an international priority,” Water science technology, Vol. 28, No. 3-5, 1993, pp. 1-11.
- H. P. Jarvie, C. Neal, D. V. Leach, G. P. Ryland, W. A. House and A. J. Robson, “Major ion concentrations and the inorganic Carbon Chemistry of the Humber rivers,” science of total environment, Vol. 194-195, 2007, pp. 285- 302. doi:10.1016/S0048-9697(96)05371-5
- J. Wang and H. K. Pant, “Identification of Organic Phosphorus compounds in the Bronx River Bed Sediments by phosphorus-31 Nuclear Magnetic Resonance Spectroscopy,” Environmental monitoring and assessment, Vol. 171, No. 1-4, 2010, pp. 309-319 doi:10.1007/s10661-009-1280-3
- J. Wang, H. K. Pant, “Phosphorus Sorption Characteristics of the Bronx River Bed Sediments,” Chemical speciation and bioavailability, Vol. 22, No. 3, 2010, pp. 171- 181. doi:10.3184/095422910X12827492153851
- J. J. Maynard, A. T. O’Green and R. A. Dahlgren, “Bioavailability and fate of phosphorus in constructed Wetlands Receiving Agricultural Runoff in San Joaquin Valley, California,” Journal of environmental quality, Vol. 38, No. 1, 2009, pp. 360-372. doi:10.2134/jeq2008.0088
- Bronx River, “Use and Standards Attainment Project Preliminary Waterbody/Watershed Characterization Report,” 2006. http://www.hydroqual.com/projects/usa/allprojects/pdfs/characterization_pdfs/Bronx_River.PDF
- U.S. Environmental Protection Agency, “ESS method 310.1: Ortho-phosphorus, dissolved automated, ascorbic acid,” Environmental Sciences Section Inorganic Chemistry Unit, Madison, 1992.
- U.S. Environmental Protection Agency, “Method 365.4. Determination of total phosphorus in Kjeldahl digestion by Semi Automated Colorimetry,” Brazos River Authority, Waco, 2003.
- M. A. Tabatabai, “Soil enzymes,” In: A. L. Miller and R. H. Keeney, eds., Chemical and microbiological properties, American society of Agronomy, Madison, 1982, pp. 903-947.
- H. K. Pant, K. R. Reddy and F. E. Dierberg, “Bioavailability of organic phosphorus in a Submerged Aquatic Vegetation-Dominated Treatment Wetland,” Journal of environmental quality, Vol. 31, No. 5, 2002, pp. 1748- 1756. doi:10.2134/jeq2002.1748
- G. S. Toor, L. M. Condron, H. J. Di, K. C. Cameron and B. J. Cade-Menun, “Characterization of organic phosphorus in leachate from a Grassland Soil,” Soil biology and biochemistry, Vol. 35, No. 10, 2003, pp. 1317-1323. doi:10.1016/S0038-0717(03)00202-5
- E. Spitzer, “Reducing harmful phosphorus pllution in the New York City reservoirs through the Clean Water Act’s ‘Total Maximum Daily Load’ Requirements: A Case Study of the New Croton Reservoir and recommendation to EPA. Phosphorus loads in the NYC Watershed Reservoirs,” 2006. http://www.oag.state.ny.us/press/reports/phosphorus/phosphorus_report.html
- H. M. Kunishi and D. E. Glotfelty, “Sediment, season, and Salinity Effects on phosphorus concentration in an estuary,” Journal of environmental quality, Vol. 14, No. 2, 1985, pp. 292-296. doi:10.2134/jeq1985.00472425001400020027x
- P. Vervier, S. Bonvallet-Garay, S. Sauvage, H. M. Valett and J. M. Sanchez-Perez, “Influence of the hyporheic zone on the Phosphorus Dynamics of a large Gravel-Bed River, Garonne River, France,” Hydrological processes, Vol. 23, No. 12, 2009, pp. 1801-1812. doi:10.1002/hyp.7319
- M. D. McDaniel and M. B. David, “Relationships between Benthic sediments and Water Column Phosphorus in Illinois Streams,” Journal of environmental quality, Vol. 38, No. 2, 2009, pp. 607-617. doi:10.2134/jeq2008.0094
- D. J. Evans and P. J. Johnes, “Physico-chemical controls on Phosphorus Cycling in two Lowland Streams. Part 1—the water column,” Science of the total environment, Vol. 329, No. 1-3, 2004, pp. 145-163. doi:10.1016/j.scitotenv.2004.02.018
- D. L. Correll, “Eutrophication trends in the water quality of the Rhode River (1971-1978),” in: B. J. Neilson and L. E. Cronin, eds., Estuaries and nutrients, Humana Press, Clifton, pp. 425-435.
- N. T. W. Ellwood, S. M. Haile and B. A. Whitton, “Aquatic Plant Nutrients, Moss Phosphatase Activities and tissue composition in four upland streams in northern England,” Journal of hydrology, Vol. 350, No. 3-4, 2008, pp. 246-260. doi:10.1016/j.jhydrol.2007.10.038
- E. K. Schendel, H. Schreier and L. M. Lavkulich, “Linkages between phosphorus index estimates and environmental Quality Indicators,” Journal of soil and Water Conservation, Vol. 59, No. 6, 2004, pp. 243-251.
- B. L. Turner, R. Baxter and B. A. Whitton, “Nitrogen and phosphorus in Soil Solutions and Drainage Streams in Upper Teesdale, Northern England: implications of organic compounds for Biological Nutrient Limitation,” Science of Total Environment, Vol. 314-316, 2003, pp. 153-170.
- A. J. Wade, C. Neal, C. Soulsby, R. Smart, S. J. Langan and M. S. Cresser, “Modeling Stream Water Quality under Varying Hydrological Conditions at Different Spacial Scales,” Journal of hydrology, Vol. 217, No. 3-4, 1999, pp. 266-283. doi:10.1016/S0022-1694(98)00295-9
- J. P. Grover, “Phosphorus-Dependent Growth Kinetics of 11 species of Freshwater Algae,” Limnology and oceanography, Vol. 34, No. 2, 1989, pp. 341-348. doi:10.4319/lo.1989.34.2.0341
- H. K. Pant and P. R. Warman, “Enzymatic hydrolysis of Soil Organic Phosphorus by Immobilized Phosphatases,” Biology and fertility of soils, Vol. 30, No. 4, 2000, pp. 306-311. doi:10.1007/s003740050008
- C. A. Shand and S. Smith, “Enzymatic release of phosphate from Model Substrates and P compounds in soil solution from a Peaty Podzol,” Biology and fertility of soils, Vol. 24, No. 2, 1997, pp. 183-187. doi:10.1007/s003740050229
- H. Kobori and N. Taga, “Phosphatase activity and its role in the mineralization of organic phosporus in coastal sea water,” Journal of Experimental Marine Biology and Ecology, Vol. 36, No. 1, 1977, pp. 23-29. doi:10.1016/0022-0981(79)90098-4