Energy and Power Engineering
Vol.09 No.10(2017), Article ID:79158,26 pages
10.4236/epe.2017.910041
Probabilistic Exergoeconomic Analysis of Transcorp Power Plant, Ughelli
Otujevwe Paul Ogbe, Nnamdi Benedict Anosike, Ugochukwu C. Okonkwo
Mechanical Engineeering Department, Nnamdi Azikiwe University, Awka, Nigeria

Copyright © 2017 by authors and Scientific Research Publishing Inc.
This work is licensed under the Creative Commons Attribution International License (CC BY 4.0).
http://creativecommons.org/licenses/by/4.0/


Received: July 13, 2017; Accepted: September 16, 2017; Published: September 19, 2017
ABSTRACT
In this study, the probabilistic exergoeconomic analysis was performed for four industrial gas turbine (GT) units comprising two (GT16 and GT19) units of 100 MW GE engine and two (GT8 and GT12) units of 25 MW Hitachi engine at Transcorp Power Limited, Ughelli. These four industrial GT engine units were modelled and simulated using natural gas as fuel. The design point (DP) simulation results of the modelled GT engines were validated with the available DP thermodynamic data from original equipment manufacturer (OEM). This was done before the off-design point (ODP) simulation was carried out which represents the plant operations. The results obtained from exergy analysis at full load operation show that the turbine has the highest exergy efficiency followed by compressor and combustion having the least. For turbines these were 96.13% for GT8 unit, 98.02% for GT12 unit, 96.26% for GT16 unit, and 96.30% for GT19 unit. Moreover, the combustion chamber has the highest exergy destruction efficiency of 55.16% GT8 unit, 56.58% GT12 unit, 43.90% GT16 unit, and 43.30% GT19 unit respectively. The exergy analysis results obtained from the four units show that the combustion chamber (CC) is the most significant exergy destruction with lowest exergy efficiency and highest exergy destruction efficiency of plant components. The exergoeconomic analysis results from four units showed combustion chamber exergy destruction cost of 531.08 $/h GT8 unit, 584.53 $/h GT12 unit, 2351.81 $/h GT16, and 2315.93 $/h GT19 unit. The probabilistic results and analysis based on the input parameters distributions were evaluated and discussed.
Keywords:
Exergy, Destruction, Efficiency, Exergoeconomic, Exergy Cost Rates, Part-Load, Probabilistic

1. Introduction
The uncertainty in energy prices and increase in demand coupled with stringent emission regulation has led researchers and industries to seek for more efficient energy systems with reduced thermal losses [1] [2] [3] [4] . In order to utilize the high economic and energy saving potential of a gas turbine power plant in simple and combined cycles modes, it is important to identify the deviation of performance parameters and their impact on the overall performance of the power plant. The exergy method is a performance analysis of a thermal system based on the second law of thermodynamics which extends beyond the limits of energy-based analysis since exergy is generally not conserved as energy but is destroyed in the system. The exergy method assists in identifying the source and magnitude of performance loss in a thermal system by measuring the irreversibilities that occur in different components and locations of the system [4] [5] [6] . Energy analysis is only able to quantify efficiency of plants without pin pointing components energy losses and cannot assess the qualities of the energy. To overcome this limitation, there is need of exergy analysis, which can not only determine magnitudes, location and causes of irreversibilities in the plants, but also provides more meaningful assessment of power plant components efficiency. Exergy analysis is a useful method to complement, not to replace the energy analysis [7] . The exergy analysis based on the second law of thermodynamics has found as useful method in design, evaluation, optimization and improvement of thermal power plants [8] [9] .
The application of exergy analysis in power plant such as gas turbine is very important because it helps to quantify and locate plant components with major energy losses which will then help the plant engineer make decisions and possibly optimize plant performance and minimize fuel consumption. With second law analysis (exergy) the engineer is able to bring about improvement of plant performance and develop new components or processes with minimum energy losses.
Bejan [10] developed the analysis methodology for gas turbine plants while Kotas [11] developed the method to determine chemical and physical exergies for various components. The distribution of the exergy losses in several plant components during the real time plant running conditions has been assessed to locate process irreversibilities [12] . Exergy is highest available shaft work, which in a certain circumstance could be acquired from a certain thermal system as it proceeds to a specified final state in equilibrium with its surroundings [13] [14] . Exergy is conserved when the process in a system and the environment is reversible, while it is destroyed in an irreversible process [15] .
According to Mahamud et al. [16] , improving efficiency of the energy systems is an essential option for the security of future energy and the reduction of CO2 emissions. According to Almutairi et al. [6] , that due to their high energy conversion efficiency, which is necessary in order to delay the depletion of non-re- newable resources, by reducing fossil fuel consumption, through utilizing and recovering part of the waste energy from a gas turbine engine and from an environmental perspective, it reduces greenhouse gas emissions, and, thus, the changes in the climate decrease significantly. The environment is significantly affected by inefficiencies within the power system. Ogaji [17] utilized first law to develop a computer simulation model for investigating the performance of various gas turbine cycles. Pankaj [18] verified the impact of high ambient air temperature on the performance of various gas turbine models utilizing performance data obtained for each model as a basis for comparison and proposed the Earth Tube Heat Exchanger (ETHE) technology as the most effective and economical inlet air cooling method. The importance of developing thermal systems that effectively use energy resources such as natural gas is apparent [19] . Effective use of energy resources is determined with both the first and second laws of thermodynamics. Energy cannot be destroyed; the idea that something can be destroyed is useful in the analysis of power plants and thermal systems [20] . This idea does not apply to energy, however, but to exergy. Many researchers suggested that the impact of energy resource utilization on the environment and the achievement of increased resource-utilization efficiency are best addressed by considering exergy [21] [22] . The main exergy analysis is to identify useful work (exergy) efficiencies, causes, true magnitudes of exergy losses, position and amount in the components and total plant [23] [24] . It is necessary to carry out this exergy analysis from time to time in gas power plant because it helps in assessing and evaluating the conditions of the gas turbine power plant.
It is useful to combine second law of thermodynamic with economic principles for the systematic study of energy systems. This combination forms the basis of the relatively new field of thermoeconomics or exergoeconomics. Exergoeconomics combines exergy analysis with conventional cost analysis in order to evaluate and optimize the performance of energy systems. Exergoeconomics is a tool used for improving overall system efficiency and lowering life cycle costs of a thermodynamic system. It incorporates the associated costs of the thermodynamic inefficiencies in the total product cost of an energy system [19] [25] [26] [27] . Exergoeconomic analysis estimates the unit cost of product quantifies monetary loss due to irreversibility.
According to Anosike [28] , probabilistic approach as compare to conventional deterministic approach is much more realistic way of describing uncertainties in variables for a risk analysis. The most sensitive variables as revealed by sensitivity analysis result are the focus of the probabilistic analysis. The first element of the probabilistic approach is building of the probability distributions of the highly sensitive input variables to replace the single point values used during deterministic evaluation.
The most comprehensive approach to take into account a wide range of uncertainties in key risks is to use a probabilistic assessment [29] . Monte Carlo simulation and related techniques are capable of addressing many of the limitations of decisions analysis and of sensitivity analysis. The Monte Carlo simulation approach consists in characterizing the uncertainty in model outputs by assigning probability distributions to inputs, and to simulate the output distribution by repeated sampling. In this way, Monte Carlo simulation provides a much more comprehensive view of what may happen. It tells not only what could happen, but how likely it is to happen. Probabilistic approaches are powerful tools to give insights on the impact of uncertainties and risks on power investments [30] . The methodology has been used by many researchers in other areas. Kurz et al. [31] conducted a probabilistic approach for compressor sizing and plant design. Singh [32] and Singh et al. [33] have discussed probabilistic approaches to individual equipment items, such as turbine blades or impellers. Roques et al. [30] did a study using probabilistic analysis to value power generation investments under uncertainty on three base-load technologies (combined cycle gas turbine, coal plant, and nuclear power plant), and demonstrate using three case studies how such a probabilistic approach provides investors with a much richer analytical framework to assess power investments in liberalised markets. Anosike [28] , in his thesis work use probalistic approach to analyze the technoeconomic evaluation of flared natural gas reduction and energy recovery using gas-to-wire scheme. Hanak [34] carried out probabilistic assessment of a coal-fired power plant. Feretic and Tomsic [35] , noted that general analyses which deals with future predictions in real-world somehow involves element of uncertainty and are too complex to solve by a strict analytical method.
Monte Carlo simulation provides a number of advantages over deterministic analysis:
v Probabilistic Results. Results show not only what could happen, but how likely each outcome is.
v Graphical Results. Because of the data a Monte Carlo simulation generates, it is easy to create graphs of different outcomes and their chances of occurrence. This is important findings to other stakeholders.
v Sensitivity Analysis. With just a few cases, deterministic analysis makes it difficult to see which variables impact the outcome the most. In Monte Carlo simulation, it is easy to see which inputs had the biggest effect on bottom-line results.
v Scenario Analysis. In deterministic models, it is very difficult to model different combinations of values for different inputs to see the effects of truly different scenarios. Using Monte Carlo simulation, analysts can see exactly which inputs had which values together when certain outcomes occurred. This is invaluable for pursuing further analysis.
v Correlation of Inputs. In Monte Carlo simulation, it is possible to model interdependent relationships between inputs variables. It is important for accuracy to represent how, in reality, when some factors go up, others go up or down accordingly.
A probabilistic approach using Monte Carlo simulation and risk analysis is presented, that more accurately defines uncertainties and its impact on plant performance. The problem with this approach is that the true level of success may not be well conveyed.
Specifically in this work, the use of probabilistic tool allows tackling unpredictability of component performance due to varying ambient conditions (at least temperature), as well as power plant part-load operations.
2. Power Plant Overview
The plant under consideration consists of a 25 MW (GT8 and GT12) Hitachi H25 and 100 MW (GT16 and GT19) GE Frame 9 single shaft open cycles all operated at 50 Hz located at Ughelli, Nigeria. Each generates electricity to the National Grid and use natural gas as fuel. The simplified schematic diagram of the plant is shown in Figure 1. The plant consists of three (3) main components, namely; axial flow air compressor (C), combustion chamber (CC) turbine (T) and Wnet is available energy for generator.
3. Concept of Exergy
Energy manifests itself in many forms, which are either internal or transient, and energy can be converted from one form to another [15] . Energy analysis is used to assess the way energy is transfer or converted in a process involving the physical or chemical processing of materials. It usually involves the performing of energy balances, which are based on the First Law of Thermodynamics. Energy balances treat all forms of energy as equivalent, without differentiating between different grades of energy crossing the system boundary [11] . Generally, energy balances provide no information on the degradation of energy or resource during a process and does not quantify the various energy and material stream flowing through and exiting the system.
Exergy is defined as the maximum useful work which could be produced by a stream or system in a specified environment. Exergy is a measure of the maximum capacity of a system to perform useful work as it proceeds to a specified final state in equilibrium with its surroundings. The available work that can be extracted from an energy source depends on the state of the source’s surroundings [36] . An exergy balance applied to a process or a whole plant tells us how

Figure 1. Schematic diagram of the gas power plant.
much of the usable work potential, or resource supplied as the input to the system under consideration has been consumed by the process. Exergy provides a quantitative basis to measure the degradation of energy in conversion processes.
Exergy of a stream of matter is distinctly divided into four components: kinetic, potential, physical and chemical, in the absence of nuclear effects, magnetism, electricity etc. The exergy balance of a system can be generally written as:
(1)
The kinetic and potential energies of a stream of substance are ordered forms of energy and they depend only on the mass and as such fully convertible to work. Therefore, when evaluated in relation to the environmental reference state, they are equal to kinetic and potential exergy.
(2)
(3)
V and Z are important where there is direct interaction of stream with the environment. Kinetic and potential energy are neglected in this study due to their insignificant.
Physical exergy is the maximum useful work that can be extracted from a unit mass of substance passing through a specified state to the environmental state by physical processes involving only thermal interaction with the environment. The physical exergy consists of two parts, mechanical and thermal exergy [6] [11] and it is given as:
(4)
When the specified state is equal to environmental state , by ideal gas relation, Equation (4) becomes:
(5)
Chemical exergy represents the maximum useful energy that can be extracted while the flow moves from an environmental state to a dead state due to differences in concentration and molecular structure. In the environmental state, the system is mechanically and thermally at equilibrium state, but not chemically [6] . The chemical exergy for fuel stream is given by:
(6)
3.1. Exergy Analysis
The following assumptions were made considering the second law of thermodynamics analysis:
1) Heat losses from all plant components are negligible.
2) Kinetic and potential energy components of exergy are neglected.
3) Fuel (natural gas) is taken as methane and modeled as an ideal gas.
4) Pressure drop in the combustion chamber assumed to be 3%.
5) The ambient conditions of temperature and pressure are 25˚C and 1.013 bar.
The exergy balance equation for a control volume in steady state according to [11] is given as:
(7)
The subscripts i refer to conditions at inlet, e and j exits of control volume boundaries and o is the reference state.
Also, the thermomechanical exergy stream may be decomposed into mechanical and thermal components of exergy [37] [38] . It is given as:
(8)
where the subscripts i and j denote, respectively, exergy flow streams entering or leaving the plant component. M, T and P represent material components under study, thermal property and mechanical property respectively.
The thermal and mechanical components of the exergy stream for an ideal gas with constant specific heat expressed by [39] are given in Equations (9) and (10).
(9)
(10)
where, and are the pressure and temperature, respectively, at standard state; is the mass flow rate of the working fluid; R is the gas constant; is the specific heat at constant pressure.
With the decomposition of an exergy stream defined in eqn. (7), the general exergy-balance equation is written as stated by [5] [40] as:
(11)
The term in Equation (11) represents the exergy rate of power output by the material component under study; denotes the rate of exergy flow of fuel in the plant; is the entropy transfer rate; is the temperature of the source from which the heat is transferred to the working fluid; the fourth right- hand term is the exergy destroyed in the component and in the fourth right-hand term denotes the heat transfer rate between the component and the environment.
3.2. Exergy Balance Equations of Gas Turbine Plant
The exergy balance equation for each component in the power station can be derived from the general exergy balance equation given in Equation (11). The exergy balance equations for each component are as follows using Figure 1.
Compressor:
(12)
Combustion chamber:
(13)
Turbine:
(14)
Chemical exergy of fuel (Methane):
(15)
3.3. Exergy Destruction
Exergy is not conserved but destroyed in irreversible systems. The irreversibilities are caused by internal irreversibilities such as friction, unrestrained expansion, mixing and chemical reaction and external irreversibilities arise from heat transfer through a finite temperature difference. The energy associated with material or energy stream is rejected to the environment whenever there is exergy lost in the system [41] . The exergy destroyed in each of the components and for the overall plant as stated in [7] is shown as follows in Equations (16)-(18).
Exergy destroyed in the compressor, :
(16)
Combustion chamber, :
(17)
Turbine, :
(18)
Total exergy destroyed in the plant, :
(19)
3.4. Exergoeconomic Analysis
Exergoeconomic based on the concept that exergy is the only rational basis for assigning monetary costs to the interactions that a system experiences with its surroundings and to the sources of thermodynamic inefficiencies within it [19] . There are different exergoeconomic methodologies discussed in the literatures [27] [38] [42] [43] . In this study Specific Exergy Costing (SPECO) method is used. This method is based on specific exergies and costs per exergy unit, exergetic efficiencies, and the auxiliary costing equations for components of thermal system [19] .
Exergoeconomic analysis of energy conversion system, Tsatsaronis [27] proposed four steps which were followed in this study. These steps are:
・ Exergy analysis.
・ Economic analysis of each of the plant component.
・ Estimation of exergetic costs associated with each flow and
・ Exergoeconomic evaluation of each system component.
3.4.1. Economic Analysis
The economic analysis, conducted as part of the exergoeconomic analysis, provides the appropriate monetary (cost) values associated with the investment, operating (excluding fuel), maintenance and fuel costs of the system being analyzed [27] [44] . These values are used in the cost balances. The annualized (levelized) cost method of Moran [45] is used to estimate the investment (capital) cost of various plant components in this study. The amortization cost for a particular plant component may be written [38] as:
(20)
The salvage value (SV) at the end of the nth year is taken as 10% of the initial investment for component or purchase equipment cost (PEC). The present worth of the component may be converted to the annualized cost by using the capital recovery factor [38] [46] , i.e.
(21)
where, .
The capital recovery factor (CRF) depends on the interest rate as well as estimated equipment lifetime [47] , i is the interest rate and n is the total operating period of the plant in years. Equations for calculating the purchase equipment costs (PEC) for the components of the power station are as follows [19] [48] [49] :
Compressor, :
(22)
Combustion Chamber, :
(23)
Turbine, :
(24)
For converting capital investment cost into cost per time unit, one may write [46] as:
(25)
is the annual number of operation hours of the unit and maintenance cost is taken into consideration through the factor for each plant component [46] .
The cost associated with fuel is obtained from
(26)
where the fuel cost per energy unit (on an LHV basis) is [49] .
3.4.2. Exergy Costing
The exergy analysis yields the desired information for a complete evaluation of the design and performance of an exergy system from the thermodynamic viewpoint. With this, the plant operator needs to know how much the exergy destruction in a plant component costs and knowing this cost is very useful in improving the cost effectiveness of the plant [27] .
To perform exergy costing calculations, the schematic diagram of the gas turbine power plant components Figure 1, must be considered under control volumes, on which exergetic cost balance equation been applied on individual component. For a component that receives heat and produces work, the exergetic balance may be written [50] [51] as follows:
(27)
(28)
(29)
The cost balance for each component and the required auxiliary equations of Figure 1 are as follows:
Compressor:
(30)
Combustion Chamber:
(31)
Turbine:
(32)
The numbers in subscripts denote the states of material streams described in Figure 1. The cost-balance Equations (30) - (32) and we have 7 unknowns. Table 1 below shows the fuel, product and loss (F/P/L) stream of each component. Auxiliary equations for exergy costing can be obtained by applying fuel (“F”) and product (“P”) rules to each component [52] . These are:

Table 1. Fuel, Product and Loss (F/P/L) Stream of each component.
(33)
(34)
(35)
A zero unit cost is assumed for air entering the air compressor, which is:
(36)
Solving the Equations (30) - (36) simultaneously, one may obtain the cost flow rate and average unit cost at each inlet and outlet of the kth component.
3.4.3. Exergoeconomic Evaluation of Each Plant Component
In a complete exergoeconomic evaluation of a plant, certain variables play an important role which is based on the following variable calculated for the kth component. These are the average cost of fuel , average cost of product , cost rate exergy destruction , relative cost difference and exergoeconomic factor .
Tsatsaronis [27] expressed the average cost per unit of fuel exergy and the average cost per unit of exergy of the product for the kth component as:
(37)
(38)
The cost rate associated with exergy destruction is given as:
(39)
The relative cost difference is written [23] as:
(40)
(41)
4. Results and Discussion
4.1. Exergy Results
The average operating data used in this analysis were values obtained from operator’s manual and logbook of Transcorp gas turbine power plants for the period of five years (2010-2014) as presented in Table 2.
In this analysis, standard reference ambient temperature and pressure are assumed 25˚C and 1.013 bar respectively. The exergy flow rates at the inlet and outlet of each component of the plants were evaluated. An exergy balance for the
Table 2. Average operating data for the gas turbine power plant.
components of the gas turbine plants and the total plant is at this point performed and the net exergy flow rates crossing the boundary of each component of the plants, together with the exergy destruction in each component are calculated and are as shown in Table 3.
The exergy analysis results obtained at full load operation show that the turbine has the highest exergy efficiency of 96.13% for GT8 unit, 98.02% for GT12 unit, 96.26% for GT16 unit, 96.30% for GT19 unit, followed by compressor 94.23% for GT8 unit, 90.89% for GT12 unit, 88.38% for GT16 unit, 88.58% for GT19 unit and combustion chamber having the lowest 44.84% forGT8 unit, 43.42% for GT12 units, 56.10% for GT16 unit, 56.69% for GT19 unit. Moreover, the combustion chamber has the highest exergy destruction efficiency of 55.16% GT8 unit, 56.58% GT12 unit, 43.90% GT16 unit, and 43.30% GT19 unit respectively.
The results of exergy analysis from the four units show that the combustion chamber is the most significant exergy destruction with lowest exergy efficiency and highest exergy destruction efficiency of plant components as shown in Figure 2 and Figure 3. The lower value of exergy efficiency and higher value exergy destruction efficiency of the combustion chamber shows that more irreversibility
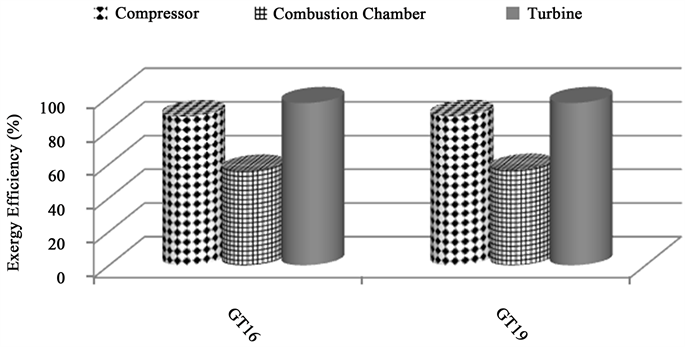
Figure 2. Exergy efficiency of components of each plant.
Table 3. Results of exergy analysis.
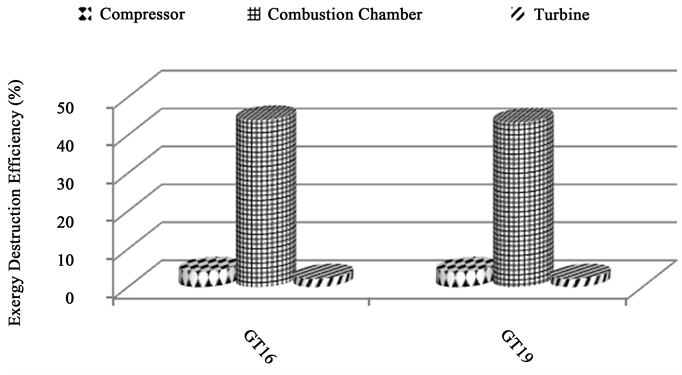
Figure 3. Exergy destruction efficiency of components of each plant.
and degradation occur in this section and in agreement with what was obtained in [5] [19] [53] [54] . Figure 4 and Figure 5 show the comparison of the exergy efficiencies and exergy destruction efficiencies of the compressor, combustion chamber, turbine and the total plant when the ambient temperature increases. It is observed that the combustion chamber has the lowest exergy efficiencies and highest exergy destruction efficiencies as the ambient temperature increases.
Figure 6 shows the exergy destruction of two plants operating with a wide range of load variations. The results show that, at part load, the exergy destruction efficiency of each component increases with decrease in loads, with combustion chamber having the highest exergy destruction. Figure 7 and Figure 8 show the percentage variation of exergy destruction of each component with respect to load variations and it is observed that the turbine has higher percentage variation of exergy destruction as the plant operates at part-load. It means that operating at part-load consequently caused high exergy destruction in plant components, hence reduced the overall plant performance. Therefore, plant should always be run on maximum or full load in order to reduce the exergy destruction of each component and overall plant.
4.2. Exergoeconomic Analysis
Before now, the method of improving plant component and how to improve it were solely based on thermodynamics. The thermodynamic analysis is very important but the exergonomic analysis which is based on cost associated with exergy of a component has an important role to play and has more significant economically when analyzing a system. The knowledge of the cost of exergy in a component is a very useful parameter for improving the cost-effectiveness of a plant [27] . Tables 4-7 present the exergoeconomic parameters for each component of the plants. The levelized cost rates and average unit exergy cost at various state points of the plant were solved using Equations (30)-(36) simultaneously.

Figure 4. Change of exergy efficiency with ambient temperature.
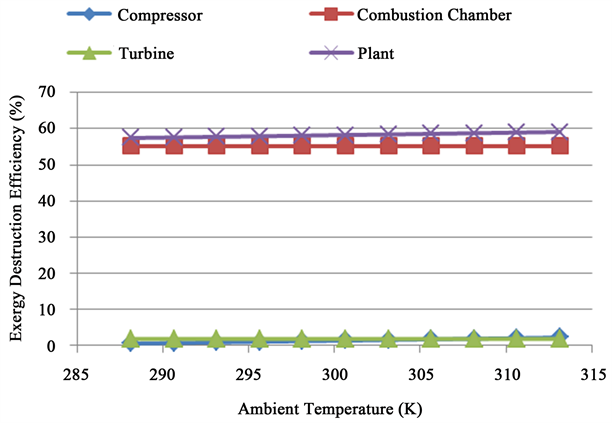
Figure 5. Change of exergy destruction efficiency with ambient temperature.
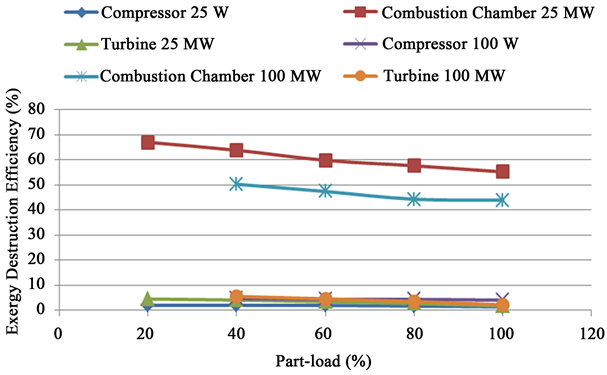
Figure 6. Exergy destruction efficiency with part-loads of 25 MW and 100 MW.
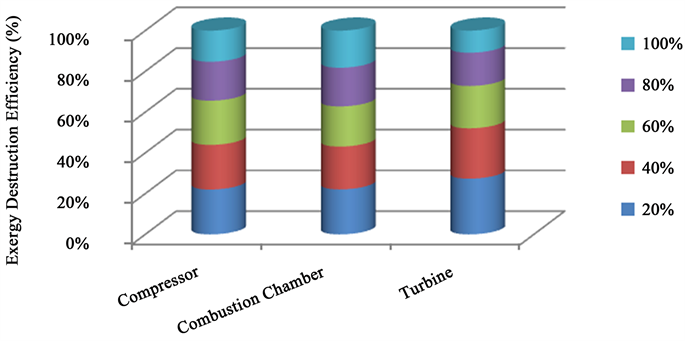
Figure 7. Percentage variation of exergy destruction with five part loads of 25 MW.

Figure 8. Percentage variation of exergy destruction with four part loads of 100 MW.
Table 4. Exergoeconomic parameters of gas turbine components of GT8.
Table 5. Exergoeconomic parameters of gas turbine components of GT12.
Table 6. Exergoeconomic parameters of gas turbine components of GT16.
Table 7. Exergoeconomic parameters of gas turbine components of GT19.
The unit cost of electricity produced in each unit is given as 7.38 $/GJ GT8, 7.362 $/GJ GT12, 9.00 $/GJ GT16 and 8.99 $/GJ GT19. The exergoeconomic parameters considered in this study include average costs per unit of fuel exergy CF and product exergy CP, rate of destruction , cost rate of exergy destruction , investment cost rate , and exergoeconomic factor . The components with the highest value of and lowest exergoeconomic factor are considered the most important components from an exergoeconomic viewpoint. This provides a means of determining the level of priority a component should be given attention with respect to improving of the plant.
For the four units considered, the combustion chamber has the highest value of and lowest value of exergoeconomic factor , this implies that the component accounts for the highest cost rate of exergy destruction. Hence, the component efficiency should be improved by increasing the capital investment costs . This can be achieved by increasing the turbine inlet temperature T3. The maximum turbine inlet temperature (TIT) of the combustion chamber is limited by the metallurgical conditions [19] [48] .
4.3. Probabilistic Performance Analysis
Probability distributions were constructed using curve fitting for the input parameters of ambient temperature (AT) and turbine inlet temperature (TIT). The distribution type and statistic for the input parameter are defined in two scenarios as shown in Table 8 and Table 9. Varying ambient temperature and protracted part-load operation of a gas turbine power plant are major causes of variation in performance parameter of power plant and the power output of a gas turbine is a direct function of turbine inlet temperature (TIT) and it is limited to metallurgical condition of turbine blades.
Table 8. Ambient temperature scenario.
Table 9. Part-load scenario.
Ambient temperature scenario, the ambient temperature (AT) was used to produce uniform distribution, showing probability cumulative distribution (see Figure 9 and Figure 10), which was employed for the probabilistic analysis. The minimum value used is 288.15 K and maximum value used is 313.15 K. Figure 11 is the cumulative probability distribution of the major components of the plant which shows the possible exergy destruction cost and probability of occurrence with respect to varying ambient temperature. The predictions indicate that considerable level of uncertainty cause the exergy destruction cost to vary between 14 $/h and 69 $/h for compressor and turbine while high level of uncertainty cause it vary between 473 $/h and 538 $/h for combustion chamber.
Part-load scenario, the ambient temperature (AT) produced uniform distribution, showing probability cumulative distribution (see Figure 9). The turbine inlet temperature (TIT) produced ExtValueMin distribution (see Figure 12). Figure 13 is the cumulative probability distribution of the major components of the plant which shows the possible exergy destruction cost and probability of occurrence with respect to part-load operations. The predictions indicate that high level of uncertainty cause the exergy destruction cost to vary between 400 $/h and 600 $/h for the combustion chamber. Compressor and turbine exergy destruction vary between negative infinity and 210 $/h and the probability between this range is 95% percentile.
5. Conclusions
In this study, the probabilistic exergoeconomic analysis was performed for four industrial gas turbine (GT) units comprising of two (GT16 and GT19) units of 100 MW GE engine and two (GT8 and GT12) units of 25 MW Hitachi engine at Transcorp Power Limited, Ughelli. These four industrial GT engine units were modelled and simulated using natural gas as fuel. The design point (DP) simulation results of the modelled GT engines were validated with the available DP thermodynamic data from original equipment manufacturer (OEM).
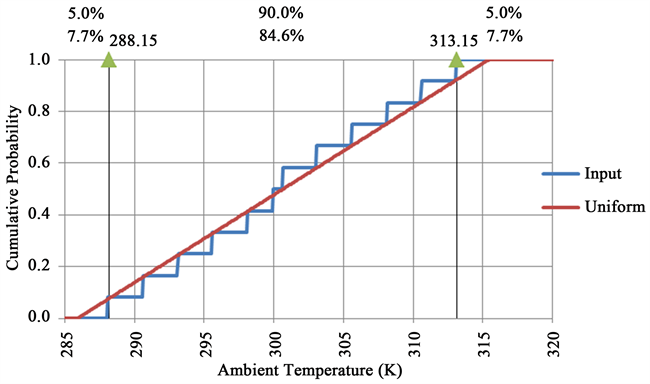
Figure 9. Uniform distribution of ambient temperature.
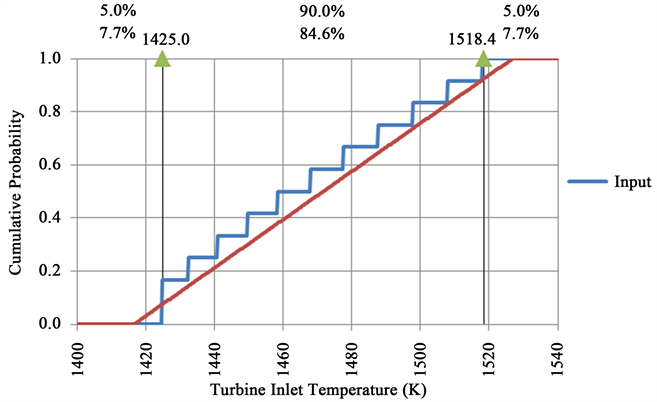
Figure 10. Uniform distribution of temperature inlet temperature.
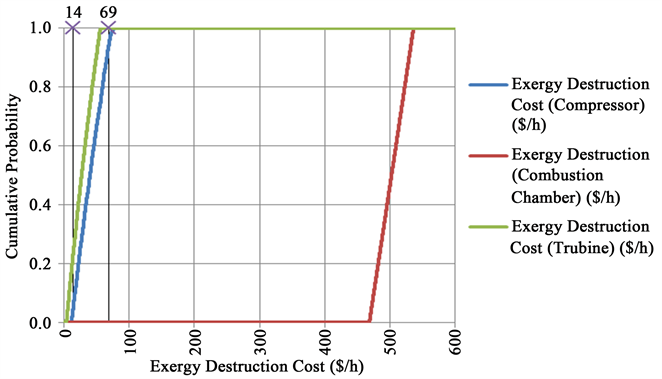
Figure 11. Cumulative probability density of exergy destruction cost with Ambient Scenario.
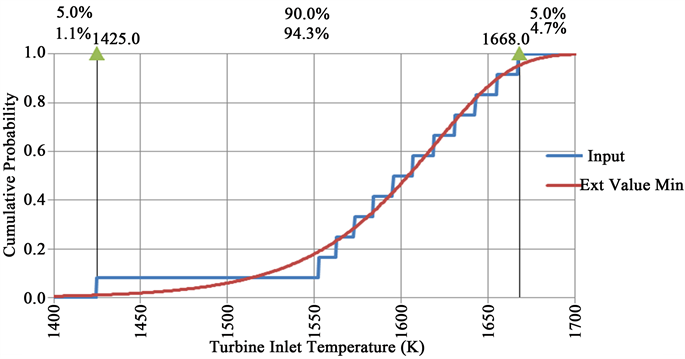
Figure 12. Ext value min distribution of temperature inlet temperature.
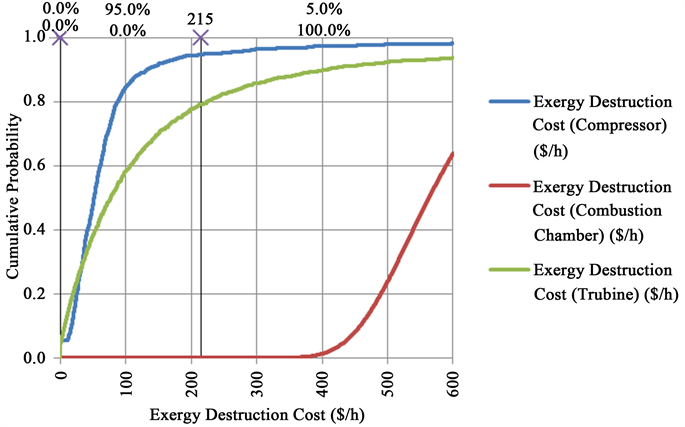
Figure 13. Cumulative probability density of exergy destruction cost.
The results obtained from exergy analysis at full load operation show that the turbine has the highest exergy efficiency of 96.13% for GT8 unit, 98.02% for GT12 unit, 96.26% for GT16 unit, 96.30% for GT19 unit, followed by compressor 94.23% for GT8 unit, 90.89% for GT12 unit, 88.38% for GT16 unit, 88.58% for GT19 unit and combustion chamber having the lowest 44.84% forGT8 unit, 43.42% for GT12 units, 56.10% for GT16 unit, 56.69% for GT19 unit. Moreover, the combustion chamber has the highest exergy destruction efficiency of 55.16% GT8 unit, 56.58% GT12 unit, 43.90% GT16 unit, and 43.30% GT19 unit respectively. The exergy analysis results obtained from the four units show that the combustion chamber (CC) is the most significant exergy destruction with lowest exergy efficiency and highest exergy destruction efficiency of plant components, which is caused by high irreversibility and large temperature difference between the flame and the working fluid [19] . However, increase in turbine inlet temperature (TIT) reduces the exergy destruction efficiency as obtained from the results.
The results of exergoeconomic analysis from four units show the exergy destruction cost of combustion chamber to be 531.08 $/h GT8 unit, 584.53 $/h GT12 unit, 2351.81 $/h GT16 unit, and 2315.93 $/h GT19 unit. Exergy destruction cost of turbine: 50.99 $/h GT8 unit, 27.84 $/h GT12 unit, 277.36 $/h GT16 unit and 274.46 $/h GT19 unit, also exergy destruction cost of compressor: 42.51 $/h GT8 unit, 69.15 $/h GT12 unit, 556.31 $/h GT16 unit, and 547.60 $/h GT19 unit respectively. The exergoeconomic analysis results from the four units show that the combustion chamber has the highest cost of exergy destruction as compared to other components and lowest value of exergoeconomic factor , which implies that the component accounts for the highest cost rate of exergy destruction. Hence, the component efficiency should be improved by increasing the capital investment costs .
The probabilistic analysis results show the possible outputs and their probability of occurrence in each component of the plant. The analysis results show not only what could happen, but how likely it is to happen unlike deterministic analysis (single point estimates). With probability analysis, it shows the probability when component is having low or high exergy destruction and range at which to operate to reduce exergy destruction and increase exergy efficiency in plant.
Acknowledgements
Special thanks to the Mechanical Engineering Department, Nnamdi Azikiwe University, Awka, Anambra State, Nigeria.
Cite this paper
Ogbe, O.P., Anosike, N.B. and Okonkwo, U.C. (2017) Probabilistic Exergoeconomic Analysis of Transcorp Power Plant, Ughelli. Energy and Power Engineering, 9, 588-613. https://doi.org/10.4236/epe.2017.910041
References
- 1. Adewusi, S.A. and Zubair, S.M. (2004) Second Law Based Thermodynamic Analysis of Ammonia-Water Absorption Systems. Energy Conversion and Management, 45, 2355-2369. https://doi.org/10.1016/j.enconman.2003.11.020
- 2. Calise, F., d’Accadia, M.D. and Piacentino, A. (2015) Exergetic and Exergoeconomic Analysis of a Renewable Polygeneration System and Viability Study for Small Isolated Communities. Energy, 92, 290-307. https://doi.org/10.1016/j.energy.2015.03.056
- 3. Moussawi, H.A., Fardoun, F. and Louahlia-Gualous, H. (2016) Review of Tri-Generation Technologies: Design Evaluation, Optimization, Decision-Making, and Selection Approach. Energy Conversion and Management, 120, 157-196. https://doi.org/10.1016/j.enconman.2016.04.085
- 4. Abusoglu, A. and Kanoglu, M. (2009) Exergetic and Thermoeconomic Analyses of Diesel Engine Powered Cogeneration: Part 2—Formulations. Applied Thermal Engineering, 29, 242-249. https://doi.org/10.1016/j.applthermaleng.2008.02.026
- 5. Abam, D.S.P. and Moses, N.N. (2011) Computer Simulation of Gas Turbine Performance. Global Journal of Researches in Engineering, 11, 1-9.
- 6. Almutairi, A, Pilidis, P. and Al-Mutawa, N. (2015) Energetic and Exergetic Analysis of Combined Cycle Power Plant: Part-1 Operation and Performance. Energies, 8, 14118-14135. https://doi.org/10.3390/en81212418
- 7. Egware, H.O. and Obanor A.I. (2013) Exergy Analysis of Omotosho Phase 1 Gas Thermal Power Plant. International Journal of Energy and Power Engineering, 2, 197-203. https://doi.org/10.11648/j.ijepe.20130205.13
- 8. Kaushik, S.C., Reddy, V.S. and Tyagi, S.K. (2011) Energy and Exergy Analyses of Thermal Power Plants: A Review. Renewable and Sustainable Energy Reviews, 15, 1857-1872. https://doi.org/10.1016/j.rser.2010.12.007
- 9. Sue, D.C. and Chuang, C.C. (2004) Engineering Design and Exergy Analysis for Combustion Gas Turbine Based Power Generation System. Energy, 29, 1183-1205. https://doi.org/10.1016/j.energy.2004.02.027
- 10. Bejan, A. (2006) Advanced Engineering Thermodynamics. 3rd Edition, John Wiley & Sons Inc., New York.
- 11. Kotas, T.J. (1995) The Exergy Method of Thermal Plant Analysis. Reprint Edition, Krieger Publishing Company, Malabar, Florida.
- 12. Dincer, I. and Rosen, M.A. (2007) Exergy, Energy, Environment and Sustainable Development. Exergy Hand Book. Elsevier, London.
- 13. Yilmazoglu, M.Z. and Amirabedin, E. (1999) Second Law and Sensitivity Analysis of a Combined Cycle Power Plant in Turkey. Journal of Thermal Science and Technology, 31, 41-50.
- 14. Aravind, P.V. (1999) Thermodynamics Analysis of Fuel Cell Oxide. John Wiley & Sons Inc., New York.
- 15. Dincer, I. and Cengel, Y.A. (2001) Energy, Entropy and Exergy Concepts and Their Roles in Thermal Engineering. Entropy, 3, 116-149. https://doi.org/10.3390/e3030116
- 16. Mahamud, R., Khan, M.M.K. and Rasul, M.G. (2013) Thermal Power Plants— Advanced Applications, Central Queensland University. School of Engineering and Built Environment, Rockhampton, Queensland, 3-28. https://doi.org/10.5772/55574
- 17. Ogaji, S.T. 1997) Computer Simulation Model for Industrial Gas Turbine Performance. Master’s Thesis, Department of Mechanical Engineering, Rivers State University of Science and Technology, Port Harcourt.
- 18. Pankaj, K.P. (2003) Better Power Generation from Gas Turbine along with Improved Heat Rate. Proceedings of the 2003 Powergen International Conference, Atlanta, 1, 1-6.
- 19. Oyedepo, S.O., Fagbenle, R.O. and Adefila, S.S. (2014) Exergetic and Exergoeconomic Analysis of Selected Gas Turbine Power Plants in Nigeria. Proceedings of HEFAT 2014—The 10th International Conference on Heat Transfer, Fluid Mechanics and Thermodynamics, Orlando, 14-16 July, 1527-1536.
- 20. Goodarzian, H. and Shobi, O.M. (2010) Effect of Design Parameters on the Exergetic of Gas-Turbine Power Plants. World Applied Sciences Journal, 8, 589-595.
- 21. Moran, M.J. and Sciubba, E. (1994) Exergy Analysis, Principles and Practice. Journal of Engineering for Gas Turbines and Power, 116, 285-290. https://doi.org/10.1115/1.2906818
- 22. Moran, M.J. and Shapiro, H.N. (2006) Fundamentals of Engineering Thermodynamics. 5th Edition, John Wiley & Sons, Inc., New York.
- 23. Ghazikhani, M. and Ahamadzadehtalatapeh, M. (2010) Experimental Investigation of Exergy Destruction in an 8kW Power Plant. International Journal of Energy and Environment, 1, 815-822.
- 24. Kaushik , S.C., Mishra, R.D. and Singh, N. (2000) Second Law Analysis of a Solar Thermal Power System. International Journal of Solar Energy, 20, 39-53. https://doi.org/10.1080/01425910008914358
- 25. Seyyedi, S.M., Ajam, H. and Farahat, S. (2010) A New Iterative Approach to the Optimization of Thermal Energy Systems: Application to the Regenerative Braytoncycle. Proceedings of the Institution of Mechanical Engineers, Part A, Journal of Power and Energy, 224, 313. https://doi.org/10.1243/09576509JPE862
- 26. El-Sayed, M. (2003) The Thermoeconomics of Energy Conversion. Elsevier: London.
- 27. Tsatsaronts, G. (1993) Thermo-Economic Analysis and Optimization of Energy Systems. Progress in Energy and Combustion Science, 19, 227-257. https://doi.org/10.1016/0360-1285(93)90016-8
- 28. Anosike, N.B. (2013) Technoeconomic Evaluation of Flared Natural Gas Reduction and Energy Recovery Using Gas-to-Wire Scheme. Ph.D. Thesis, Cranfield University, Cranfield.
- 29. Rode, D. and Fishbeck, P. and Dean, S. (2001) Monte Carlo Methods for Appraisal and valuation: A Case Study of a Nuclear Power Plant. Journal of Structured and Project Finance, 7, 38-48. https://doi.org/10.3905/jsf.2001.320257
- 30. Roques, F.A., Nuttall, W.J. and Newbery, D.M. (2006) Using Probabilistic Analysis to Value Power Generation Investments under Uncertainty. Electricity Policy Research Group, University of Cambridge, Cambridge, 1-34.
- 31. Kurz, R., Thorp J.M., Zentmyer, E.G. and Brun, K. (2013) A Probabilistic Approach for Compressor Sizing and Plant Design. Proceedings of the Forty-Second Turbomachinery Symposium, Houston, 30 September-3 October 2013, 1-10.
- 32. Singh, M.P. (1985) Turbine Blade Dynamics: A Probabilistic Approach, In: Vibrations of Blades and Bladed Disc Assemblies, ASME Book No. H000335, 41-48.
- 33. Singh, M.P., Sullivan, W.E., Donald, G. and Hudson, J. (2004) Probabilistic Life Assessment of an Impeller with Discontinuities. Proceeding of 33rd Turbomachinery Symposium, Houston, 15-23.
- 34. Hanak, D.P., Kolios, A.J. and Manovic, B.V. (2015) Probabilistic Performance Assessment of a Coal-Fired Power Plant. Applied Energy, 139, 350-364. https://doi.org/10.1016/j.apenergy.2014.10.079
- 35. Feretic, D. and Tomsic, Z. (2005) Probabilistic Analysis of Electrical Energy Costs Comparing: Production Costs for Gas, Coal and Nuclear Power Plants. Energy Policy, 33, 5-13. https://doi.org/10.1016/S0301-4215(03)00184-8
- 36. Rosen, M.A. and Dincer, I. (2004) Effect of Varying Dead-State Properties on Energy and Exergy Analyses of Thermal systems. International Journal of Thermal Sciences, 43, 121-133. https://doi.org/10.1016/S0301-4215(03)00184-8
- 37. Ebadi, M.J. and Gorji-Bandpy, M. (2005) Exergetic Analysis of Gas Turbine Plant. International Journal of Exergy, 2, 31-39. https://doi.org/10.1504/IJEX.2005.006431
- 38. Kim, S.M., Oh, S.D., Kwon, Y.H. and Kwak, H.Y. (1998) Exergoeconomic Analysis of Thermal Systems. Energy, 23, 393-406. https://doi.org/10.1016/S0360-5442(97)00096-0
- 39. Reddy, V.S., Kausihik, S.C., Tyagi, S.K. and Panwar, N.L. (2010) An Approach to Analyze Energy and Exergy Analysis of Thermal Power Plant: A Review. Smart Grid and Renewable Energy, 1, 143-152. https://doi.org/10.4236/sgre.2010.13019
- 40. Saravanamuttoo, H., Roger, G.F.C., Cohen, H. and Straznicky P.V. (2009) Gas Turbine Theory. 6th Edition, Pearson Education Ltd., London.
- 41. Cengel A.Y. and Boles A.M. (2006) Thermodynamics, an Engineering Approach, 5th Edition, McGraw-Hill Higher Education, Boston.
- 42. Lazaretto, A. and Tsatsaronis, G. (2006) SPECO: A Systematic and General Methodology for Calculating Efficiencies and Costs in Thermal Sysyems. Energy, 31, 1257-1289. https://doi.org/10.1016/j.energy.2005.03.011
- 43. Zhang, C., Wang, Y., Zheng, C. and Lou, X. (2006) Exergy Cost Analysis of a Coal Fired Power Plant on Structural Theory of Thermoeconomics. Energy Conversion and Management, 47, 817-843. https://doi.org/10.1016/j.enconman.2005.06.014
- 44. Bejan, A., Tsatsaronis, G. and Moran, M. (1996) Thermal Design and Optimization. John Wiley & Sons, Inc., New York.
- 45. Moran, M.J. (1989) Availability Analysis—A Guide to Efficient Energy Use. ASME Press, New York.
- 46. Kwon, Y., Kwak, H. and Oh, S. (2001) Exergoeconomic Analysis of Gas Turbine Cogeneration Systems. International Journal of Exergy, 1, 31-40. https://doi.org/10.1016/S1164-0235(01)00007-3
- 47. Ameri, M.., Ahmadi, P. and Hamidi, A. (2009) Energy, Exergy and Exergoeconomic Analysis of a Steam Power Plant: A Case Study. International Journal of Energy Research, 33, 499-512. https://doi.org/10.1002/er.1495
- 48. Gorji-Bandpy, M. and Goodarzian, H. (2011) Exergoeconomic Optimization of Gas Turbine Power Plants Operating Parameters Using Genetic Algorithms: A Case Study. Thermal Science, 15, 43-54. https://doi.org/10.2298/TSCI101108010G
- 49. Valero, A., Tsatsaronis, G., Frangopoulos, C. and Spakovsky, M.R.V. (1994) CGAM Problem: Definition and Conventional Solution. Energy, 19, 279-286. https://doi.org/10.1016/0360-5442(94)90112-0
- 50. Mousafarash, A. and Ameri, M. (2013) Exergy and Exergo-economic Based Analysis of a Gas Turbine Power Generation System. Journal of Power Technologies, 93, 44-45.
- 51. Ameri, M. and Enadi, N. (2012) Thermodynamic Modeling and Second Law Based Performance Analysis of a Gas Turbine Power Plant (Exergy and Exergoeconomic Analysis). Journal of Power Technologies, 92, 183-191.
- 52. Lazzaretto, A. and Tsatsaronis, G. (1997) On the Quest for Objective Equations in Exergy Costing. Proceedings of the ASME Advanced Energy Systems Division, AES, 37, 413-428.
- 53. Chand, V.T., Sankar, B.R. and Chowdary, J.R. (2013) Exergy Analysis of Gas Turbine Power Plant. International Journal of Engineering Trends and Technology (IJETT), 4, 3991-3993.
- 54. Obanor, A.I., Dolor, G.A. and Egware, H.O. (2014) Exergetic Appraisal of Warri Refining Petrochemical Company Gas Turbine Power Plant. Journal Advanced & Applied Sciences (JAAS), 2, 132-142.
Nomenclature
Lists of Symbols
―Exergy flow rate (MW)
―Exergy flow stream at inlet of the plant component (MW)
―Exergy flow stream at outlet of the plant component (MW)
―Material component of exergy (MW)
―Mechanical component of exergy (MW)
―Thermal component of exergy (MW)
―Chemical component of exergy (MW)
―Exergy flow rate of power output (MW)
―Exergy destruction flow rate (MW)
―Exergy efficiency (%)
―Exergy destruction efficiency (%)
―Exergy destruction ratio (%)
―Relative cost difference for kth component (%)
―Heat transfer rate between the component and the environment (MW)
―Entropy flow rate (MW/K)
―Temperature (Kelvin)
―Reference temperature (Kelvin)
―Pressure (Bar)
―Ambient pressure (Bar)
―Mass flow rate (kg/s)
―Isentropic efficiency (%)
―Annualized levelized cost ($/year)
―Levelized cost rate
―Average unit exergy cost ($/GJ)
―Interest rate (%)
―Operating hours per year
―Number of years of operation
―Capital investment cost rate ($/h)
―Average cost per unit of fuel exergy ($/GJ)
―Average cost per unit of product exergy ($/GJ)
―Cost rate of exergy destruction ($/h)
―Exergoeconomic factor (%)
MW―Megawatt
Superscripts
M―Material under study (Thermomechanical)
P―Mechanical
T―Thermal
CHE―Chemical
W―Power output
Subscripts
i―Inlet
o―Outlet
D―Destruction
k―Stream
a―Air
f―Fuel
g―Flue gas

Submit or recommend next manuscript to SCIRP and we will provide best service for you:
Accepting pre-submission inquiries through Email, Facebook, LinkedIn, Twitter, etc.
A wide selection of journals (inclusive of 9 subjects, more than 200 journals)
Providing 24-hour high-quality service
User-friendly online submission system
Fair and swift peer-review system
Efficient typesetting and proofreading procedure
Display of the result of downloads and visits, as well as the number of cited articles
Maximum dissemination of your research work
Submit your manuscript at: http://papersubmission.scirp.org/
Or contact epe@scirp.org