Energy and Power Engineering
Vol. 4 No. 6 (2012) , Article ID: 25013 , 11 pages DOI:10.4236/epe.2012.46054
Energy, Exergy and Economic Analyses of Energy Sourcing Pattern in a Nigerian Brewery
Department of Mechanical Engineering, Yaba College of Technology, Lagos, Nigeria
Email: diranadedeji@yahoo.com, *ismail.badmus@gmail.com
Received July 27, 2012; revised August 29, 2012; accepted September 12, 2012
Keywords: Exergy; Energy; Diesel; Electricity; Process Steam Boiler
ABSTRACT
Energy, exergy, and economic analyses of energy sourcing pattern in a Nigerian brewery have been carried out. The mean annual energy efficiencies have varied from 75.62% in 2004 to 81.71% in 2006, while the mean annual exergy efficiencies have varied from 42.66% in 2004 to 57.10% in 2005. Diesel fuel combustion, whether for local electricity generation via internal combustion engines or for process steam raising in boilers, has adversely affected the efficiencies of energy utilisation in the company. The negative effect of steam raising on efficient energy utilisation is more, although steam raising is unavoidable, due to the nature of the company under investigation. The annual mean energy unit costs have also varied from 27.86 USD per Giga-Joule in 2006 to 32.80 USD per Giga-Joule in 2004, confirming the inverse proportion of energy efficiency and costs. On the other hand, the annual mean exergy unit costs have varied from 40.19 USD per Giga-Joule in 2005 to 58.46 USD per Giga-Joule in 2004. The most efficient year has been 2006 energetically and 2005 exergetically. The difference in the two years lies in the proportions of generator diesel and boiler diesel utilised as the system exergy is most sensitive to boiler diesel use while the system energy is more sensitive to generator diesel utilisation due to their different device efficiencies.
1. Introduction
Historically, energy has been the pivot of economic development of most countries all over the world and this trend persists. It has brought great economic prosperity to nations and has been the centre for social and overall human development. Unfortunately, due to the way energy is sourced, produced and used historically, two major drawbacks have evolved. Firstly, the overall energy system has been very inefficient; and secondly, major local and global environmental, social and health problems have been associated with the energy system [1]. This throws up the twin challenge of energy conversion efficiency improvement and sustainable environmental management.
Nigeria is endowed with a vast amount of energy resources. According to the OPEC annual statistical bulletin [2], Nigeria proven crude oil reserves and natural gas are 37.2 billion barrels and 5292 trillion standard cubic metres, respectively.
Despite these huge resources which should have translated into cheap, affordable and reliably constant power supply, an estimated 60 million Nigerians now own power generating sets for their electricity, while the same number of people spend a staggering $10 billion to fuel them annually [3] quoted in ECN [4]. According to Oniwon [5], 15% of Nigeria’s produced natural gas is still flared while only 12% is utilized locally between Industrial and power sectors.
Nigerian industrialists and other stakeholders have bitterly decried the situation of the Nigerian power sector. For instance, the manufacturers, who operate under different trade associations like the Manufacturers Association of Nigeria (MAN) and Nigeria Association of Small Scale Industries (NASSI), once said that the major problem facing the manufacturing sector was the lack of power, explaining that the volume of diesel consumed daily in Nigeria was currently put at between 12 million and 13 million litres [6] quoted in [4].
Activities in the company revolve round brewing of (non-alcoholic) malts and (alcoholic) lager beer. To carry out this production there are various processes involved and these include: decoration, bottle washing, filling, capping, pasteurization, cooling and so on. All these processes require steam, air, water, electricity, etc. Generators are used as alternative source of electricity when there is power outage from the national grid (the Power Holding Company of Nigeria, PHCN). But due to inefficient and unavailable electricity supply from the Power Holding Company of Nigeria, as testified to by many stakeholders like Iwayemi [7], most companies largely depend on generators. At this brewery, generators supply power for most of the running hours, while PHCN supply power for the rest. The boiler is used most of time because most of the processes require steam for washing, sterilizing, heating, pasteurizing, etc.
2. Theory
The principle of energy conversation is the first law of thermodynamics, which stipulates that under no circumstance can energy be destroyed. This law states that the amount of heat transferred into a system less the amount of work done by the system must be equal to the corresponding change in the system energy. In effect, heat and work are means by which systems exchange energy with one another. Mathematically,
 (1)
(1)
Although electrical, mechanical and kinetic energies are all forms of energy which can be transformed into one other nearly completely, this is not so in the case of thermal energy as in case of internal combustion engine where the heat generation occurs in the cylinder but the useful component converted to mechanical use is less than 50%.
The first law of thermodynamics treats all energy forms in the same way. There are, however, certain types of energy that are more valuable than others.
Thus, we define the quality of the energy as the potential to produce useful work.
Exergy is the maximum work potential of a material or of a form of energy in relation to its environment. This work potential can be obtained by reversible processes. However, in reality there are only irreversible processes. Thus, we seek the work potential of a system, relative to the dead state, or reference environment.
The dead state of a system is the state in which it is in equilibrium with the environment. This means same temperature and pressure, no relative motion and same altitude.
For practical reasons a reference environment has been defined for the environment. The reference environment is considered to be so large, that its parameters are not affected by interaction with the system under consideration. In this work, the reference system as stated in Szargut et al. [8] and Kotas [9], both quoted in Cornelissen [10], has been used with a reference temperature  of 298.15 K and a reference pressure
  of 1 atm. There are exergy transfers with work and heat transfers as well as material streams.
2.1. Exergy Transfer with Work Interaction
The exergy transfer with work interaction is associated with work transfer rate or shaft power. Because exergy is defined as the maximum work potential, work is equivalent to exergy in every respect.
2.2. Electrical Energy and Exergy
Electrical energy is not affected by ambient conditions and therefore is equivalent in work. In other words, electrical energy can be treated as totally convertible to work.
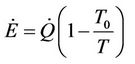
2.3. Exergy Transfer with Heat Interaction
The exergy transfer rate  connected with the heat transfer rate
  can be calculated using the following formula:
 (2)
(2)
where A is the heat transfer area, T0 is the temperature of the environment, T is the temperature at which the heat transfer takes places. When there is a uniform temperature distribution, the expression becomes:
 (3)
(3)
2.4. Exergy Transfer Associated with Material Streams
Chemical Exergy
One of the most common energy carriers is hydrocarbon/fossil/biomass fuels. The specific exergy of this class of thermodynamic systems is the chemical exergy. Chemical exergy is equal to the maximum amount of work obtainable when the substance under consideration is brought from the environmental state, defined by the parameters T0 and P0, to the reference state by processes involving heat transfer and exchange of substances only with the environment.
For many fuels the chemical structure is unknown. To overcome this problem the chemical exergy for these fuels can be estimated on the basis of the higher heating value (HHV). The relationship between the HHV and the chemical exergy is:
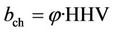 (4)
(4)
φ, the fuel chemical exergy factor can be calculated with formulae based on the atomic composition. For diesel [11], φ is 1.07 and for natural gas, it can be approximated as 0.94 [12] quoted in Hepbasli [13].
2.5. Energy and Exergy Efficiencies of the Processes
The expressions for energy efficiency (η) and exergy efficiency (ψ) for the main types of processes in this paper are as follows:
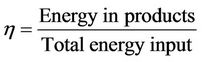 (5)
(5)
 (6)
(6)
The particular efficiencies are as follows:
Boiler energy efficiency:
 (7)
(7)
Boiler exergy efficiency:
 (8)
(8)
Generator energy efficiency:
 (9)
(9)
Generator exergy efficiency:
 (10)
(10)
Electrical energy efficiency:
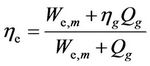 (11)
(11)
Electrical exergy efficiency:
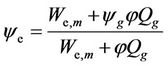 (12)
(12)
Total energy efficiency:
 (13)
(13)
Total exergy efficiency:
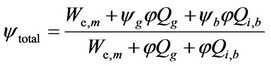 (14)
(14)
In all cases,
Q = fuel mass × fuel heating value(15)
2.6. Economic Analysis
2.6.1. Mains Electricity Tariff
Mains electricity tariff for the industrial sector from 1st Feb. 2002 to 30th June 2009, for power consumption above 20MVA is N8.50 per kWh [14]. This is equivalent to a unit cost,  of $15.74 per GJ of mains electricity, at N150 per US dollar.
2.6.2. Diesel Generator Output Electricity Unit Costs
Energy unit cost, Cn,g, is given by:
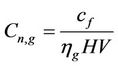 (16)
(16)
Exergy unit cost, CX,g, is given by:
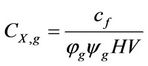 (17)
(17)
2.6.3. Boiler Steam Generation Unit Costs
Boiler energy unit cost, Cn,b, is given by:
 (18)
(18)
Boiler exergy unit cost, CX,b, is given by:
 (19)
(19)
Since, in our case, both the boiler and the generator use the same fuel, 
2.6.4. Mean Output Electricity Unit Costs
Mean electrical energy unit cost
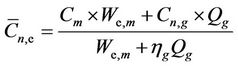 (20)
(20)
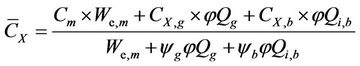
Mean electrical exergy unit cost
 (21)
(21)
2.6.5. Overall Mean Unit Costs
Overall mean energy unit cost
 (22)
(22)
Overall mean exergy unit cost
 (23)
(23)
3. Methodology
Due to difficulties in accessing the production process lines details; this work concentrates on the assessment of the company energy sourcing efficiencies rather than the end uses. Electricity has been sourced from both the national grid and diesel fuelled generators. Steam has been raised using diesel fuel alone to fire the boilers. Are there better options on ground for the company? This is the focus of this work.
To examine the energy utilization efficiency of the company, a five-year data (2004-2008) was collected from the company utilities section. The data collected covers the following areas:
i) Mains Electricity bill (PHCN)—kWh/$ values ii) Energy value computed from volumes of fuel consumed for firing the boilers and running electrical generators on monthly basis (GJ).
Energy consumption in the factory affects the period costing and pricing directly. Considering energy value of diesel oil, one litre is equivalent to 39 MJ [15], using the higher heating value. The diesel engine power plant energy efficiency and exergy efficiency are taken to be 47% and 43.8% respectively [16]. Also, we are taking boiler energy efficiency to be 72.46% and its exergy efficiency to be 24.89% [17].
4. Results
The results in Tables 1-5 were obtained for the years 2004-2008 respectively from available data.
5. Discussion of Results
Generally, the electrical energy and exergy efficiencies are very numerically close. This is because electrical energy and exergy values are thermodynamically equal. The small disparities that exist between the energy and exergy efficiency values in our case is due to the relatively low electrical energy generation efficiency of diesel powered internal combustion engines (47% for energy and 43.8% for exergy). Secondly, the total energy and exergy efficiencies are further brought down in value by the relatively low thermal efficiencies of the process steam boilers. The boiler energy efficiency (72.46%) and exergy efficiency (24.89%) have led to very wide gaps between the total energy efficiencies and total exergy efficiencies.
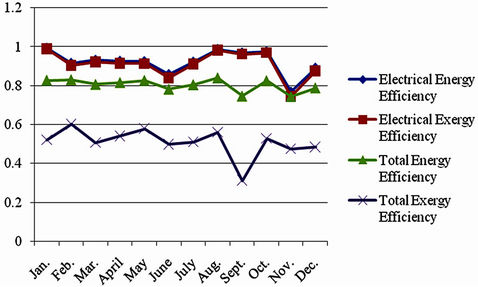
Considering the year 2004 (Figure 1(a)), all efficiencies except for total exergy one, record their lowest values in the month of January. This is due to the fact that the electricity supply is dominated by low efficiency diesel engine generated electric power for the month but the low percentage of boiler fuel in the overall fuel mix (Figure 1(b)) has led to the improvement of the overall exergy efficiency. February has high electrical energy and exergy efficiencies because the generator diesel portion of the total energy supply mix is only about 3.6%. In May, we have low overall energy efficiency since practically all the three energy supply types have equal quantities (Figure 1(b)). The month of June has the highest electrical energy and exergy efficiencies (97.06% and 96.68% respectively) for the year because its diesel generator supply (2.7%) is the least after the month of December (2.5%) but its boiler fuel supply (52%) is almost half of that of December (95.7%).
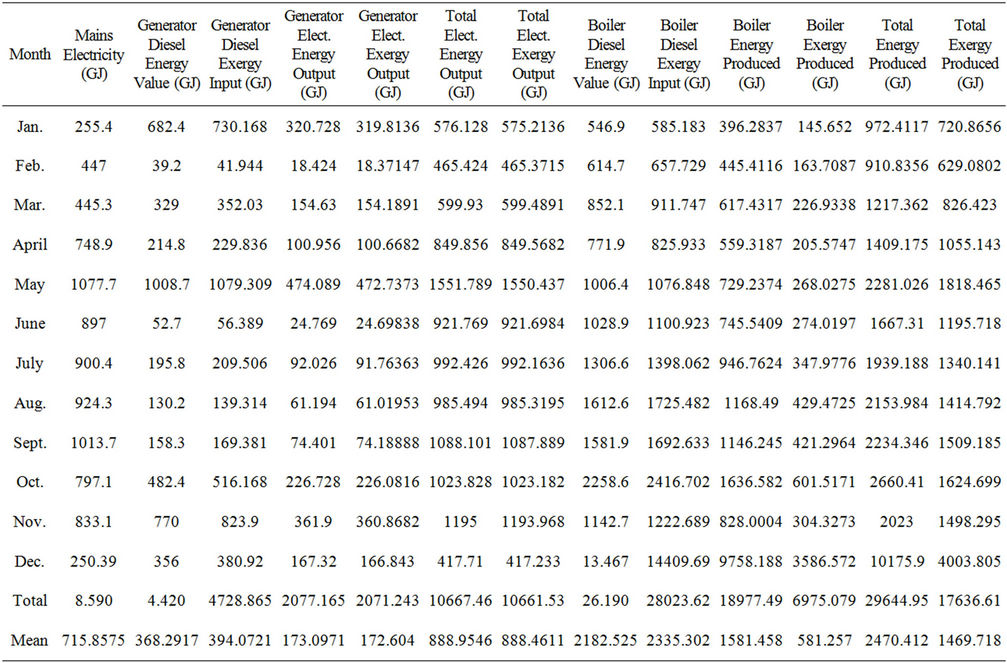
Table 1. Energy consumption pattern for the year 2004.
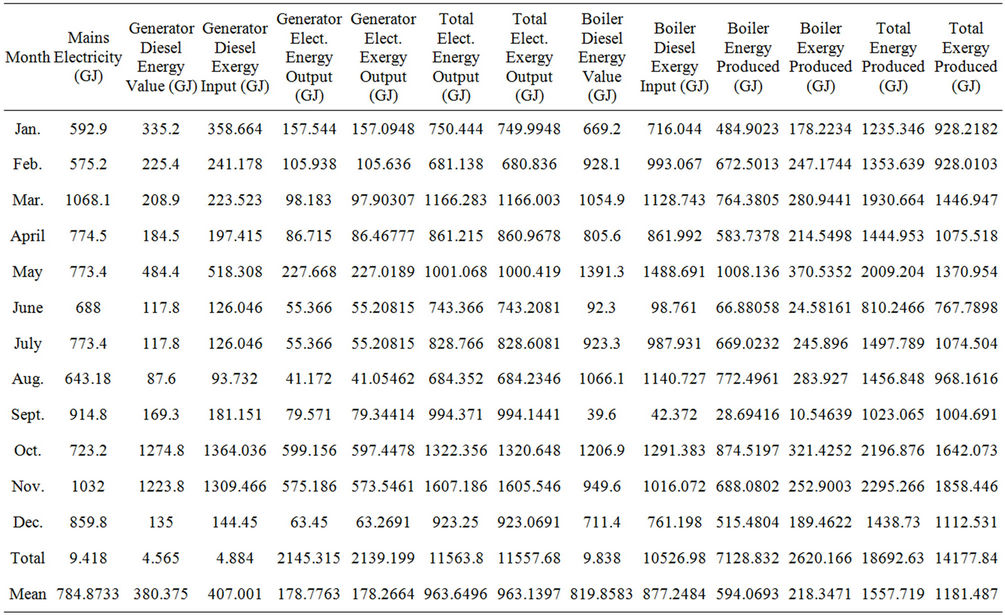
Table 2. Energy consumption pattern for the year 2005.
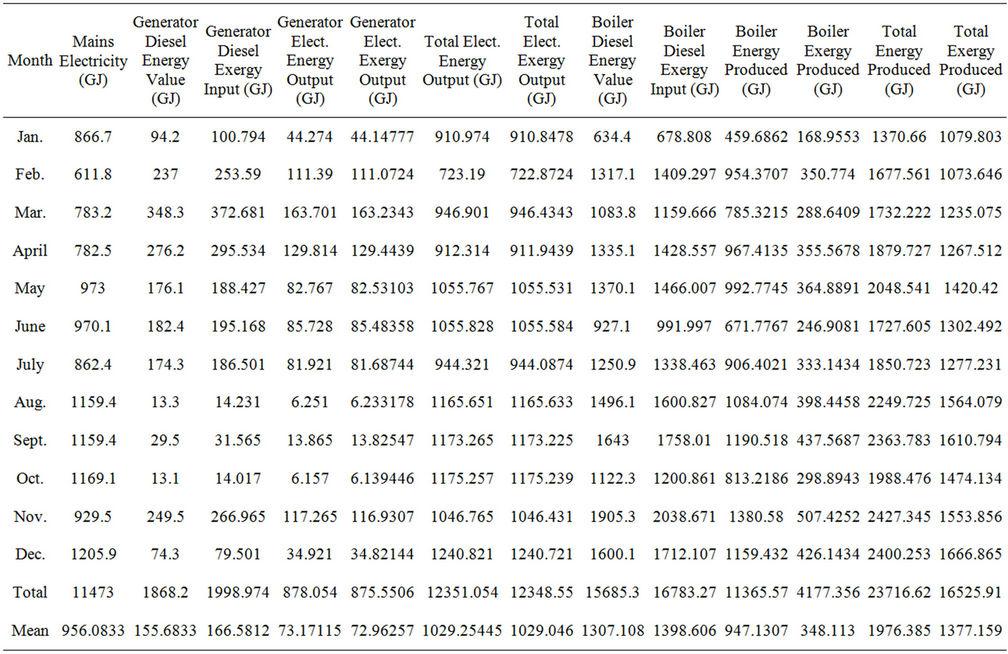
Table 3. Energy consumption pattern for the year 2006.
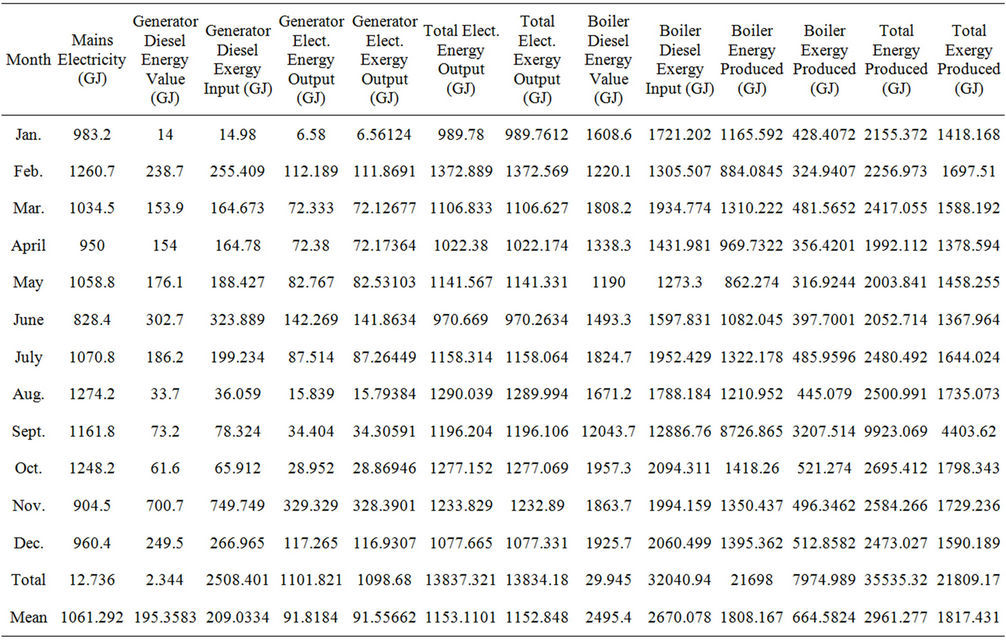
Table 4. Energy consumption pattern for the year 2007.

Table 5. Energy consumption pattern for the year 2008.
 (a)
(a)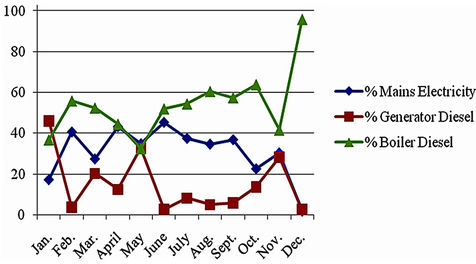 (b)
(b) (c)
(c)
Figure 1. (a) Energy and exergy efficiencies for the year 2004; (b) Energy supply mix for the year 2004; (c) Energy and exergy unit costs for the year 2004.
The same line of argument applies to all the other years. For instance, for the year 2005, the months of June and September record high efficiencies (Figure 2(a)) and favourable energy mixes (Figure 2(b)) respectively. Similarly, the months of February, May, August and October have low efficiencies and unfavourable energy mixes respectively.
The year 2006 is with moderate efficiencies (Figure 3(a)) because although the boiler fuel consumption is generally high throughout the year, the electrical energy consumption from the mains is also generally high (Figure 3(b)). The year 2007 is similar to 2006 except for the month of September which has generally low electricity consumption (about 9.4% of total energy supply), with higher percentage share (8.75%) from the mains but very high boiler fuel consumption (90.7% of total energy supply), leading to the lowest total energy and exergy efficiencies for the year, despite high electrical energy and exergy efficiencies of 96.86% and 96.45%, respectively.
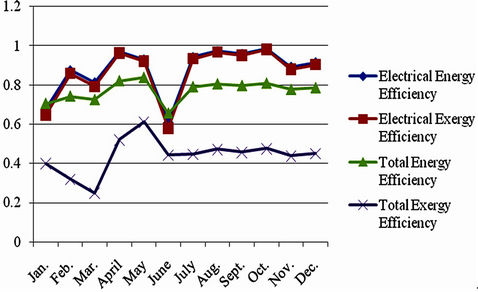
In the year 2008, the generator diesel consumption is generally low, except for the months of January (23.63%) and June (43.8%). However, the fact that June records
 (a)
(a)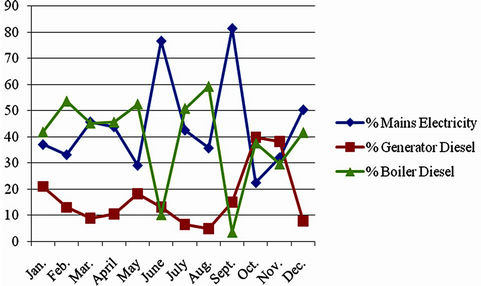 (b)
(b)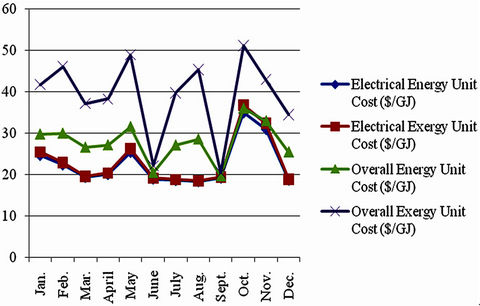 (c)
(c)
Figure 2. (a) Energy and exergy efficiencies for the year 2005; (b) Energy supply mix for the year 2005; (c) Energy and exergy unit costs for the year 2005.
 (a)
(a)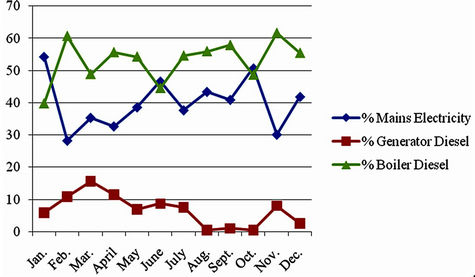 (b)
(b)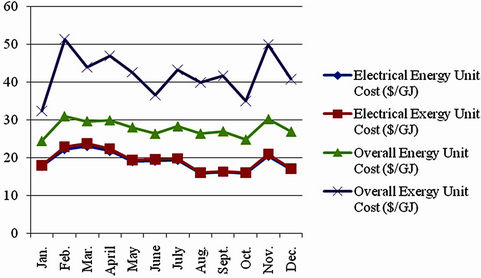 (c)
(c)
Figure 3. (a) Energy and exergy efficiencies for the year 2006; (b) Energy supply mix for the year 2006; (c) Energy and exergy unit costs for the year 2006.
the lowest boiler fuel consumption for the year has positively influenced the exergy efficiency for the month to make it fall within the average value. January boiler fuel consumption is very high (61.44%). This, coupled with low mains electricity, has resulted in low efficiencies. March has the lowest total exergy efficiency for the year due to the domination of its energy supply by boiler fuel (99.85%).
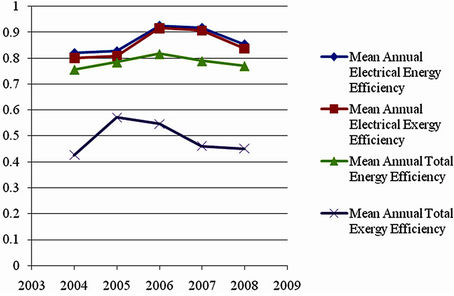
Finally, the years 2005 and 2006 are the most energy efficient years with exergy efficiencies of 57.1% and 54.6% respectively. The year 2006 has higher energy efficiency and lower exergy efficiency than the year 2005 despite practically equal percentages of mains electricity supply (39.54% for 2005 and 39.53% for 2006) due to the fact that 2006 has relatively low percentage of generator fuel consumption but high percentage of boiler fuel consumption while 2005 has relatively high percentage of generator fuel consumption and low percentage of boiler fuel consumption. This observation reinforces the fact that high generator fuel consumption largely affects the total energy efficiency adversely while high boiler fuel consumption negatively affects the total exergy efficiency.
For the economic analysis, comparisons of Figures 1(a) and (c), Figures 2(a) and (c), Figures 3(a) and (c), Figures 4(a) and (c), Figures 5(a) and (c) as well as Figures 6(a) and (c) show that graphical representations of energy and exergy efficiencies are practically mirror inverses of those of the energy unit costs. Months and years of minimum efficiencies correspond to months and years of maximum energy unit costs and vice versa. These comparisons inform us that where we have efficient energy utilisation the costs are reduced, resulting in corresponding economic gains and vice versa. Comparing Figure 6(a) with Figure 7, one discovers that with total switching to the mains supply for electricity sourcing, the mean annual electrical energy and exergy efficiencies both become 100%; the mean annual total energy efficiencies vary from 79.26% to 85.93% while the mean annual total exergy efficiencies now vary from 42.51% to 60.36%. This means that the optimised generator diesel/boiler diesel is zero (zero generator diesel) for electricity. Before the switching, the corresponding values were 82% - 92.58%; 80.05% - 91.66%; 75.62% - 81.71% and 42.66% - 57.1%, respectively. These imply at least 7% savings in electricity and at least about 3% savings in overall energy. Hence, as a first step, the company still needs to consider this power source switching. This suggests that the major energy challenge facing the brewery is in its boiler energy utilization.
6. Conclusions and Recommendations
6.1. Conclusions
Energy, exergy, and economic analyses of energy sourcing pattern in a Nigerian brewery have been carried out. The brewery has relied on electricity from both the national grid and diesel-powered electrical generators. It also utilises diesel fuel oil for process steam boiler firing. The mean annual energy efficiencies have varied from 75.62% in 2004 to 81.71% in 2006, while the mean annual exergy efficiencies have varied from 42.66% in 2004 to 57.10% in 2005. Diesel fuel combustion, whether for local electricity generation via internal combustion engines or for process steam raising in boilers, has adversely affected the efficiencies of energy utilization in the company. The negative effect of steam raising
 (a)
(a) (b)
(b)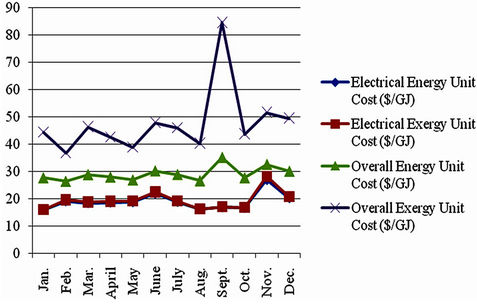 (c)
(c)
Figure 4. (a) Energy and exergy efficiencies for the year 2007; (b) Energy supply mix for the year 2007; (c) Energy and exergy unit costs for the year 2007.
on efficient energy utilisation is more, although steam raising is unavoidable, due to the nature of the company under investigation. The annual mean energy unit costs have also varied from 27.86 USD per Giga-Joule in 2006 to 32.80 USD per Giga-Joule in 2004, confirming the inverse proportion of energy efficiency and costs. On the other hand, the annual mean exergy unit costs have varied from 40.19 USD per Giga-Joule in 2005 to 58.46 USD per Giga-Joule in 2004. This also implies that year 2004 has been the worst year from all (energy, exergy and economic) points of view. The most efficient year
 (a)
(a)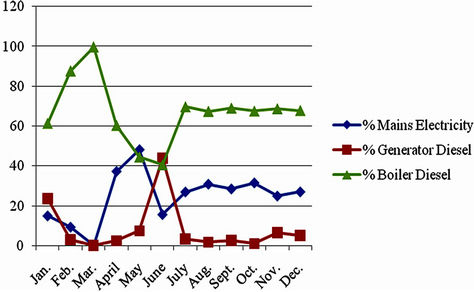 (b)
(b)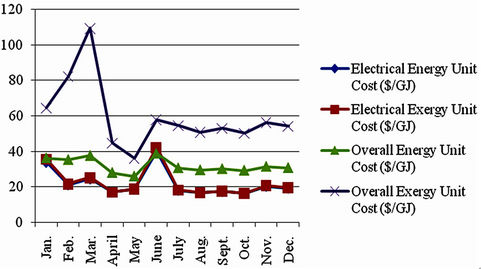 (c)
(c)
Figure 5. (a) Energy and exergy efficiencies for the year 2008; (b) Energy supply mix for the year 2008; (c) Energy and exergy unit costs for the year 2008.
has been 2006 energetically and 2005 exergetically. The difference in the two years lies in the proportions of generator diesel and boiler diesel utilised as the system exergy is more sensitive to boiler diesel use while the system energy is more sensitive to generator diesel utilisation due to their different device efficiencies.
6.2. Recommendations
Based on the findings in this paper, it is necessary to avoid electricity generation from diesel powered generators as much as possible. Secondly, steam generation is an unavoidable but very expensive process. Hence, spe-
 (a)
(a)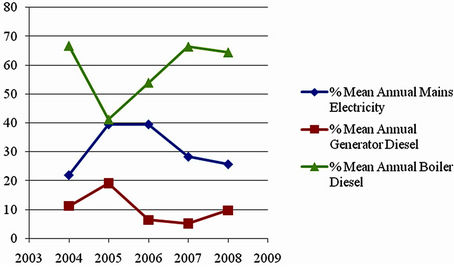 (b)
(b) (c)
(c)
Figure 6. (a) Mean annual efficiencies; (b) Mean annual energy supply mixes for the years 2004-2008; (c) Annual mean energy unit costs.

Figure 7. Mean annual efficiencies with zero generator diesel.
cial attention should be paid to process steam management to avoid unnecessary leakages and/or wastages. Lastly, in lieu of stable power supply from the national grid, a big company like this brewery should be able to consider a technically trusted energy conservation technique like cogeneration, since it needs both electrical power and process steam dearly.
For the boiler, the brewery may have to consider bigger size boilers. This is because authors like Pulkrabek [18] quoted in [16] have observed that general trend is that the greater is the plant size, the smaller is the specific fuel consumption. One reason for this is less heat loss due to the higher volume to surface area ratio of the combustion chamber Secondly, a boiler fuel-switch from diesel to natural gas may be worthwhile, considering the fact that natural gas is a low-carbon fuel with a lower minimum allowable stack temperature than that of diesel oil [19] and Nigeria has the gas abundantly. A lower stack temperature would improve the boiler efficiency, reducing the company energy costs and bring down thermal pollution level, while the low carbon content would reduce CO2, a green house gas, emission.
Finally, 2% - 8% boiler energy can be saved [17] by enhancing heat transfer rate of flue gases using nanofluids.
REFERENCES
- O. Davidson, “Energy for Sustainable Development: South African Profile,” Phase 1 Final Report, Energy Research Centre, University of Cape Town, South Africa, 2004.
- Organisation of Petroleum Exporting Countries (OPEC), “Oil and Gas Data,” OPEC Annual Statistical Bulletin, Vienna, 2009, pp. 22-23.
- Manufacturers Association of Nigeria (MAN), “60 m Nigerians Now Own Power Generators,” Vanguard Newspaper, 26 January 2009.
- Energy Commission of Nigeria (ECN), 7 March 2012. http://www.energy.gov.ng/index.php?option=com_content&task=view&id=56&Itemid=58
- A. Oniwon, “Oil and Gas in Nigeria’s National Development: An Assessment,” A Presentation at the National Defence College, Abuja, 9 November 2011.
- Manufacturers Association of Nigeria (MAN), “Manufacturers Spend N1.8bn Weekly on Diesel,” Nigerian Tribune Newspaper, 21 August 2009.
- A. Iwayemi, “Nigeria’s Dual Energy Problems: Policy Issues and Challenges,” Proceedings of the 31st International Association for Energy Economics International Conference, Istanbul, 18-20 June 2008, pp. 17-21.
- J. Szargut, D. R. Morris and F. R. Steward, “Exergy Analysis of Thermal, Chemical and Metallurgical Processes,” Hemisphere Publishing Corporation, Washington DC, 1988.
- T. J. Kotas, “The Exergy Method of Thermal Plant Analysis,” 2nd Edition, Krieger Publishing Company, Melbourne, 1995.
- R. L. Cornelissen, “Thermodynamics and Sustainable Development,” Febodruk, Enschede, 1997.
- J. O. Jaber, A. Al-Ghandoor and S. A. Sawalha, “Energy Analysis and Exergy Utilization in the Transportation Sector of Jordan,” Energy Policy, Vol. 36, No. 8, 2008, pp. 2995-3000. doi:10.1016/j.enpol.2008.04.004
- G. Tsatsaronis and F. Cziesta, “Thermodynamics,” Summer Course on Optimization of Energy Systems and Processes, Gliwice, 2003.
- A. Hepbasli, “A Study on Estimating the Energetic and Exergetic Prices of Various Residential Energy Sources,” Energy and Buildings, Vol. 40, No. 3, 2008, pp. 308-315. doi:10.1016/j.enbuild.2007.01.023
- 10 March 2012. http://www.phcnonline.com/tariffNew.asp
- O. A. Fashade, “General Information for Engineering Students and Professionals,” Fast Corp Publishers, Lagos, 1997.
- M. Kanogˇlu, S. K. Işık and A. Abuşogˇlu, “Performance Characteristics of a Diesel Engine Power Plant,” Energy Conversion and Management, Vol. 46, No. 11-12, 2005, pp. 1692-1702. doi:10.1016/j.enconman.2004.10.005
- R. Saidur, J. U. Ahamed and H. H. Masjuki, “Energy, Exergy and Economic Analysis of Industrial Boilers,” Energy Policy, Vol. 38, No. 5, 2010, pp. 2188-2197. doi:10.1016/j.enpol.2009.11.087
- W. W. Pulkrabek, “Engineering Fundamentals of Internal Combustion Engines,” Prentice-Hall, Upper Saddle River, 1997.
- A. Bhatia, “Improving Energy Efficiency of Boiler Systems,” Continuing Education and Development, Inc., Greyridge Farm Court Stony Point, New York, 2012. http://www.cedengineering.com
NOTES
*Corresponding author.