Open Journal of Urology
Vol. 2 No. 2 (2012) , Article ID: 19125 , 12 pages DOI:10.4236/oju.2012.22010
Expression Profiling of Hereditary versus Sporadic Prostate Cancer Suggests CYR61, EGR3, KLF6 and SNF1LK as Differentially Expressed Genes
1Department of Urology, Aarhus University Hospital Skejby, Aarhus, Denmark
2Department of Molecular Medicine, Aarhus University Hospital Skejby, Aarhus, Denmark
Email: diem.bentzon@skejby.rm.dk, diem.bentzon@dadlnet.dk
Received January 19, 2012; revised February 7, 2012; accepted March 9, 2012
Keywords: Hereditary Prostate Cancer; Microarray Expression Profile; Immunohistochemistry; Radical Prostatectomy; Tissue Microarray
ABSTRACT
Background: Distinguishing between sub-clinical and aggressive forms of prostate cancer is difficult due to the heterogeneity of the disease. It is, however, important to identify aggressive forms to guide proper treatment. This study compared gene expression profiles in cancer cells from hereditary and sporadic prostate cancer cases and attempted to correlate differentially regulated genes with clinico-pathological characteristics and prognosis. Materials and Methods: The study population comprised patients diagnosed with clinically localized prostate cancer undergoing prostatectomy. Patients were divided into hereditary and sporadic cancer cases based on their family history. Fresh frozen biopsies from prostatectomy specimens were laser-dissected for RNA-extraction. Affymetrix HG-U133 Plus GeneChips were used to measure gene expression loaded onto Cluster 3.0 and Ingenuity Pathway Analysis softwares to examine the relationship among genes between groups. Differentially expressed genes were selected for protein expression analysis using immunohistochemistry on histological sections and tissue microarrays. Results: No single genes were signifycantly differentially expressed between hereditary and sporadic cases after adjustment for multiple testing. Using cluster analysis, four transcripts were found to be upregulated in hereditary prostate cancer tissue: CYR61, EGR3, KLF6 and SNF1LK. The intensity of CYR61, EGR2, KLF6 and SNF1LK immunostainings, however, were not significantly different in a separate sample of hereditary and sporadic prostate cancers. Furthermore, no correlations between CYR61, EGR2, KLF6, and SNF1LK staining intensities and the clinico-pathological variables or disease-free survival were detected, except for EGR3 that was significantly associated with T stage (p = 0.04). Conclusion: Overall, no single transcript level was significantly associated with hereditary prostate cancer. Cluster analysis suggested that the expression of CYR61, EGR3, KLF6 and SNF1LK were upregulated in cancer tissue from hereditary cases, but we were not able to confirm this on the protein level, and levels of these proteins were not found to correlate with clinico-pathological characteristics or biochemical recurrence.
1. Introduction
Prostate cancer is the second most common solid cancer worldwide. The role of age, race, ethnicity, and family history of has been described in multiple large epidemicological studies. Familial prostate cancer accounts for 10% - 20% of all cases and hereditary prostate cancer (HPC) for 5% - 10% [1-3]. Early age at onset is the only trait convincingly associated with HPC.
The establishment of the Human Genome Project in 1998 and the International HapMap Project has lead to an increased interest in the molecular characterization of prostate cancer [4,5]. Many studies have addressed the genetic issue in HPC and suggested genes presumably implicated in the cancer disease. HPC1 on chromosome 1q24-25 has been linked to younger cases from families with a strong family history [6,7]. It has been suggested that RNASEL is linked to HPC1 and involved in prostate cancer susceptibility [8,9]. Recently, studies on risk loci have converged on chromosome 8q24 within which several polymorphisms with risk alleles reside [10-16]. Individually, these variants contribute only modestly to risk; combined, they have cumulative risk [17,18].
In the current study, we aimed at identifying differentially regulated genes between HPC and SPC tissue and correlate potential expression differences to clinico-pathological characteristics and prognosis.
2. Methods and Materials
2.1. Patients and Tissues
All patients were enrolled in the Aarhus Prostate Cancer Study. The study was approved by the Central Denmark Region Ethical Committee on Biochemical and Research and the Danish Data Protection Agency. Written informed consent was obtained from each participant.
In brief, the patients had clinically organ-confined prostate cancer (preoperative stage T1c-T2c) and underwent radical prostatectomy from April 1997 to April 2010. Demographic information and clinical characteristics were prospectively recorded including age at diagnosis, PSA, Gleason score and TNM stage (Tumor Node Metastasis). Family history was ascertained by questionnaire. Cases of HPC were defined by pedigree analysis according to Carter et al. [1]: 1) at least three prostate cancers in the nuclear family, including the index person; 2) two first-degree relatives with prostate cancer diagnosed before age 56; or 3) one prostate cancer case in each generation, either paternal or maternal lineage through three generations. Sporadic prostate cancer (SPC) were cases without family history of PC. Familial prostate cancer was defined by the presence of least two prostate cancer cases among first-degree relatives in the family, includeing the index person.
Prostate cancer specimens were collected from the Aarhus Prostate Cancer Study biobank. Almost instantly after the prostatectomy, two to four needle biopsies of the tumor were collected macroscopically from the removed prostate. The specimens were snap-frozen in Tissue-Tek in a cryovial by submersion in liquid nitrogen and stored at –80˚C until utilization. The tumors were all primary and classified according to WHO criteria.
The same set of patient samples were not analyzed with each method due to limited availability of tissue samples; however, they all came from the same cohort. The flow chart in Figure 1 shows the inclusion of patients for each analysis.
2.2. Microarray Gene Expression Profiling
2.2.1. Laser-Capture Micro-Dissection and Ribonucleic Acid-Extraction
For microdissection, cryosections were prepared from frozen needle biopsies. Each section was cut 5 µm thick and mounted onto an adhesive-coated slide (Brock & Mikkelsen) after they had been left to air-dry on ice for one
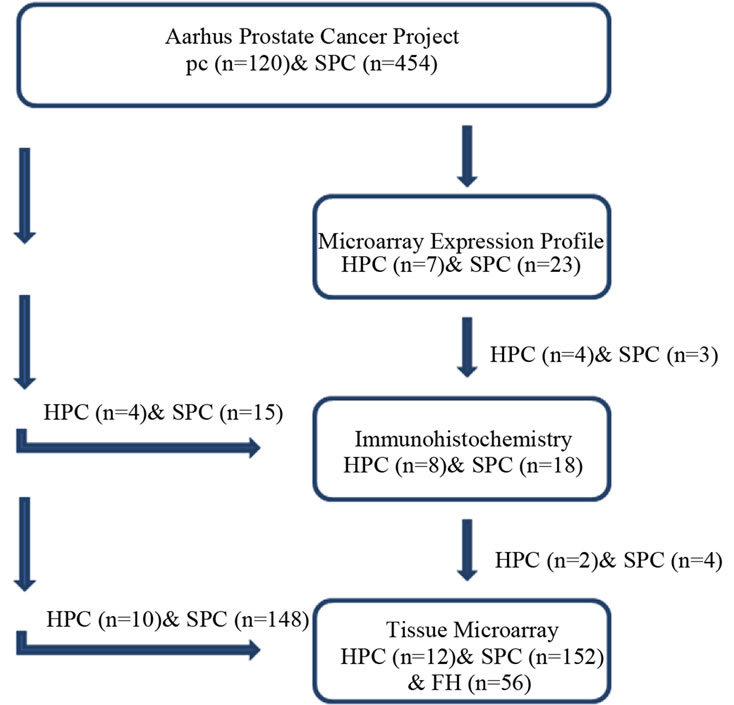
Figure 1. Flowchart showing which patients were analyzed with microarray, conventional immunohistochemistry, and immunohistochemistry on tissue microarrays, respectively. FH: family history/familial prostate cancer. The fresh frozen tumor tissue of seven patients with HPC and 23 patients with SPC were prepared for microarray expression profile; however, the paraffin-embedded tissue of only some of those patients (4 HPC and 3 SPC cases) was available for immunohistochemical analysis. Tissue from additional patients (4 HPC and 15 SPC cases, randomly selected from the same cohort), was therefore added for conventional immunohistochemistry yielding a total study sample of 8 HPC and 18 SPC cases. There was only a minor overlap between patients included in the tissue microarray and those analayzed for microarray expression profiles and with conventional immunohistochemistry.
minute (min). Tissue was dehydrated in 75% ethanol at –20˚C for 2 min and subsequently stained with 1% cresyl violet acetate in room temperature for 20 seconds (s). Following this, the slides were transferred to ethanol (50% and 100%) for 2 × 30 s for dehydration and air-dried at room temperature (20˚C) for approximately 10 min. The cancer lesion was defined and marked prior to microdissection (P.A.L.M Microlaser Technologies, Bernried, Gernmany). Once the selected cancer cells were marked, the energy of the laser light was canalized to catapult the cells into a cap of an Eppendorf microtube. An adequate quantity of captured cells was ensured by dissection of about 10 mm2 cancer area; the obtained cancer tissue was placed in a microtube with 300 µl lysis buffer and mercapto-ethanol (Pure Gene DNA protocol). RNA was extracted by using a RNA isolation kit (RNeasy Micro Cat. No74004, Qiagen) according to the manufacturer’s instructions, except 10 µL DNAase in 70 µL RDD buffer and 500 µL RPE buffer were applied twice and the elution was centrifuged twice. Prior to cDNA amplification, total RNA was quantified and the quality confirmed by RIN scores on a bioanalyzer (Agilent 2100 Bioanalyzer). Five ng total RNAs were required to assure minimum input. The average RIN score was 6.0 ranging from 3.7 to 9.7.
2.2.2. cDNA Preparation
Using WT-ovation™ Pico RNA Amplification System (Pico) (NuGEN Technologies Inc.), the cDNA amplification from total RNA was executed according to Nugen’s instruction. DNA/RNA chimeric Primer, Reverse Transcriptase and 5 µl total RNA were mixed with a random primer. Subsequently, 2.5 µl buffer and 0.25 µl enzyme were added to the DNA primer mix. In the next step, 9.75 µl buffer and 0.25 µl enzyme were added to the cDNA solution together with a master mix of SPIA® buffer (80 µl), primer (40 µl) and enzyme (40 µl). Purification of cDNA prior to cDNA amplification was executed in compliance with the instructions of Agencourt® RNAclean® (Beckman Coulter Genomics) and after cDNA amplification according to the protocol (DNA Clean & ConcentratorTM provided by Zymo Research).
2.2.3. Hybridization
50 µl biotin-labeled cDNA was loaded onto the Affymetrix array cartridge hybridizing during 16-hour incubation. Following hybridization, the GeneChip® probe array was washed and stained (streptavidin-phycoerythrin conjugate 10 mg/ml; Molecular Probes, Eugene, OR) according to the automatic fluidic station protocol. The arrays were scanned and stored until analysis (Hewlett Packard GeneArray Scanner G2500A). A total of 30 Affymetrix GeneChips were used (for detailed description see Thykaer et al.) [19].
2.2.4. Microarray Data Analysis
The scanning measures of GeneChip probe arrays were generated and gene expression was normalized using GeneChip robust multi-array analysis method (GCRMA) in ArrayAssist software (Stratagene) [20]. For cluster analysis, two filters were used: 1) gene expression threshold was set at six, probe-sets where less than four samples were measured below six were removed; 2) probesets with variance ≤3 were removed. Cluster 3.0 and Treeview software were used [21].
The Ingenuity Pathways Knowledge Base contains information about functional annotations and biological interactions between organs, tissues, cells, diseases and drugs. The probe-sets’ IDs were uploaded to Ingenuity Pathways Knowledge Base and mapped to its equivalent gene describing part of complex or interactions and networking.
2.3. Immunohistochemistry
2.3.1. Tissues
Blocks of formalin-fixed, paraffin-embedded prostate tumors were sectioned at 4 µm and stained with hemotoxylin and eosin for histopathological examination; the sections were examined for cancer and diagnosed by a pathologist. Sections of eight HPC and 18 SPC cases were cut for the detection of antigens by immunohistochemistry. Paraffin-embedded prostate cancer tissue from 220 patients were included in a tissue microarray [22,23].
For immunohistochemical detection of antigens, sections of formalin-fixed, paraffin-embedded tumors from each patient were stained for the four antigens according to the manufacturer’s instructions. Sections were deparaffinized, hydrated to dH2O, endogenous peroxidase activty was blocked with H2O2 (3.5 ml 35% H2O2, Bie & Berntsen), and slides were washed in tris-buffered saline TBS (pH 7.4; Bie & Berntsen). Heat-induced epitope retrieval was performed in a microwave oven in 200 ml Tris-EGTA (TEG buffer; pH 9.0) for 10 minutes at 350 W. Sections were washed in TBS, pre-incubated with 1% bovine serum albumin (BSA; pH 5.2; Applichem A22440100) and diluted for 30 minutes at room temperature. After TBS washing, sections were incubated with primary antibody (Table 1) diluted in 1% BSA for 60 minutes at room temperature. Sections were washed in TBS, covered with horseradish peroxidase-conjugated secondary polyclonal anti-rabbit antibody, visualized and prepared according to Dako’s instructions for 30 minutes plus 10 minutes at room temperature (EnVision kit with DAB chromogen, Dako K4003, Glostrup, Denmark). For enhancement of the signal, anti-EGR3 and anti-KLF6 were boosted with signal stain (Cell Signaling) according to the manufacturer’s protocol. Sections were rinsed with water, counterstained with hemotoxylin P. Mayer (Sigma), and washed in water.
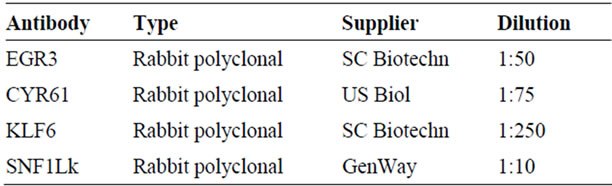
Table 1. List of antibodies.
2.3.2. Scoring of Antibody Staining
The staining intensity was scored semi-quantitatively (0 = no staining; 1 = weak staining; 2 = moderate staining; 3 = strong staining); however, for statistical evaluation, staining results were collected in two categories only (0 = no stain and 1 = stain). Furthermore, the percentage of stained cells was estimated, and it was noted if the staining pattern was focal, diffuse or varying in intensity.
Conventional slides were scored blindly by one researcher, whereas tissue microarray slides were scored blindly by two researchers; in case of interobserver variation, the slides were reevaluated until agreement was reached.
2.4. Statistical Analysis
Statistics were performed in Excel (Win 07, Microsoft). To analyze microarray data, the mean expression level in the HPC and SPC groups were calculated and a ttest was performed for each gene and adjusted for multiple comparison with Bonferroni correction. Chi-square tests and Fisher’s exact test were used to analyze categorical parameters (staining score, postoperative T stage, postoperative Gleason score, and preoperative PSA) whereas ttest were used to test for differences in age at diagnosis between groups. Time at risk was calculated from the date of surgery to the date of biochemical recurrence or prostate cancer-specific death, and patients without these events were censored at their last blood test. Biochemical recurrence was determined by PSA measurement ≥0.2 ng/ml after radical prostatectomy. Kaplan Meier survival estimates were used to illustrate biochemical relapse over time and the difference in biochemical disease-free survival was tested by log-rank test. Statistical calculations were performed in Intercooled Stata 10.0 (Stata Corp, USA) and significance level was set at 0.05.
3. Results
Three, partly overlapping, groups of prostatectomized patients with clinically organ-confined prostate cancer and a family history consistent with either HPC, familial prostate cancer or SPC were analyzed in the present study with microarray gene expression analysis (n = 30), conventional immunohistochemistry (n = 26), or immunohistochemistry on tissue microarray (n = 220) (Figure 1). Clinical and pathological characteristics of patients analyzed with microarray expression profiles are listed in Table 2. Patients analyzed with conventional immunohistochemistry are summarized in Table 3, and cases included in the tissue microarray are listed in Table 4. The combined group of HPC patients (n = 21) were signifycantly younger than the combined group of SPC cases (n = 195) (mean, 95% CI: 60.9, 59.2 - 62.6 versus 63.1, 62.6 - 63.6; p = 0.017; F-test was insignificant).
3.1. Microarray Data Analysis
A total of 54,676 probesets for studying the human transcriptome were used for genome-wide characterization of seven HPC and 23 SPC cases. Initially, we used t-test statistics to delineate transcripts that were differentially expressed between patients with HPC and SPC. However, following Bonferroni correction none was significant (data not shown). Consequently, we decided to investigate the underlying gene expression patterns using unsupervised hierarchical cluster analysis. Following data reduction, approximately 5500 probesets representing unique transripts remained. The cluster dendrogram and associated heatmap is shown in Figure 2.
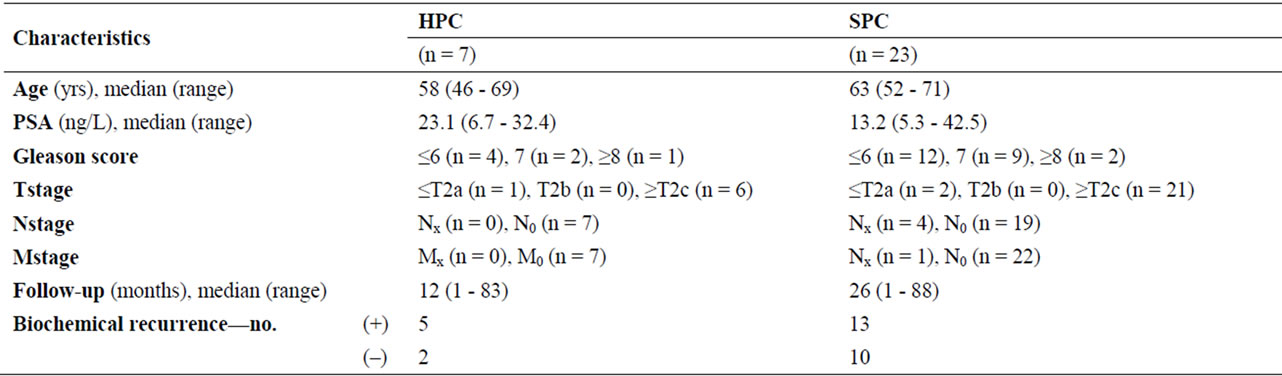
Table 2. Clinical characteristics of HPC versus SPC cases analyzed with microarray gene expression profiling. Gleason score and TNM are postoperative. The associations between prostate cancer type and each of the tumor variables were non-significant.
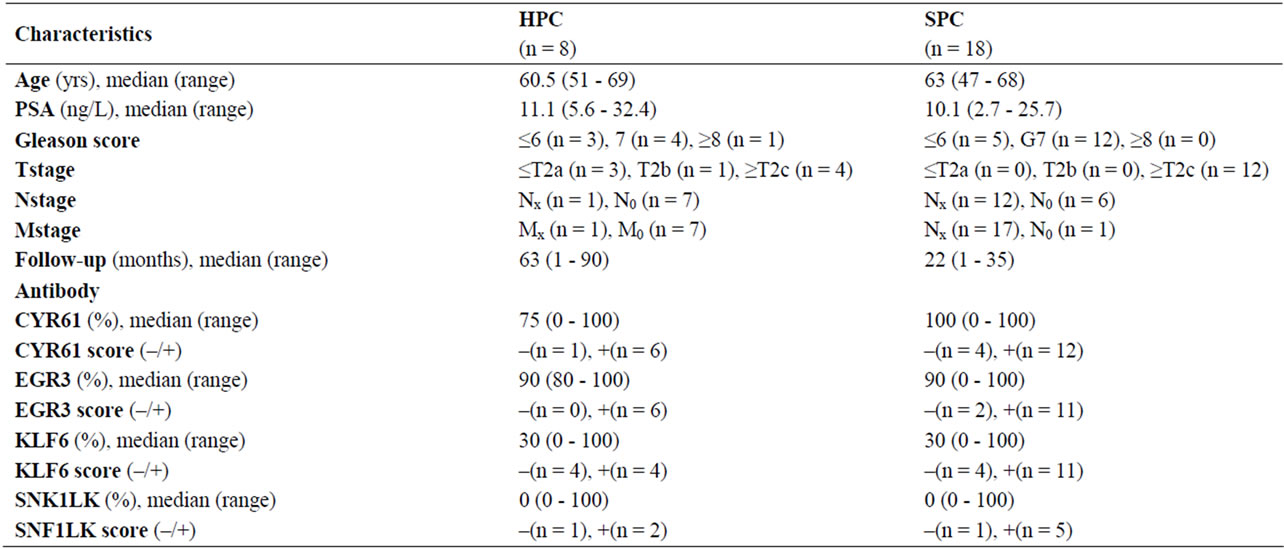
Table 3. Clinical and molecular characteristics of HPC and SPC cases analyzed with immunohistochemistry in conventional histological sections. EGR3, CYR61, KLF6, and SNF1LK stainings were not produced on slides from all patients due to limited availability. Stainings were quantitified by the presence/absence of staining or by the fraction of stained tumour cells. Fisher’s exact was performed for stain (–) versus stain (+): p > 0.05; **Nx/Mx: NA; N0/M0: no metastasis.
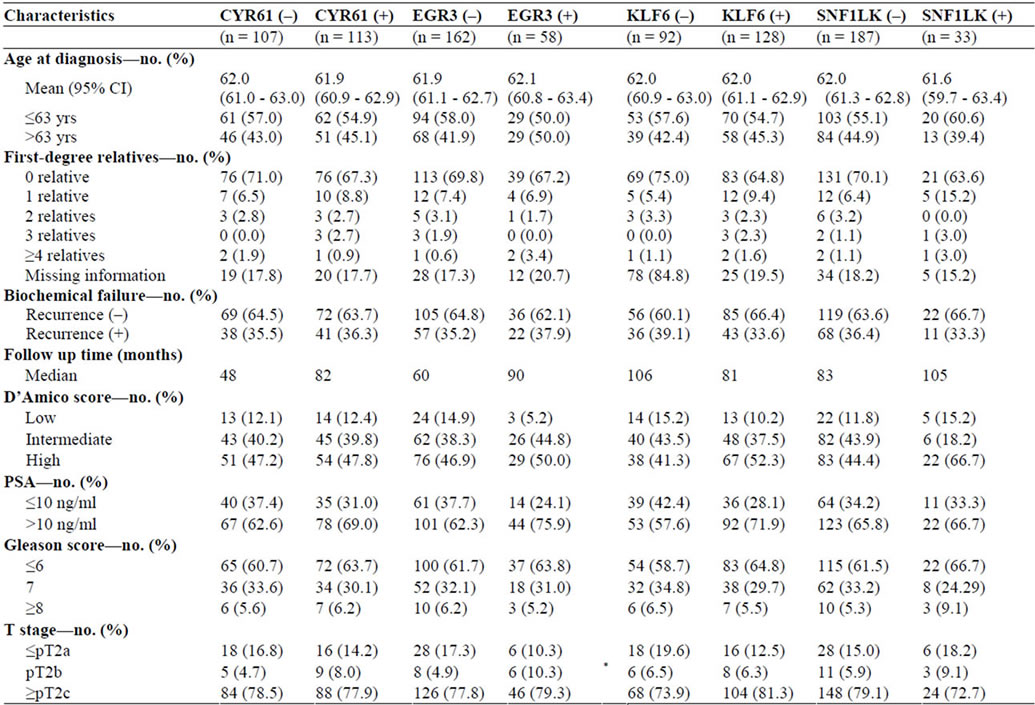
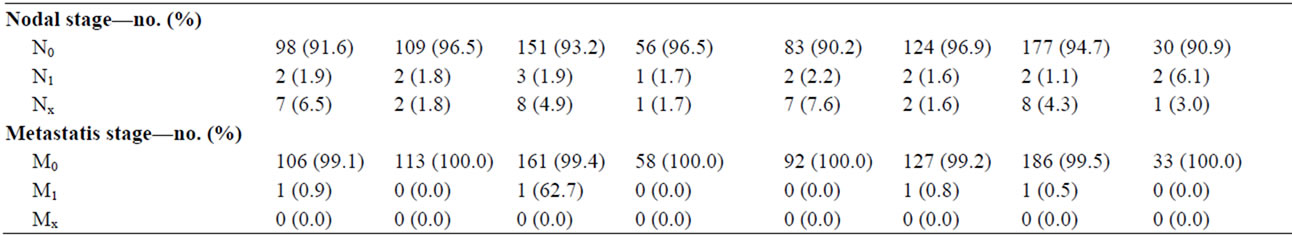
Table 4. Demographic and clinical characteristics of the patients analyzed in the tissue microarray. The patients are divided in groups according to the absence/presence of staining for CYR61, EGR3, KLF6 and SNF1LK. D’Amico score are based on preoperative PSA, Gleason score and T stage whereas Gleason score and TNM in the table are postoperative. *EGR3 staining and T stage were found to be significantly associated using Fisher’s exact test, p = 0.04. No other significant differences or associations were detected.
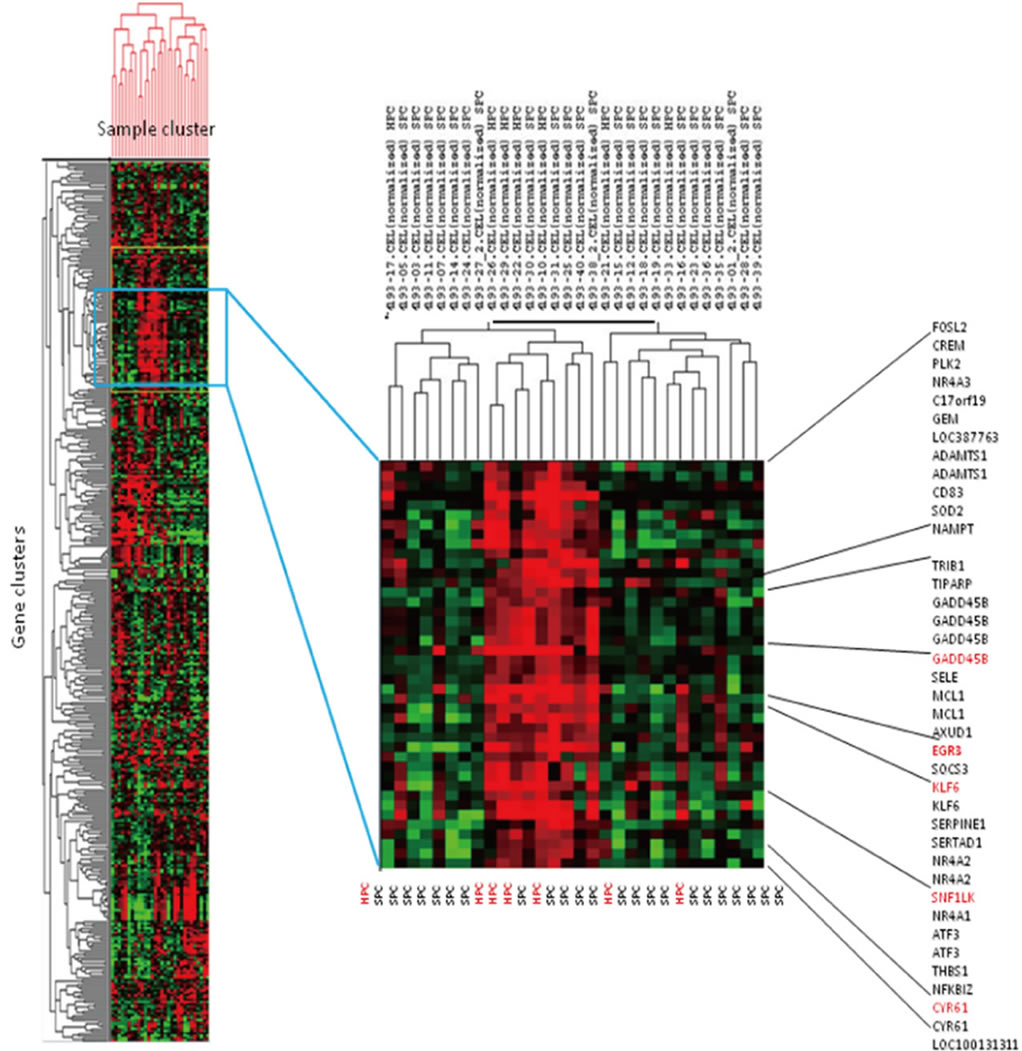
Figure 2. Cluster heatmap of gene cluster (vertical) and sample cluster (horizontal). The samples in each column and the genes in each row were (re)arranged; genes of similar pattern were placed close to each other, and samples with comparable traits were clustered. The color red represented high expression, and low expression was represented by the color green. The samples with expression above mean expression (red) were clustered side by side, including both HPC and SPC cases.
One cluster of tumors included 3 of the 7 HPC cases analyzed. By further investigating an associated gene cluster which showed general upregulation of the genes, we selected a panel of 4 up-regulated transcripts (CYR61, EGR3, KLF6 and SNF1LK), and the corresponding protein products were selected for immunohistochemistry. The general gene expression levels are visualized graphically in Figure 3: EGR3 (median = 5.47) and SNF1LK (median = 7.75) were observed with an intermediate expression level whereas CYR61 (median = 9.80) had a generally high expression, and KLF6 (median = 5.65) had a generally lower expression level across the samples. Fold changes are summarized in Table 5.
3.2. Immunohistochemical Analysis
Antibodies against CYR61, EGR3, KLF6 and SNF1LK were tested on slides from 8 HPC and 18 SPC cases. The fraction of stained tumor cells in both groups was estimated ranging from 0% - 100% (median, 75%) for CYR1, 80% - 100% (90%) for EGR3, 0% - 100% (30%) for KLF6, and 0% - 100% (0%) for SNF1LK. Cytoplasmic staining of CYR61 and EGR3 and nuclear staining of KLF6 and SNF1LK were expected; however, immunopositivity of every protein was located mainly in the cytoplasma and the membrane and only occasionally observed in cell nuclei.
Figure 3. Transcript levels of CYR61, EGR3, KLF6 and SNF1LK for the HPC and SPC groups. Transcript expression in log2-scale on y-axis.
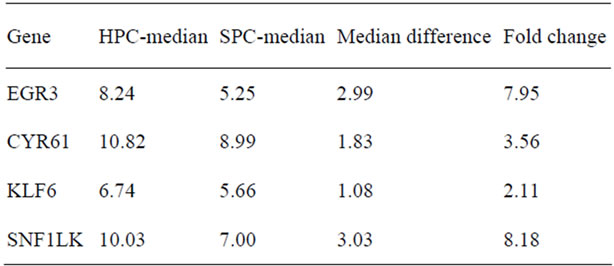
Table 5. HPC-median is median for HPC cases; SPC-median is median for SPC cases. Fold change is calculated as 2(median difference).
When quantifying the stainings by either the presence/ absence of staining or the fraction of stained tumor cells, no significant difference was observed between HPC and SPC groups in the expression of EGR3, CYR61, KLF6 or SNF1LK protein (p = 0.508; p = 0.456; p = 0.253; p = 0.583, respectively) (Table 4).
3.3. Tissue Microarray Analysis
To investigate the potential correlation of CYR61, EGR3, KLF6 and SNF1LK protein levels with clinical characteristics and disease-free survival after prostatectomy, we stained tissue microarrays comprising a larger set of patients with HPC (n = 12) and SPC (n = 152), as well as patients with a family history of prostate cancer that did not meet the criteria for HPC (n = 56). Staining results were similar to those obtained with conventional histological sections (Figure 4). The median stained percentage of cells were 10% for CYR61, 50% for KLF6, 5% for EGR3 and SNF1LK. We found no significant differences in staining intensities between HPC and SPC groups. The relationship between clinical characteristics and staining results are summarized in Table 5. Kaplan Meier curves for biochemical relapse-free survival are shown in Figure 5. In general, staining intensities of the four proteins did not correlate with the clinico-pathological variables or disease-free survival except for EGR3, which was associated with T stage (p = 0.04).
4. Discussion
HPC accounts for 5% - 10% of all prostate cancer and so far, no clinicopathological phenotypes have been clearly described to distinguish this group from SPC, except early onset [6,24-29]. We hypothesized that cases of HPC may be characterized by a special gene expression profile, and identified four candidates through microarray gene expression analysis and unsupervised hierarchical cluster analysis: CYR61, EGR3, KLF6 and SNF1LK. However, we were not able to confirm the differential expression of these genes on the protein level in a separate set of HPC and SPC tumors. Neither were their protein levels correlated with clinical characteristics or biochemical relapse when analyzed in a larger sample of prostate cancer cases, except that EGR3 expression was found to be associated with a low T stage.
4.1. Candidate Genes
CYR61 is a member of the group of growth factor inducible immediate-early genes and a member of the CCN family, hence the CNN/CYR61 referral [30]. Cancers in several organs, including the prostate, have been observed to have an altered expression level of CYR61, which may either stimulate or inhibit tumor growth dependent on the type of cancer [31-36]. Through its multiple regulatory functions in cardinal cell activities such as apoptosis, proliferation, differentiation, growth arrest and connective tissue production, CYR61 may contribute to angiogenesis, tumorigenesis, wound healing and chondrogenesis. The function and localization of CYR61 are associated with extracellular matrix and cell surfaces. It was originally reported to be down-regulated in prostate cancer; however, we discovered an upregulation of the CYR61 of the transcript in HPC samples. We also observed both a nuclear and cytoplasmic localization of the protein which complies with the findings of Timura et al. in cultured bladder smooth muscle cells [37,38]. Yet, we assessed no difference in staining intensity between HPC and SPC specimens, and no associations with clinical parameters or biochemical relapse.
KLF6 is a zinc finger transcription factor and a member of Krüppel-like factors equipped with similarly broad biological properties as the CNN family. Narla et al investigated the expression of a splice form of KLF6 (KLFSV1) in clinically localized prostate cancer and found that increased expression of KLF6-SV1 predicted biochemical relapse and reduced survival after prostatectomy [39]. In our study, clinico-pathology, heredity and biochemical relapse were not associated with KLF6 expression levels.
 (a)
(a)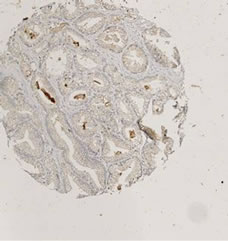 (b)
(b)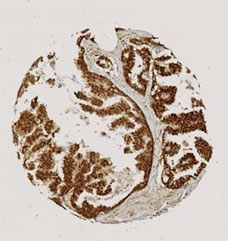 (c)
(c)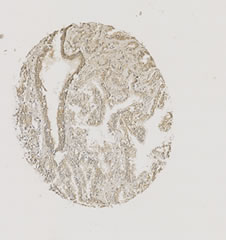 (d)
(d)
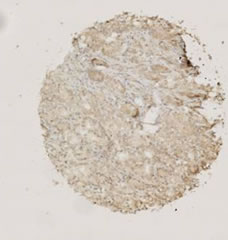
Figure 4. Immunohistochemical stainings of selected cores from the tissue microarray. The cores are chosen to reflect the wide range of expression levels among cases. (a) CYR61; (b) EGR3; (c) KFL6; (d) SNF1LK.
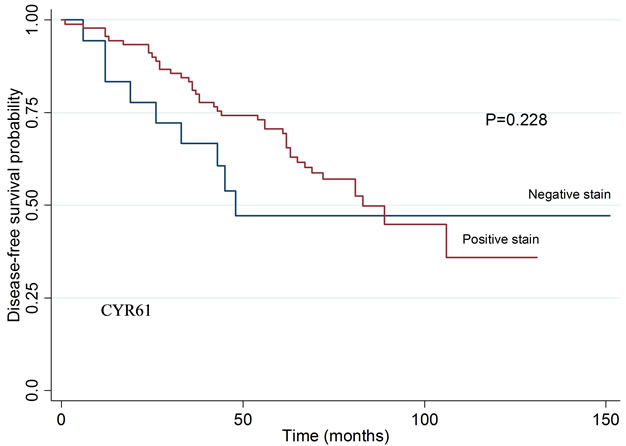
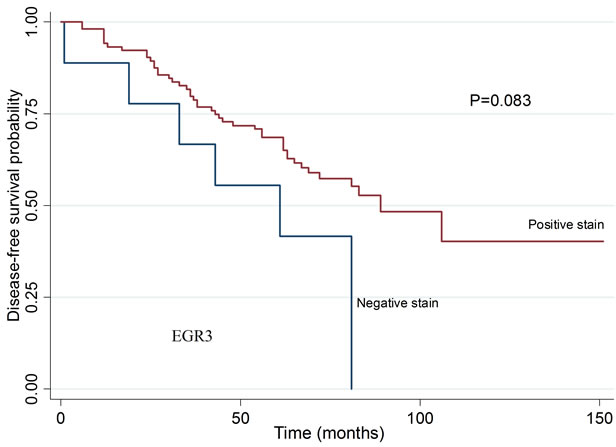
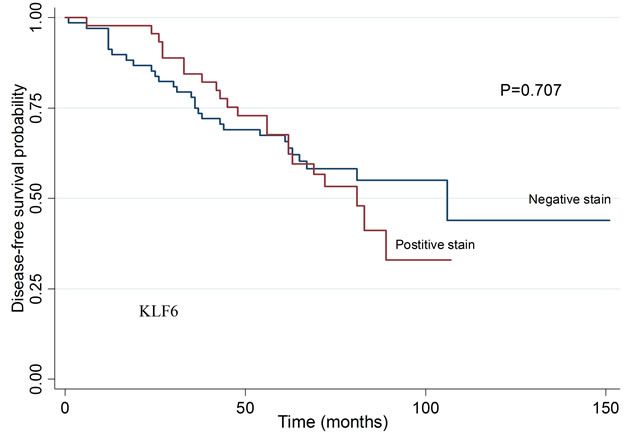
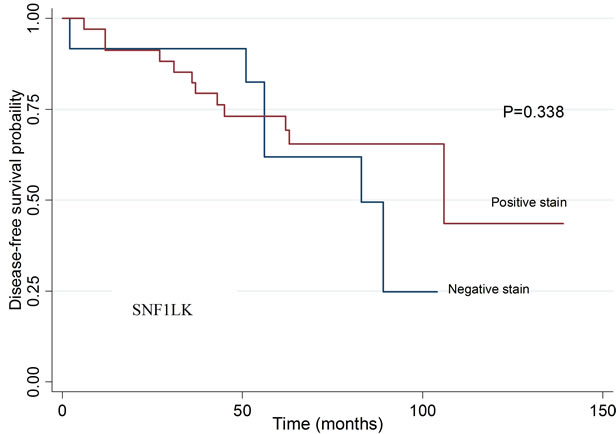
Figure 5. Biochemical disease-free survival in patients related to tumor staining intensity for CYR61, EGR3, KLF6, and SNF1LK. Kaplan Meier curve and log rank test. No statistically significant differences were detected. CYR61: p = 0.228, EGR3: p = 0.083, KLF: p = 0.7076 and SNF1LK: p = 0.338.
EGR3 has been identified as a member of the early growth response (EGR) family of transcription factors [40]. We found that the expression level of EGR3 were associated with a lower T stage, but not other clinical parameters or biochemical relapse. Although the association with T stage may be an interesting finding, it cannot be excluded that it may have occured by chance especially since a significant number of statistical analysis were performed to detect potential associations. SNF1LK Serine/threonine-protein kinase (SIK1) is an enzyme. SIK1 has been identified as a mediator in metastasis suppression and anoikis [41]. In the present study, however, SNF1LK expression was not associated with heredity, clinical variables or biochemical relapse.
4.2. Immunohistochemical Stainings
The staining pattern of our immunohistochemistry was not entirely as expected from previous descriptions. Staining was previously found to be located in nuclei for KLF6 and SNF1LK and be strictly cytoplasmic/membraneous for EGR3 and CYR61 [4]. In our assays, the immunopositivity of all proteins was detected preferably in the cytoplasma and rather dense luminally, but inconsistently in nuclei.
It was difficult to obtain paraffin blocks for histological validation from the same cases that were analyzed by microarray analysis; as an alternative, we assessed other cases from the same cohort. The fact that we were not able to confirm the gene expression differences on the protein level may be because of the wide variation in staining intensities and the limited number of samples. However, it may also suggest that the expression differences observed in the microarray gene expression experiment was a chance finding, or that the immunohistological analysis used to analyze protein levels were not sufficiently specific or quantitative. On the other hand, transcriptional differences are not always mirrored by protein levels. Validation of the gene expression data by quantitative RT-PCR in the same or independent samples would strengten our findings. Moreover, specificity of the immunstaining assays should be further tested, and the findings would also be supported by using an additional method to measure protein levels, e.g. Western blot.
4.3. Limitations
Several limitations may have affected our results, including the definition used to identify cases of HPC, the validity of the self-reported family histories, potential genetic heterogeneity of the HPC cases, and the small sample size for microarray gene expression profiling.
We based our inclusion to the HPC group on self-reported family history of the patients and Carter’s criteria. Although these criteria has been the cornerstone of many major epidemiological studies and biological experiments, it must be kept in mind that the definition by Carter et al. was established on the basis of epidemiological data, and it is not possible to distinguish true cases with HPC from “phenocopies” in the family [42,43]. Furthermore, even if all HPC cases are correctly classified, they may have different genetic causes.
The discussion about sample size and power in genome-wide studies is complicated by the fact that biological samples are difficult to obtain due to ethical guidelines. The purpose was to characterize the study population in the Aarhus Prostate Cancer Study. Even though we calculated the necessary sample size of HPC cases to 50 in order to detect any difference in gene expression under the null-hypothesis, the sample size for HPC was seven in the microarray study and eight for immunohistochemistry. The microarray technology used requires statistical stringency to consider all genes concurrently and independently [44]. Thus, we used Bonferroni correction to correct for multiple comparisons. However, the power of the microarray study would be increased and the chance for selection of truly differentially expressed genes improved if more cases were included.
5. Conclusion
Overall, no single transcript levels were significantly associated with HPC in the present study after adjustment for multiple testing. Cluster analysis suggested that the expression of CYR61, EGR3, KLF6 and SNF1LK were upregulated in cancer tissue from HPC cases, but we were not able to confirm this on the protein level, and protein levels were not found to correlate with clinicopathological characteristics or biochemical recurrence.
REFERENCES
- B. S. Carter, T. H. Beaty, G. D. Steinberg, B. Childs and P. C. Walsh, “Mendelian Inheritance of Familial Prostate Cancer,” Proceedings of the National Academy of Sciences of USA, Vol. 15, No. 8, 1992, pp. 3367-3371.
- D. J. Schaid, S. K. McDonnell, M. L. Blute and S. N. Thibodeau, “Evidence for Autosomal Dominant Inheritance of Prostate Cancer,” The American Journal of Human Genetics, Vol. 62, No. 6, 1998, pp. 1425-1438. doi:10.1086/301862
- E. Sacco, T. Prayer-Galetti, F. Pinto, M. Ciaccia, S. Fracalanza, G. Betto, et al., “Familial and Hereditary Pros= tate Cancer by Definition in an Italian Surgical Series: Clinical Features and Outcome,” European Urology, Vol. 47, No. 6, 2005, pp. 761-768. doi:10.1016/j.eururo.2005.01.016
- Human Protein Atlas. 2011. http://www.proteinatlas.org/
- International HapMap Project. http://hapmap.ncbi.nlm.nih.gov/
- H. Gronberg, L. Damber, B. Tavelin and J. E. Damber, “No Difference in Survival between Sporadic, Familial and Hereditary Prostate Cancer,” British Journal of Urology, Vol. 82, No. 4, 1998, pp. 564-567. doi:10.1046/j.1464-410X.1998.00801.x
- J. Xu, “Combined Analysis of Hereditary Prostate Cancer Linkage to 1q24-25: Results from 772 Hereditary Prostate Cancer Families from the International Consortium for Prostate Cancer Genetics,” The American Journal of Human Genetics, Vol. 66, No. 3, 2000, pp. 945-957. doi:10.1086/302807
- J. Carpten, N. Nupponen, S. Isaacs, R. Sood, C. Robbins, J. Xu, et al., “Germline Mutations in the Ribonuclease L Gene in Families Showing Linkage with HPC1,” Nature Genetics, Vol. 30, No. 2, 2002, pp. 181-184. doi:10.1038/ng823
- G. Casey, P. J. Neville, S. J. Plummer, Y. Xiang, L. M. Krumroy, E. A. Klein, et al., ”RNASEL Arg462Gln Variant Is Implicated in up to 13% of Prostate Cancer Cases,” Nature Genetics, Vol. 32, No. 4, 2002, pp. 581-583. doi:10.1038/ng1021
- M. L. Freedman, C. A. Haiman, N. Patterson, G. J. McDonald, A. Tandon, A Waliszewska, et al., “Admixture Mapping Identifies 8q24 as a Prostate Cancer Risk Locus in African-American Men,” Proceedings of the National Academy of Sciences of USA, Vol. 103, No. 38, 2006, pp. 14068-14073.
- J. Gudmundsson, P. Sulem, A. Manolescu, L. T. Amundadottir, D. Gudbjartsson, A. Helgason, et al., “Genomewide Association Study Identifies a Second Prostate Cancer Susceptibility Variant at 8q24,” Nature Genetics, Vol. 39, No. 5, 2007, pp. 631-637. doi:10.1038/ng1999
- C. A. Haiman, N. Patterson, M. L. Freedman, S. R. Myers, M. C. Pike, A. Waliszewska, et al., “Multiple Regions within 8q24 Independently Affect Risk for Prostate Cancer,” Nature Genetics, Vol. 39, No. 5, 2007, pp. 638-644. doi:10.1038/ng2015
- G. Thomas, K. B. Jacobs, M. Yeager, P. Kraft, S. Wacholder, N. Orr, et al., ”Multiple Loci Identified in a Genome-Wide Association Study of Prostate Cancer,” Nature Genetics, Vol. 40, No. 3, 2008, pp. 310-315. doi:10.1038/ng.91
- M. Yeager, N. Chatterjee, J. Ciampa, K. B. Jacobs, J. Gonzalez-Bosquet, R. B. Hayes, et al., “Identification of a New Prostate Cancer Susceptibility Locus on Chromosome 8q24,” Nature Genetics, Vol. 41, No. 10, 2009, pp. 1055-1057. doi:10.1038/ng.444
- A. A. Al Olama, Z. Kote-Jarai, G. G. Giles, M. Guy, J. Morrison, G. Severi, et al., “Multiple Loci on 8q24 Associated with Prostate Cancer Susceptibility,” Nature Genetics, Vol. 41, No. 10, 2009, pp. 1058-1060. doi:10.1038/ng.452
- R. A. Eeles, Z. Kote-Jarai, A. A. Al Olama, G. G. Giles, M. Guy, G. Severi, et al., “Identification of Seven New Prostate Cancer Susceptibility Loci through a GenomeWide Association Study,” Nature Genetics, Vol. 41, No. 10, 2009, pp. 1116-1121. doi:10.1038/ng.450
- S. L. Zheng, J. Sun, F. Wiklund, S. Smith, P. Stattin, G. Li, et al., “Cumulative Association of Five Genetic Variants with Prostate Cancer,” The New England Journal of Medicine, Vol. 358, No. 9, 2008, pp. 910-919.
- Z. Kote-Jarai, A. A. Olama, G. G. Giles, G. Severi, J. Schleutker, M. Weischer, et al., “Seven Prostate Cancer Susceptibility Loci Identified by a Multi-Stage GenomeWide Association Study,” Nature Genetics, Vol. 43, No. 8, 2011, pp. 785-791.
- T. Thykjaer, C. Workman, M. Kruhoffer, K. Demtroder, H. Wolf, L. D. Andersen, et al., “Identification of Gene Expression Patterns in Superficial and Invasive Human Bladder Cancer,” Cancer Research, Vol. 61, No. 6, 2001, pp. 2492-2499.
- Z. Wu and R. A. Irizarry, “Preprocessing of Oligonucleotide Array Data,” Nature Biotechnology, Vol. 22, No. 6, 2004, pp. 656-658.
- M. B. Eisen, P. T. Spellman, P. O. Brown and D. Botstein, “Cluster Analysis and Display of Genome-Wide Expression Patterns,” Proceedings of the National Academy of Sciences of USA, Vol. 95, No. 25, 1998, pp. 14863-14868.
- L. Bubendorf, “High-Throughput Microarray Technologies: From Genomics to Clinics,” European Urology, Vol. 40, No. 2, 2001, pp. 231-238. doi:10.1159/000049777
- S. Heeboll, M. Borre, P. D. Ottosen, C. L. Andersen, F. Mansilla, L. Dyrskjot, et al., “SMARCC1 Expression Is Upregulated in Prostate Cancer and Positively Correlated with Tumour Recurrence and Dedifferentiation,” Histology and Histopathology, Vol. 23, No. 9, 2008, pp. 1069-1076.
- M. P. Bravo, A. de Palacio and J. del Rey Calero, “Epidemiology of Cancer of the Prostate. Descriptive Study,” Archivos Espanoles de Urologia, Vol. 43, No. 4, 1990, pp. 349-352.
- H. Gronberg, J. E. Damber, H. Jonsson and P. Lenner, “Patient Age as a Prognostic Factor in Prostate Cancer,” Journal of Urology, Vol. 152, No. 3, 1994, pp. 892-895.
- O. Bratt, U. Kristoffersson, H. Olsson and R. Lundgren, “Clinical Course of Early Onset Prostate Cancer with Special Reference to Family History as a Progostic Factor,” European Urology, Vol. 34, No. 1, 1998, pp. 19-24. doi:10.1159/000019672
- O. W. Brawley, K. Knopf and R. Merrill, “The Epidemiology of Prostate Cancer Part I: Descriptive Epidemiology,” Seminars in Urologic Oncology, Vol. 16, No. 4, 1998, pp. 187-192.
- S. V. Kotsis, S. L. Spencer, P. A. Peyser, J. E. Montie and K. A. Cooney, “Early Onset Prostate Cancer: Predictors of Clinical Grade,” Journal of Urology, Vol. 167, No. 4, 2002, pp. 1659-1663. doi:10.1016/S0022-5347(05)65173-7
- E. Spangler, C. M. Zeigler-Johnson, S. B. Malkowicz, A. J. Wein and T. R. Rebbeck, “Association of Prostate Cancer Family History with histopathological and Clinical Characteristics of Prostate Tumors,” International Journal of Cancer, Vol. 113, No. 3, 2005, pp. 471-474.
- Y. Chen and X. Y. Du, “Functional Properties and Intracellular Signaling of CCN1/Cyr61,” Journal of Cellular Biochemistry, Vol. 100, No. 6, 2007, pp. 1337-1345. doi:10.1002/jcb.21194
- N. Planque and B. Perbal, “A Structural Approach to the Role of CCN (CYR61/CTGF/NOV) Proteins in Tumourigenesis,” Cancer Cell International, Vol. 3, No. 1, 2003, p. 15.
- S. E. Holloway, A. W. Beck, L. Girard, M. R. Jaber, C. C. Barnett Jr., R. A. Brekken, et al., “Increased Expression of Cyr61 (CCN1) Identified in Peritoneal Metastases from Human Pancreatic Cancer,” Journal of the American College of Surgeons, Vol. 200, No. 3, 2005, pp. 371-377. doi:10.1016/j.jamcollsurg.2004.10.005
- M. T. Lin, C. C. Chang, B. R. Lin, H. Y. Yang, C. Y. Chu, M. H. Wu, et al., “Elevated Expression of Cyr61 Enhances Peritoneal Dissemination of Gastric Cancer Cells through Integrin α2β1,” The Journal of Biological Chemistry, Vol. 282, No. 47, 2007, pp. 34594-34604. doi:10.1074/jbc.M706600200
- A. M. Bleau, N. Planque and B. Perbal, “CCN Proteins and Cancer: Two to Tango,” Frontiers in Bioscience, Vol. 10, 2005, pp. 998-1009. doi:10.2741/1594
- P. Feng, B. Wang and E. C. Ren, “Cyr61/CCN1 Is a Tumor Suppressor in Human Hepatocellular Carcinoma and Involved in DNA Damage Response,” The International Journal of Biochemistry & Cell Biology, Vol. 40, No. 1, 2008, pp. 98-109. doi:10.1016/j.biocel.2007.06.020
- K. B. D’Antonio, L. Schultz, R. Albadine, A. M. Mondul, E. A. Platz, G. J. Netto, et al., “Decreased Expression of Cyr61 Is Associated with Prostate Cancer Recurrence after Surgical Treatment,” Clinical Cancer Research, Vol. 16, No. 23, 2010, pp. 5908-5913. doi:10.1158/1078-0432.CCR-10-1200
- C. P. Pilarsky, U. Schmidt, C. Eissrich, J. Stade, S. E. Froschermaier, M. Haase, et al., “Expression of the Extracellular Matrix Signaling Molecule Cyr61 Is Downregulated in Prostate Cancer,” Prostate, Vol. 36, No. 2, 1998, pp. 85-91. doi:10.1002/(SICI)1097-0045(19980701)36:2<85::AID-PROS3>3.0.CO;2-D
- K. Tamura, M. Furihata, T. Tsunoda, S. Ashida, R. Takata, W. Obara, et al., “Molecular Features of HormoneRefractory Prostate Cancer Cells by Genome-Wide Gene Expression Profiles,” Cancer Research, Vol. 67, No. 11, 2007, pp. 5117-5125. doi:10.1158/0008-5472.CAN-06-4040
- G. Narla, A. DiFeo, Y. Fernandez, S. Dhanasekaran, F. Huang, J. Sangodkar, et al., “KLF6-SV1 Overexpression Accelerates Human and Mouse Prostate Cancer Progression and Metastasis,” Journal of Clinical Investigation, Vol. 118, No. 8, 2008, pp. 2711-2721. doi:10.1172/JCI34780
- S. Patwardhan, A. Gashler, M. G. Siegel, L. C. Chang, L. J. Joseph, T. B. Shows, et al., “EGR3, a Novel Member of the Egr Family of Genes Encoding Immediate-Early Transcription Factors,” Oncogene, Vol. 6, No. 6, 1991, pp. 917-928.
- H. Cheng, P. Liu, Z. C. Wang, L. Zou, S. Santiago, V. Garbitt, et al., “SIK1 Couples LKB1 to p53-Dependent Anoikis and Suppresses Metastasis,” Science Signaling, Vol. 2, No. 80, 2009, p. ra35. doi:10.1126/scisignal.2000369
- W. F. Page, M. M. Braun, A. W. Partin, N. Caporaso and P. Walsh, “Heredity and Prostate Cancer: A Study of World War II Veteran Twins,” Prostate, Vol. 33, No. 4, 1997, pp. 240-245. doi:10.1002/(SICI)1097-0045(19971201)33:4<240::AID-PROS3>3.0.CO;2-L
- P. Lichtenstein, N. V. Holm, P. K. Verkasalo, A. Iliadou, J. Kaprio, M. Koskenvuo, et al., “Environmental and Heritable Factors in the Causation of Cancer—Analyses of Cohorts of Twins from Sweden, Denmark, and Finland,” The New England Journal of Medicine, Vol. 343, No. 2, 2000, pp. 78-85. doi:10.1056/NEJM200007133430201
- A. Dupuy and R. M. Simon, “Critical Review of Published Microarray Studies for Cancer Outcome and Guidelines on Statistical Analysis and Reporting,” Journal of the National Cancer Institure, Vol. 99, No. 2, 2007, pp. 147-157. doi:10.1093/jnci/djk018