Atmospheric and Climate Sciences
Vol.3 No.2(2013), Article ID:30772,15 pages DOI:10.4236/acs.2013.32021
Evaluation of Spatial-Temporal Variability of Drought Events in Iran Using Palmer Drought Severity Index and Its Principal Factors (through 1951-2005)
Atmospheric Sciences and Meteorological Research Centre (ASMERC), Tehran, Iran
Email: #ali_didehvar714@yahoo.com
Copyright © 2013 Mojtaba Zoljoodi, Ali Didevarasl. This is an open access article distributed under the Creative Commons Attribution License, which permits unrestricted use, distribution, and reproduction in any medium, provided the original work is properly cited.
Received February 2, 2013; revised March 4, 2013; accepted March 11, 2013
Keywords: Intensity and Variability of Droughts; Palmer Drought Severity Index (PDSI); Basic Statistical Approaches; La Nina; Iran
ABSTRACT
Intensity and variability of droughts are considered in Iran during the period 1951 to 2005. Four variables are considered: the Palmer Drought Severity Index (PDSI), the soil moisture, the temperature and the precipitation (products used for the analysis are downloaded from the NCAR website). Link with the climatic index La Nina is also considered (NOAA downloadable products is used). The analysis is based on basic statistical approaches (correlation, linear regressions and Principal Component Analysis). The analysis shows that PDSI is highly correlated to the soil moisture and poorly correlated to the other variables—although the temperature in the warm season shows high correlation to the PDSI and that a severe drought was experienced during 1999-2002 in the country.
1. Introduction
Drought incidences, regardless their severity, have became more common in recent years in parallel with global climate changes. Drought is a gradual phenomenon, slowly taking hold of an area and tightening its grip with time. Sometimes, in severe cases, drought can last for many years and can have devastating effects on the socioeconomic, agricultural, and environmental conditions that may result from one or more of the water-scarcity factors by insufficient precipitation, high evapotranspiration, and over-exploitation of water resources [1-3].
Severe drought over this spell of three years (1998- 2001), in combination with the effects of protracted socio-political disruption, has led to widespread faming affecting over 60 million people in central and southwest Asia [4].
Regarding physical geography, Iran has arid and semi-arid climates mostly characterized by low rainfall and high potential evapotranspiration [5]. The annual precipitation varies from about 1800 mm over the western Caspian Sea coast and western highlands to less than 50 mm over the uninhabitable eastern and central deserts.
The average annual precipitation over the country is estimated to be around 250 mm, occurring mostly from October to March. Annual precipitation is lower in the eastern half of Iran compared with the western half. Drought events and the rainfall shortage result in many natural difficulties, and characterize the climatic behaviour throughout this country. Drought annually hits most Iranian provinces. This was particularly the case during the recent spell of 1999-2002 which was the worst drought event since 1950 to the present [6]. Drought, naturally, is a recurring phenomenon whose duration and intensity are unpredictable. Drought can occur in any place with precipitation. Keep in mind that, dry and semi-dry places, or places with little precipitation (climatically dry-lands) are not considered as places with permanent drought. Droughts occur when the needed water for a site is basically less than a specific amount. Droughts are long-term hydrological events affecting vast regions and causing significant non-structural damage. Droughts are the costliest natural disaster in the world and affect more people than any other natural disaster [3]. The Middle East is a region of extremes. It is almost one of the driest and most water scarce areas of the world [7].
Iran, located in the south-western part of Asia and the Middle East receives one-third of the world’s average precipitation [8].
In order to mitigate the destructive drought impacts on local ecosystems, economy and society, it is necessary to generate various studies. Prior to any research on drought impact assessment, this natural disaster ought to be defined in detail.
Generally, droughts can be classified into agricultural, hydrological or meteorological in which avoiding meteorological drought is impossible; however, they can be predicted and monitored to alleviate their adverse impacts [9-13]. To quantify drought and monitor its development, many drought indices have been developed and applied [14-19]. A large number of drought indices have been suggested to date, including Palmer Drought Severity Index [12], Crop Moisture index [20], Agro-hydro Potential [21], Surface Water Supply Index [22], vegetative drought index of Normalized Difference Vegetations Index [23], Standardized Precipitation Index [24], Deciles [25], and multiple indices of low river flow [26].
Among them, the Palmer Drought Severity Index (PDSI) is the most prominent index of meteorological drought used in the United States for drought monitoring and research [15]. Besides PDSI’s routine use for monitoring droughts in the United States, the PDSI has been used to study drought climatology and variability in the United States [27,28], Europe [29,30], Africa [31], Brazil [32], and other areas. The PDSI was also used in tree ringbased reconstructions of droughts in the United States [33-35]. Most of these studies are regional and focus on a particular location or nation. One exception is Dai et al. (1998) who calculated the PDSI for global land areas for 1900-1995 and analyzed the influence of El Niño-Southern Oscillation (ENSO) on dry and wet areas around the globe [36]. This study updates the global PDSI dataset of Dai et al. (1998), provides a detailed evaluation of the PDSI against available soil moisture and stream flow data, examines the trends and leading modes of variability in the twentieth-century PDSI fields, and investigates the impact of surface warming in the latter half of the twentieth century on global drought and wet areas [36].
Since Iran is located in an area of arid and semi-arid climates and is frequently affected by droughts, a great deal of research on drought monitoring and analysis has already been carried out. For example: Rahimzadeh P. et al. in 2008 [37], developed a research study “Using AVHRR-based vegetation indices for drought monitoring in the Northwest of Iran”, the results indicated that NOAA-AVHRR derived NDVI well reflects precipitation fluctuations in the study area, promising a possibility for the early drought awareness necessary for drought risk management. Raziei T. et al. in 2008 studied [38] “A precipitation-based regionalization for Western Iran and regional drought variability”; Results show that the northern and southern regions of western Iran are characterized by different climatic variability. Shiau J. T. and Modarres R. in 2009 [39], have studied “Copula-based drought severity-duration-frequency analysis in Iran”; this research implies that the drought severity in humid regions might be more severe if high rainfall fluctuations exist in that region.
Morid S. et al. in 2006 [40], developed a research study “Comparison of seven meteorological indices for drought monitoring in Iran”, in which they found the SPI and EDI were able to consistently detect the onset of drought, as well as its spatial and temporal variation, and may be recommended for operational drought monitoring in the Tehran province. However, the EDI was found to be more responsive to the emerging drought and performed better.
Rahimzadeh F. et al. in 2008 [41], studied “Variability of extreme temperature and precipitation in Iran during recent decades”, and observed a negative trend for about two-thirds of the country for annual total wet days precipitation.
2. Study Area
Iran is one of the large semi-arid countries of the world with an area of 1,648,000 km2, respectively with elevations ranging from –28 m (Caspian sea) to 5671 m (Damavand), and a mean rainfall of 250 mm yearly. Iran is located in the southwest of Asia and it borders the Gulf of Oman, the Persian Gulf (in the south), and the Caspian Sea (in the north) with a geographical position of 25˚N - 40˚N and 44˚E - 64˚E. The topography of the country features two main mountain chains: the Alborz Mountains (from northwest towards northeast of the country) and the Zagros Mountains, a series of parallel ridges interspersed with plains that bisect the country from northwest to southeast. The center of Iran consists of several closed basins that collectively are referred to as the Central Plateau. The eastern part of the plateau is covered by two salt deserts, the Dasht-e Kavir (Great Salt Desert) and the Dasht-e Lut (Figure 1).
3. Data
3.1. Palmer Drought Severity Index
Palmer (1965) developed a soil moisture algorithm, which uses precipitation, temperature data and local Available Water Content (AWC) of the soil. AWC is effectively a “model parameter”, which has to be set at the start of calculations. Calculations result in an index (PDSI), which indicates standardized moisture conditions and

Figure 1. Geographic position and average annual precipitation of the study area (Iran).
allows comparisons to be made between locations and between months. PDSI varies roughly between –6.0 and +6.0. wetter conditions are indicated by positive values of PDSI, drier by its negative values. Thresholds for classification of different wetness are arbitrary. PDSI values between −2 and +2 would normally indicate normal conditions, although the sub-range of −1 to −2 could also be treated as mild drought. PDSI in values in the range of −2 to −3 are indicative of moderate drought, −3 to −4 points to severe drought and values less than −4 would be associated with extreme drought.
The computation of the PDSI begins with a climatic water balance using historic records of monthly precipitation and temperature. Soil moisture storage is considered by dividing the soil into two layers. The upper layer is assumed to contain 1 inch (25.4 mm) of available moisture at field capacity. The underlying layer has an available capacity that depends on the soil characteristics of the site. Palmer used an available water capacity (AWC) of 9 inches for central Iowa and 5 inches for western Kansas. The AWC value should be representative of the area soils in general. Moisture cannot be removed from the lower layer until the top layer is dry. Runoff (RO) is assumed to occur when both layers reach their combined moisture capacity (AWC).
Four potential values are computed:
1) Potential evapotranspiration (PE, e.g. by Hargreaves equation or other)2) Potential recharge (PR)—the amount of moisture required to bring the soil to field capacity.
3) Potential loss (PL)—the amount of moisture that could be lost from the soil to evapotranspiration provided precipitation during the period was zero.
4) Potential runoff (PRO)—the difference between the potential precipitation and the PR.
The climate coefficients are computed as a proportion between averages of actual versus potential values for each of 12 months. These climate coefficients are used to compute the amount of precipitation required for the Climatically Appropriate for Existing Conditions (CAFEC). The difference, d, between the actual (P) and CAFEC precipitation (![]() ) is an indicator of water deficiency for each month.
) is an indicator of water deficiency for each month.
 (1)
(1)
where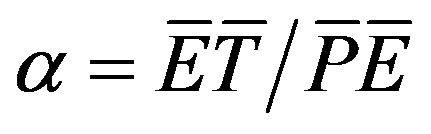 ,
,  ,
,  , and
, and  for 12 months. The value of d is regarded as a moisture departure from normal because the CAFEC precipitation is an adjusted normal precipitation.
A Palmer Moisture Anomaly Index (PMAI), Z, is then defined as
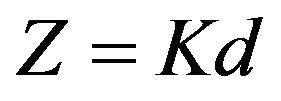 (2)
(2)
where K is a weighting factor. The value of K is determined from the climate record before the actual model calculation. Palmer suggested empirical relationships for K such that
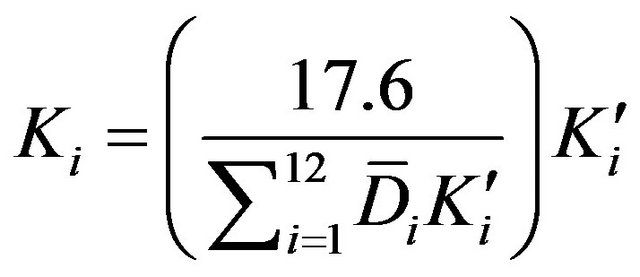 (3)
(3)
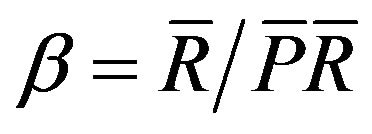
where  is the average of the absolute values of d, and
  is dependent on the average water supply and demand, given by
 (4)
(4)
where PE is the potential evapotranspiration, R is the recharge, RO is the runoff, P is the precipitation, and L is the loss. The PDSI is now given by
 (5)
(5)
where the PDSI of the initial month in a dry or wet spell is equal to .
.
The basic spatial calculation of the PDSI values was based on the station’s datasets, which consider the measure-points. The values obtained through these measurepoints are used for calculation of the PDSI average values in each grid-point (a square of 2.5˚ × 2.5˚). This calculation is done through the statistic analyses (filtrage, Krigeage, etc.) which eliminate essentially the under network irregularities This research is developed based on the calculated PDSI data-set which is available on the NCAR website (http://iridl.ldeo.columbia.edu/SOURCES/.NCAR/.CGD/. CAS/.Indices/.PDSI2004/.PDSI). This data set has been calculated on a worldwide scale for a period extending more than 130 years (1870-2005). The PDSI dataset is arranged into geo-points with the dimension of 2.5˚ × 2.5˚, and is useable in monthly series.
We have obtained the PDSI dataset during the study period (1951-2005) in a monthly series (55 years = 660 months) over an area more vast than Iran’s precise territorial extent of 40˚ to 65˚ longitude and 25˚ to 40˚ latitude. As mentioned above the dataset is in geo-points of 2.5˚ × 2.5˚ that cover the study area as a network (surface) with 60 grid-points with a dimension of 6 grid-points (15 degrees of latitude) to 10 grid-points (25 degrees of longitude).
3.2. Soil Moisture
The study of the surface hydrology invariably starts with the equation below dw = dt = P _ E _ R _ G where w: soil moisture in a single column of depth 1.6 meter, mm; P: precipitation, mm/month; E: evaporation, mm/month; R: runoff, mm/month; G: loss to groundwater, mm/month.
Equation (1) is applied locally. All quantities are positive, and P is taken to be the input source, while E, R and G are the loss terms. H96 designed a water balance model; that is, E is calculated (adjusted Thornthwaite) via observed T, and R (surface and base runoff separately) and G are parameterized, such that we have 5 tunable parameters in the expressions for R and G. P is as observed. The depth of 1.6 meter came about as follows. Tuning the model (see H96) to runoff of several small river basins in eastern Oklahoma resulted in a maximum holding capacity of 760 mm of water. Along with a common porosity of 0.47 this implies a soil column of 1.6 meter. This depth seems reasonable for our goals since evaporation of moisture from deeper levels must be small [42].
The soil moisture dataset is provided through the NCAR website for a period during 1951-2005 in a monthly series (55 years = 660 months) over an area from 40˚ to 65˚ longitude and 25˚ to 40˚ latitude. This global dataset has a high spatial resolution in geo-points of 0.5˚ × 0.5˚ that cover the study area as a network (surface) with 1500 grid-points with a dimension of 30 gridpoints (15 degrees of latitude) to 50 grid-points (25 degrees of longitude).
3.3. Temperature
The temperature anomaly dataset is provided from NOAA NCEP CPC CAMS: Climate Anomaly Monitoring System monthly gridded and station precipitation and temperature data. Spatial resolution of data is 2˚ × 2˚; longitude and latitude are global; Time from Jan 1950 to present in monthly series. We used the dataset over an area from 40˚ to 65˚ longitude and 25˚ to 40˚ latitude. The details of data-production are presented in Appendix 1.
3.4. Precipitation
The “CAMS_OPI” (Climate Anomaly Monitoring System (“CAMS”) and OLR Precipitation Index (“OPI”) is a precipitation estimation technique which produces realtime monthly analyses of global precipitation. To do this, observations from raingauges (“CAMS” data) are merged with precipitation estimates from a satellite algorithm (“OPI”). The analyses are on a 2.5 × 2.5 degree latitude/ longitude grid, are updated each month, and extend back to 1979. This data set is intended primarily for real-time monitoring. For research purposes, we refer users to the GPCP and CMAP products which are more quality-controlled and use both IR and microwave-based satellite estimates of precipitation.
The CAMS_OPI data files contain, for each month:
• raingauge/satellite merged analysis
• gauge-only precipitation analyses
• the number of gauge reports in each gridbox
• OPI-only precipitation estimates
• gauge/satellite merged analysis anomalies (1979-1995 base period)
• anomalies expressed as a percentage of the Gamma distribution The merging technique is very similar to that described in Xie and Arkin (1997), and the CAMS_OPI technique has also been published recently [43]. Briefly, the merging methodology is a two-step process. First, the random error is reduced by linearly combining the satellite estimates using the maximum likelihood method, in which case the linear combination coefficients are inversely propostional to the square of the local random error of the individual data sources. Over global land areas the random error is defined for each time period and grid location by comparing the data source with the raingauge analysis over the surrounding area. Over oceans, the random error is defined by comparing the data sources with the raingauge observations over the Pacific atolls. Bias is reduced when the data sources are blended in the second step using the blending technique of Reynolds, 1988 [44]. Here the data output from Step 1 is used to define the “shape” of the precipitation field and the rain gauge data are used to constrain the amplitude.
3.5. ENSO Values
The ENSO values in monthly series have been provided from climate prediction centre website (www.cpc.ncep. noaa.gov) for the period of 1950-2005. Warm and cold episodes based on a threshold of +/− = 0.5C for the Oceanic Niño Index (ONI) [3 month running mean of ERSST.v3b SST anomalies in the Niño 3.4 region (5oN- 5oS, 120o-170oW)], based on centered 30-year base periods updated every 5 years. For historical purposes cold and warm episodes are defined when the threshold is met for a minimum of 5 consecutive over-lapping seasons.
4. Methodology
In order to analyze the aforementioned datasets (PDSI, precipitation, soil moisture and temperature) and also to process the spatial-temporal patterns, the Scilab software (http://www.inria.org) was used in the statistical analysis. The applied techniques are based on the statistical methods for analyzing the spatial and temporal variability of the drought events. All the statistical methods have been applied through the codes, which were added to the Scilab software for data processing. The Scilab-codes are written by V. Moron in CEREGE (Centre Européen de Recherche et d’Enseignement des Géosciences de l’Environnement).
For beginning, after the opening of the datasets through a matrix definition in Scilab the missing values (−99999) in all datasets (PDSI, precipitation, soil moisture and temperature datasets) have been removed before the practical analyses.
Practically, the analysis has begun through the yearly and monthly data series in order to develop the general spatial-temporal patterns of the original values of the PDSI dataset during the period of 1951-2005. This overview allows us to consider in general the variations of drought severity over the period. And, to find a climatic teleconnection linkage with droughts in Iran the ENSO phases (cold and warm episodes of El Niño/La NiñaSouthern Oscillation) as the episodes of large-scale climate variability have been considered.
In order to characterize the spatial-temporal variations of droughts, we have applied a statistical method using the Principal Component Analysis (PCA) (traditionally known as Empirical Orthogonal Functions (EOFs) in studies of the atmospheric sciences). PCA and the closely related principal factor analysis (PFA) of multivariate techniques have been widely used in meteorology and climatology [45,46]. The PCA is a standard tool in modern data analysis—in diverse fields from neuroscience to computer graphics—because it is a simple, non-parametric method for extracting relevant information from confusing data sets. With minimal effort PCA provides a roadmap for how to reduce a complex data set to a lower dimension to reveal the sometimes hidden, simplified structures that often underlie it [47]. In this research the PCA has been used for explaining the temporal variation of the PDSI values and its geographical distribution patterns.
In addition to the PCA, another performed analysis was the calculation of correlation functions for the PDSI data series in: 1) an inter-annual mode (between all months of year) and 2) a yearly correlation in two forms of 2 and 3 consecutive overlapping years. Correlation is a statistical technique that can show whether and how strongly pairs of variables are related. Here through correlation technique we measured the PDSI-resulted drought variability over the mentioned time scales.
Then, the precipitation, soil moisture and temperature datasets were processed through the common statistical approaches, such as correlation, anomaly and regression analyses to determine their consistency with the PDSI behavior over the monthly and yearly time scales. Anomaly analysis in the mentioned data sets allowed us to detect the changes of time-series, and then we compared the detected changes. Also through the regression analysis we tried to ascertain the causal effect of the variables upon the PDSI.
5. Results
5.1. Drought Monitoring during Study Period (1951-2005)
5.1.1. Temporal and Spatial Patterns of the PDSI
Regarding the temporal pattern of the PDSI for 55 years (1951-2005) that is in evidence there are some considerable departures on the PDSI monthly values. The average, maximum and minimum values in this long term temporal pattern of the PDSI dataset are respectively of the order: −0.72, 4.78, and −7.66, and the most extreme drought spell lasted 4 years from 1999-2002. On the other hand the most considerable wet spell was in 1954- 1957. Generally, in respect of the onset and end points of the PDSI values in this pattern, it is evident the drought severity is increasing, as the PDSI values have a tendency towards the negative over the study period (Figure 2). At the same time, this plot reveals four spells respecttively 1951-1960 (average of PDSI: 0.46) as a wet spell, and 1978-1988 (average of PDSI: −0.43) that is considered a weak drought spell, while on the other hand 1960- 1978 (average of PDSI: −0.6) as well as 1988-2005 (average of PDSI: −1.93) are considered two weak and mild drought spells. Also, as is evident, most of the study months during the period 1950-2005 demonstrate the negative PDSI ranks (droughts), so that about 67% of the study months have negative signals in contrast to the 33% of positive signals or wet months.
This PDSI plot clearly indicates a non-linear trend on the period 1951-1999, whereas a very different behavior seems to have taken place in the 1999-2005.
Also, for comparing the temporal PDSI variations with large-scale climate variability, the ENSO phases (cold and warm episodes of El Niño/La Niña-Southern Oscillation) have been considered during 1950-2005. Regarding the monthly variations of ENSO phases, some drought and wet spells of PDSI in Iran seem to correspond to the ENSO variations (Figure 3). For example, the cold episode of ENSO (La Nina) in 1999-2002 links to the extreme drought spell found via PDSI in Iran. Although the other drought and wet spells of PDSI respectively correspond with the La Nina and El Nino phases, we cannot ignore the time delay between their fluctuations and durations, which may be resulted from: 1) the nature of PDSI as a complicated drought severity index, and 2) the severity and duration of the droughts over the study area are related to a combination of the prolonged duration of the La Niña and the unusually warm SSTs in
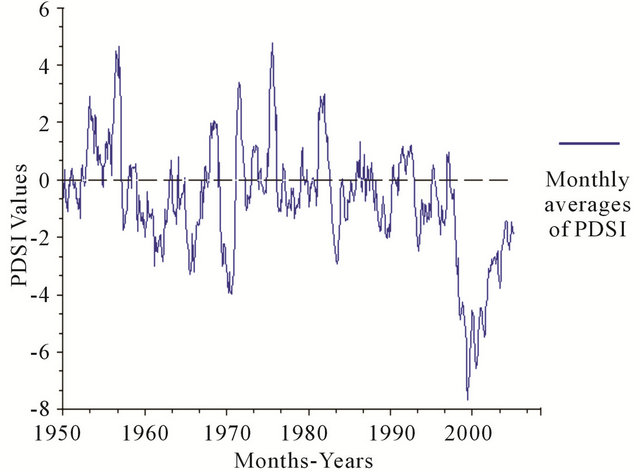
Figure 2. Temporal average of the PDSI mean values based on the monthly series during the study period (1951-2005).

Figure 3. ENSO phases (cold and warm episodes of ENSO) based on 3 months running average during 1950-2005 (data source: climate prediction centre).
the west Pacific, which may enhance the regional dynamics of the warm pool [4], and so only the La Nina does not cause the long-term droughts in our study area.
The subset of ENSOs with a strong warm pool signal are associated with a vigorous extension of positive precipitation anomalies into the Indian ocean and negative anomalies over central and south-west of Asia, wherein Iran is placed. The similarity between this rainfall pattern and the drought period rainfall is striking [4].
The spatial pattern of the PDSI for 55 years (1951- 2005) like the temporal one has been developed through the average values of the index.
Based on this spatial pattern (Figure 4) it is clear that the spatial variability of drought in Iran generally reveals the existence of three regions countrywide with respect to the intensity of drought: Northern Iran (north western and north eastern parts) which exhibits a high frequency of drought events with more intensity, Central Iran which experiences moderate drought conditions and southern Iran which has a low frequency of droughts.
Thus, during the study period (1951-2005) the northern parts of the country should reveal the precipitation deficit and positive signal of the temperature anomaly relatively more than the other areas. This condition apparently has been caused by global surface warming as a complementary cause to the precipitation deficit particularly after 1980, in certain global regions such as the Middle East [48].
Extreme drought period of 1999-2002; PDSI mean values during this period reveal an extreme condition of drought in both intensity and duration compared with the other drought spells found during 55 years of the study period. Socio-economic and environmental sections were seriously damaged due to this rainfall deficit, and obviously Iran was hit by the most intense drought event in the 3 year period 1999-2002.
For the determination of this intensive drought spell the yearly PDSI value of −4 is considered a threshold
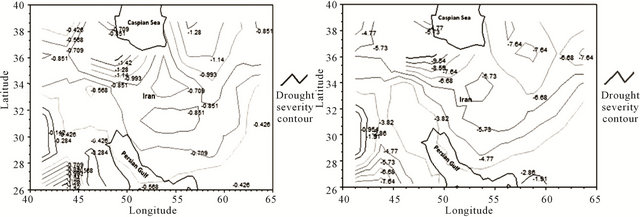 (a) (b)
Figure 4. Spatial patterns of the PDSI during 1951-2005 (a) and 1999-2002 (b) in Iran.
point in this classification (extreme drought). Regarding the role of large-scale climatic variabilities in the periodic changes of precipitation and temperature regimes over the global regions, from 1988 to 2005 Iran was hit by progressive dry climatic conditions, which reached its peak in 1999-2002. This drought spell apparently corresponds to La Nino phase (cold episode of ENSO). The similarity between the enhanced warm pool-La Nina composite and the climate anomalies of 1998-2002, suggests that the prolonged, westward-concentrated La-Nina during this spell was one of the important factors in the central and southwest Asia drought [4]. Spatial variability of the drought intensity over this spell in the country (Figure 4) also shows that the northwestern and the northeastern regions respectively display the most intensive drought event with a severity around −8. So the severe drought conditions particularly on the northwestern regions would confirm the existence of a high correlation between ENSO teleconnection and the precipitation variations over the northwest of Iran especially in the cold season [49,50].
5.1.2. Monthly Patterns of PDSI
Following the processing of the index for the entire study period that has released the average values of the PDSI through spatial-temporal patterns, a monthly based spatial-temporal processing for the PDSI original dataset has been taken into consideration in order to explain the drought intensity variation over the months of year. In order to identify the monthly difference of the drought intensity in the course of 1951-2005, the mean values of the PDSI for each month is calculated (Figure 5). All months demonstrate negative values, although the months of the cold seasons release relatively low negative mean values (weak drought) and on the contrary the warm seasons include higher negative mean values (strong drought). So here we can see the temperature’s effect on increasing
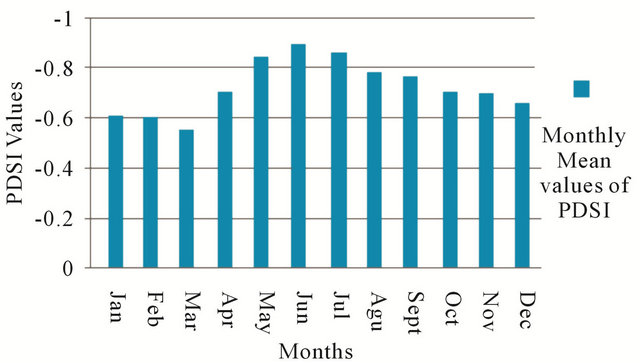
Figure 5. The average values of the PDSI for 12 months of year during 1951-2005.
drought intensity in the warm season, due to the raising of evaporation. The lowest average value of PDSI is in March (−0.55) and the highest in Jun (−0.89).
The geographical distribution of the PDSI values for each of the 12 months over Iran clearly shows 3 regions with intensive and frequent drought events in the Northern Regions, moderate droughts in the central Iran and weak droughts in the South (in particular the South-east). In fact drought intensity gradually decreases from the north of the country toward the central and southern parts. The monthly developed maps exhibit that the intensity contour of −1 covers some regions in central Iran from May to Oct (warm season), whereas this intensity contour mainly during the cold months of year is limited to the northwest and northeast (Figure 6). Thus regarding the spatial pattern of drought intensity over the country, it seems that the precipitation is negatively correlated with ENSO teleconnections (by La-Nina phase) over the northern parts of the country [51]. Furthermore, the western climatic systems produced especially by North Atlantic Oscillation may play an important role in precipitation variability (here rainfall deficit) over northwestern, western and northern Iran [52].
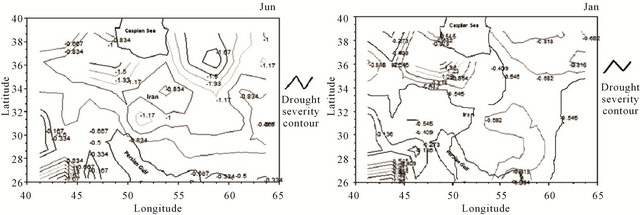
Figure 6. Examples of the spatial monthly patterns of the PDSI during 55 years for Jun (left) and Jan (right), the produced maps for each of the months of year (12 months) are available at Annex.
5.2. Principal Component Analysis (PCA)
In order to find out the independent axes or variances in the PDSI original dataset, the PCA for each of the months has been computed. The explained variances derived from this analysis results 57 independent variances. We have used only two initial variances in our analysis, since from the third variance up the rates found are below 10%. In fact the first two PCs will explain the large patterns of the PDSI, whiles the rest of the PCs are mostly related to the small or local patterns. Through this part of the work, the first (PC1) and second (PC2) modes explain respectively in average the variance rates of about 46.39% (PC1) and 11.45% (PC2) in the PDSI dataset. Thus, the correlation maps for each month have been developed based on these two variance rates which include the majority of variance percentages calculated. Also the cumulative variance of these two rates explains the values above 55% for all months (Table 1).
Regarding the geographical description of the correlation calculated through this analysis between temporal variations of the PDSI and its original data via the PC1 (first mode) in the course of 55 years, there is evidently a remarkable coherence in the most areas of the country over all months of the year. In fact this spatial pattern of the PCA as the leading mode explains the fact that the drought events during a given year often demonstrate a high spatial correlation over most Iranian regions especially in the central and eastern parts of the country, where it shows the homogenous geographic and meteorological status (desert plains with low rainfall as well as high temperature). But the southeastern regions with low ranks seem to have different climatic characters, for example; monsoon precipitation regime influences usually these regions.
The results derived through PC2 (second mode) as the residual of the first mode explain a dipolar spatial pattern through the geographical distribution of the correlation calculated for each of the months. So it is evident that the southern and northern parts of the country normally demonstrate the high correlation around ±0.5, whereas toward central regions the correlation rates are going decrease continuously towards a belt around 33˚N where the correlation values are about zero.
Thus as mentioned above, based on the leading mode, which is reckoned as a dominant portion from this principal component analysis; the drought events in Iran may follow a coherent spatial pattern (Figure 7). We give more explanations about this drought pattern in the discussion part.
5.3. Monthly and Yearly Correlation Functions in PDSI Values
For this analysis firstly a matrix of 12 × 12 is designed; this matrix reveals the relative correlations between all months of the year. Through this analysis the highest correlation-ranks usually are obtained between each month to itself, on the other hand the lowest one indicates a correlation between two months in cold and warm seasons (for example: 0.6 between Jan & Aug). The monthly correlation analysis confirms that during a given year, drought event may be persistent over the months, as this matrix gives on average a correlation-rank between all months of the year about 0.83 that is a considerably high monthly correlation.
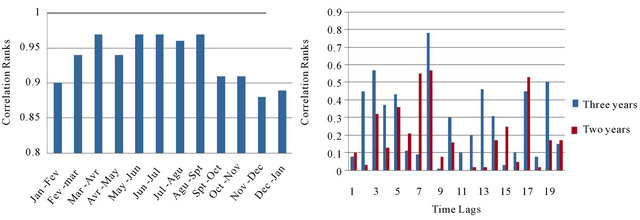
In order to examine the above hypothesis, the moving correlation between each two consecutive months over a year has been computed. As this performance indicates the behavior of the monthly correlations during the seasons of year (Figure 8), the drought events in Iran show a high monthly coherence throughout a year (correlation ranks from 0.88 to 0.97). Also, we have performed a yearly based correlation analysis. So we selected a 20- year period from 1961 to 1981 as a sample period. This yearly based correlation has been performed in two modes:
Table 1. Monthly rates of the explained variances for PC1 & PC2 and their cumulative variance.
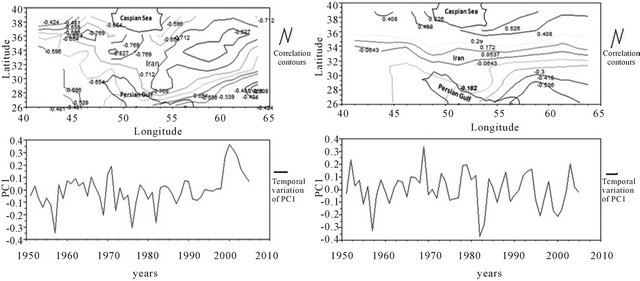
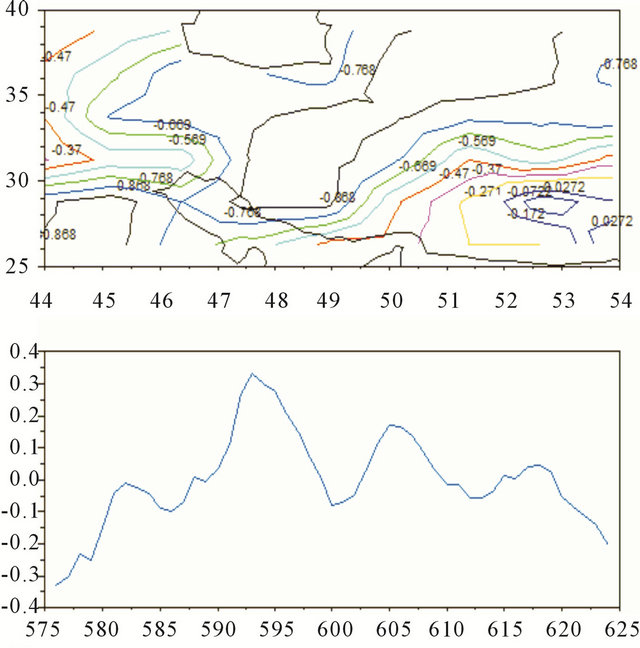
Figure 7. The yearly average of the spatial-temporal PCA processed through the leading mode (a) and second mode (b) during the study period (1951-2005).
 (a) (b)
Figure 8. The correlation functions of the PDSI values through PC1 (leading mode of PCA) between the consecutive months (a) as well as consecutive years in two modes of 3 years and 2 years (b).
the first one for 2 consecutive years and the second one for 3 consecutive years. In fact, the correlation successively between 1 year with the next one (2 year mode), and between 1 year with 2 next years (3 year mode) has been performed through the selected 20 years. Both these two yearly correlation modes confirm that there is a low coherence between yearly variations of drought (PDSI values). So, the resulted correlation-ranks show on average 0.19 for 2-year mode and 0.27 for 3-year mode, we cannot expect to have a yearly or periodic high regulation for drought events in Iran.
5.4. Considering of the Precipitation, Temperature and Soil Moisture Datasets
The precipitation, soil moisture and temperature datasets in monthly series also were provided via the same web site of the PDSI dataset (http://iridl.ldeo.columbia.edu). Through this part of the work the contributions of the mentioned factors as the principal factors of the PDSI have been quantified in the PDSI spatial-temporal variability over the study period (1951-2005).
5.4.1. Correlation and Anomaly Analyses between PDSI with the Soil Moisture, Precipitation and Temperature
The correlation analysis has been preformed through the leading principals of the PDSI and the precipitation, temperature as well as soil moisture during 1951-2005. This three-aspect correlation matrix is designed in the form of the monthly moving average correlation (1, 3, 6 and 12 months moving average). The results basically explain that the PDSI variability is more compatible with the soil moisture variation than with precipitation and temperature variations. Also, we found that the correlation-ranks between both precipitation and temperature with PDSI are gradually growing if we increase the length of the monthly moving average (Table 2). Thus, this analysis indicates that the precipitation and temperature may affect the PDSI variability by a delay of a few months, although the effect of soil moisture in PDSI seems to be mostly direct. Why is this, the PDSI has a fairly long memory, reflecting the memory of soil moisture, so that temperature and precipitation for example in spring or summer can still affect autumn PDSI, thus this relationship between the PDSI and its principal meteoro-
Table 2. Correlation analysis between precipitation (P), temperature (T) and soil moisture with the PDSI through the entire study period (1951-2005).
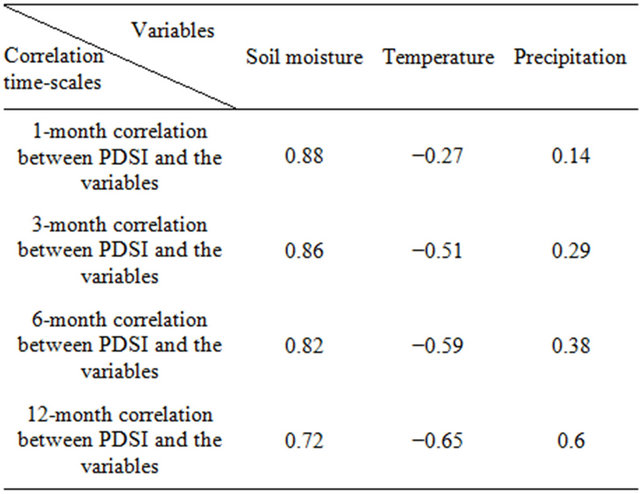
logical factors result in a delay of few months in PDSI’s response to their variations. Furthermore, water holding capacity of soils, and the depth in which available water content has been estimated play an effective role in this temporal lag between the PDSI and its metrological factors.
In addition, an inter-annual analysis in order to find out the correlation variations between PDSI and the three mentioned factors during the months of the year has been performed. With respect to the monthly correlation averages, it is evident that the monthly ranks mostly explain low correlation between the PDSI with temperature and especially with precipitation, although during the warm months PDSI and temperature are relatively more matched. But, the soil moisture and PDSI exhibit the high correlations over all months with the ranks above 0.88 (Figure 9). This performance explains that the PDSI values correlate closely to the soil moisture variability during all seasons of a year.
Also, a monthly anomaly analysis was performed separately for all three variables and PDSI, during a 22 year period (1979-2001). Then, the linear correlation function between the anomaly values of each variable and PDSI has been performed for all 12 months of the year (Figure 10 shows examples of Jul, Nov, Feb, Aug). The highest R2 rank is found in November between the anomaly values of PDSI and soil moisture with a rank of 0.63. Linear monthly correlations of the anomaly values of precipitation and temperature with PDSI are relatively low and irregular over all months of the year. However, the highest R2 ranks for PDSI/precipitation and PDSI/ temperature respectively are found in February (0.47) and in August (0.46).
The monthly linear correlations as well as monthly anomaly analyses on PDSI and its basic factors demonstrate that the variations of PDSI in a year (over the months of a year) would be closely compatible to the soil moisture changes, since, the out puts of PDSI are as the
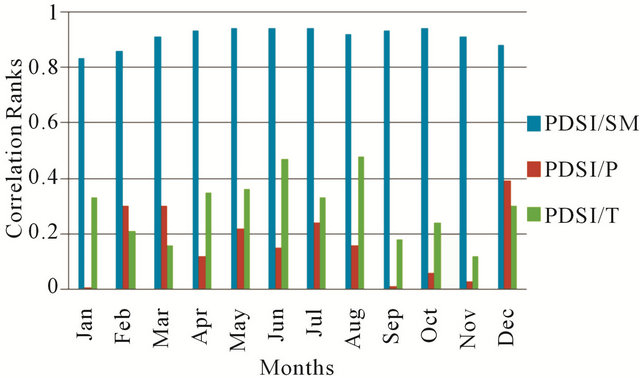
Figure 9. Three-aspect monthly correlation analysis between soil moisture (SM), precipitation (P), temperature (T) with the PDSI for each of the months of year during the study period (1951-2005).
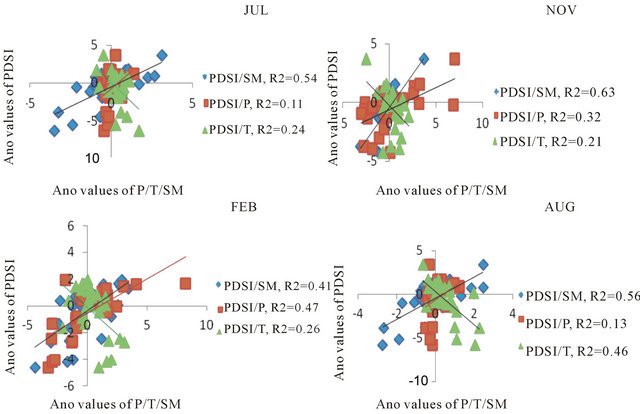
Figure 10. Monthly anomaly analysis for PDSI, soil moisture, precipitation and temperature. And the linear correlation between the monthly anomalies of PDSI and the anomalies of three mentioned variables for each of the 12 months of the year. Examples of Nov., Jul., Feb. and Aug.
soil moisture model.
5.4.2. Regression Analysis for the PDSI via Soil Moisture, Precipitation and Temperature
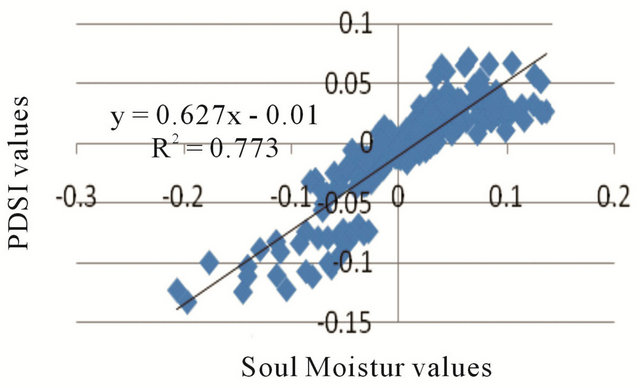
This regression analysis has considered separately the relations between the PDSI with the soil moisture, precipitation and temperature. So, regarding the coefficients of determination (r2) which are derived through this analysis between the PDSI values and the predictive values of PDSI by the mentioned factors, it is evident that the estimated r2 by the soil moisture (0.77) is more reliable than that of the precipitation (0.037) and temperature (0.15). In fact via prediction of soil moisture values, it seems to be more reliable to estimate PDSI (Figure 11), although the derived statistical significances between all variables and PDSI are around zero.
Also, this analysis indicates that there is no linear correlation (or very weak linear correlation) between PDSI with precipitation and temperature, in spite of what is found for PDSI and soil moisture (strong linear correlation). As mentioned already, PDSI is not regularly and directly compatible to the monthly variations of precipitation and temperature.
6. Discussion
The long term and monthly spatial-temporal patterns of the PDSI original dataset through the entire study period (1951-2005) indicate the drought severity during the mentioned study period has been going on increasingly throughout Iran, and in particular over the northwest and northeast regions. The peak of this increasing severity was found over the period of 1999-2002 as the worst drought period, which is linked to the La Nina phase (cold episode of ENSO). We found, the PDSI is good responsive to the long-term droughts, which may be resulted from the prolonged duration of the La Nina phase in addition to the unusually warm SSTs in the west Pacific.
Regarding the performed analyses (correlation functions and PCA), the PDSI monthly values seem to follow a dominant and persistent pattern in the Iranian regions over the months of a drought year. The derived results through the leading mode of principal component analysis indicate the high ranks over the most parts of the study area, in particular on central and eastern areas with a high spatial coherence, although the south-eastern part where receives the monsoon precipitation shows the weak ranks, and then has been isolated (Appendix 2). This spatio-temporal pattern of the PDSI’s variations may confirm the influence of a dominant climatic index, such as the enhanced warm pool-la Nina composite, to cause drought conditions over the Iranian regions. Spatial high coherence in the PDSI’s variations over some parts of the study area not only depends on a given climatic index, but also homogenous topography and soil type play a significant role. As we found; the PDSI is very responsive in the central and eastern desert plains of the country, where are characterized with the dry climate as
 (a)
(a)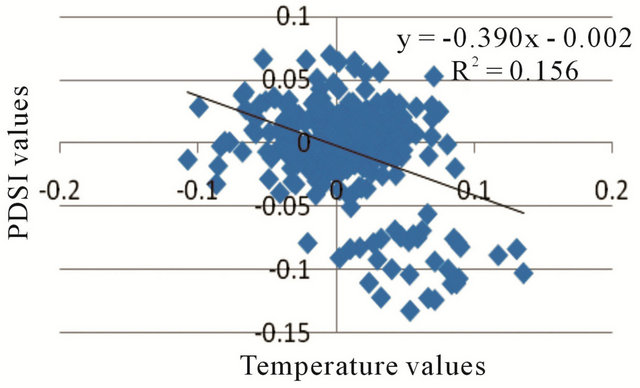 (b)
(b) (c)
(c)
Figure 11. Regression analysis on PDSI monthly values based on soil moisture (a), temperature (b) and precipitation (c).
well as the flat lands.
At the same time, the PDSI relationships with its principal factors are very complicated. Although PDSI is closely correlated to the monthly variations of the soil moisture, this is not the case with precipitation and temperature. However, temperature would raise the potential evapotranspiration, which results high intensity of droughts, so the correlation between PDSI and temperature becomes relatively strong in the warm months of the year. Basically, the detected incompatibility between the PDSI and precipitation as well as temperature, seems to result from the fact that, the PDSI is a hydro-climatic index, so its values naturally are too complicated. As, four hydrologic models of potential recharge (PR), potential evapotrasipiration (PE), potential loss (PL) and potential runoff (PR), have been taken into account in the PDSI model. Long memory of the PDSI holds the effect of temperature and precipitation from few months ago. Also, one of the important factors in PDSI calculation is AWC (available water content), which is strongly related to the soil types, topography and the depth in which the AWC has been estimated. Incidentally, for calculation of PDSI for a certain month, it’s necessary to use the result of preceding month in the formula. Thus, regarding the explanations above, precipitation and temperature variations may correlate to the PDSI variations with a delay around several months.
7. Acknowledgements
We are grateful to the ASMERC (Atmospheric Sciences and Meteorological Research Centre) for the funding of this project. Also we deeply appreciate Mr. Gerard Serviant and Mme. Sue Serviant for revising the Englishtext.
REFERENCES
- C. Bhuiyan, et al., “Monitoring Drought Dynamics in the Aravalli Region (India) Using Different Indices Based on Ground and Remote Sensing Data,” International Journal of Applied Earth Observation and Geoinformation, Vol. 8, No. 4, 2006, pp. 289-302. doi:10.1016/j.jag.2006.03.002
- K. Yurekli, A. Kurunc and O. Cevik, “Simulation of Drought Periods Using Stochastic Models,” Turkish Journal of Engineering and Environmental Sciences, Vol. 28, No. 3, 2004, pp. 181-190.
- D. A. Wilhite, “Drought as a Natural Hazard: Concepts and Definitions,” In: A. Donald and A. Wilhite, Eds., Drought: A Global Assessment, Routledge, New York, 2000, pp. 3- 18.
- B. Mathew, H. Cullen and B. Lyon, “Drought in Central and Southwest Asia: La Niña, the Warm Pool, and Indian Ocean Precipitation,” Journal of Climate, Vol. 15, No. B4, 2002, pp. 697-700. doi:10.1175/1520-0442(2002)015<0697:DICASA>2.0.CO;2
- M. J. Nazemosadat, N. Samani, D. A. Barry and N. M. Molaii, “Enso Forcing on Climate Change in IRAN: Precipitation Analysis,” Iranian Journal of Science & Technology, Transaction B, Engineering, Vol. 30, No. B4, 2006, pp. 47-61.
- S. Morid and V. Smakhtin, “Comparison of Seven Meteorological Indices for Drought Monitoring in Iran,” International Journal of Climatology, Vol. 26, No. 7, 2006, pp. 971-985. doi:10.1002/joc.1264
- S. Lonergan, “Climate Warming, Water Resources and Geopolitical Conflict: A Study of Nations Dependent on the Nile, Litani and Jordan River Sysems,” Defence Research and Development Canada, 1991.
- A. Alizadeh and A. Keshavarz, “Status of Agricultural Water Use in Iran, Water Conservation, Reuse and Recycling,” The National Academies Press, Paris, 2005.
- C. Agnew, “Spatial Aspects of Drought in the Sahel,” Journal of Arid Environment, Vol. 18, No. 2, 1990, pp. 279-293.
- C. Agnew and A. Warren, “A Framework for Tackling Drought and Land Degradation,” Journal of Arid Environment, Vol. 33, No. 3, 1996, pp. 309-320. doi:10.1006/jare.1996.0067
- H. N. Le Houerou, “Climate Change, Drought and Desertification,” Journal of Arid Environment, Vol. 34, No. 2, 1996, pp. 133-185. doi:10.1006/jare.1996.0099
- W. C. Palmer, “Meteorological Drought,” Research Paper No. 45. US Department of Commerce Weather Bureau, Washington DC, 1965.
- V. U. Smakhtin and D. A. Hughes, “Automated Estimation and Analyses of Meteorological Characteristics from Monthly Rainfall Data,” Environmental Model Software, Vol. 22, No. 6, 2007, pp. 880-890. doi:10.1016/j.envsoft.2006.05.013
- R. R. Heim, “Drought Indices. A Review In: Drought A Global Assessment, Hazards Disaster Series,” Routledge, New York, 2000.
- R. R. Heim, “A Review of Twentieth-Century Drought Indices Used in the United States,” Bulletin of the American Meteorological Society, Vol. 84, No. 6, 2002, pp. 1149-1165.
- J. A. Keyantash and J. A. Dracup, “An Aggregate Drought Index: Assessing Drought Severity Based on Fluctuations in the Hydrologic Cycle and Surface Water Storage,” Water Resources Research, Vol. 40, No. 9, 2004. doi:10.1029/2003WR002610
- M. J. Hayes, C. Alvord and J. Lowrey, “Drought Indices,” International West Climate Summary, Vol. 3, No. 6, 2007, pp. 2-6.
- Vicente-Serrano, M. Sergio, S. Beguería and J. I. LópezMoreno, “A Multiscalar Drought Index Sensitive to Global Warming: The Standardized Precipitation Evapotranspiration Index,” Journal of Climate, Vol. 23, No. 7, 2010, pp. 1696-1718. doi:10.1175/2009JCLI2909.1
- A. G. Dai, “Characteristics and Trends in Various Forms of the Palmer Drought Severity Index during 1900-2008,” Journal of Geophysical Research, Vol. 116, No. D12, 2011, p. D12. doi:10.1029/2010JD015541
- W. C. Palmer, “Keeping Track of Crop Moisture Conditions, Nationwide: The New Crop Moisture Index,” Weatherwise, Vol. 21, No. 4, 1968, pp. 156-161. doi:10.1080/00431672.1968.9932814
- I. Petrasovits, “General Review on Drought Strategies,” Transactions of the 14th Congress on Irrigation and Drainage, Rio de Janeiro, Vol. 1-C, Internationa Commission on Irrigation and Drainage (ICID), 1990, pp 1-12.
- B. A. Shafer and L. E. Dezman, “Development of a Surface Water Supply Index (SWSI) to Assess the Severity of Drought Conditions in Snowpack Runoff Areas,” Proceedings of the Western Snow Conference, Colorado State University, Fort Collins, 1982, pp. 164-175.
- F. N. Kogan, “Remote Sensing of Weather Impacts on Vegetation in Non-Homogeneous Areas,” International Journal of Remote Sensensing, Vol. 11, No. 8, 1990, pp. 1405- 1419. doi:10.1080/01431169008955102
- T. B. McKee, N. J. Doesken and J. Kleist, “The Relation of Drought Frequency and Duration to Time Scales,” Proceedings of the 8th Conference on Applied Climatology,” American Meteorological Society, Boston, 1993, pp 179-184.
- W. J. Gibbs and J. V. Maher, “Rainfall Deciles as Drought Indicators,” Bureau of Meteorology Bulletin, Melbourne, 1967. doi:10.1016/S0022-1694(00)00340-1
- V. U. Smakhtin, “Low-Flow Hydrology: A Review,” Journal of Hydrology, Vol. 240, No. 3, 2001, pp. 147-186. doi:10.1002/joc.3370020402
- T. R. Ka and A. J. Koscielny, “Drought in the United States: 1895-1981,” Journal of Climatology, Vol. 2, No. 4, 1982, pp. 313-329.
- T. R. Karl, “Sensitivity of the Palmer Drought Severity Index and Palmer’s Z-index to Their Calibration Coefficients including Potential Evapotranspiration,” Journal of Climate Applied Meteorology, Vol. 25, No. 1, 1986, pp. 77-86.
- P. Domonkos, S. Szalai and J. Zoboki, “Analysis of Drought Severity Using PDSI and SPI Indices,” Idoejaras, Vol. 105, No. 2, 2001, pp. 93-107.
- B. Lloyd-Hughes and M. A. Saunders, “A Drought Climatology for Europe,” International Journal of Climatology, Vol. 22, No. 13, 2002, pp. 1571-1592. doi:10.1002/joc.846
- H. K. Ntale and T. Y. Gan, “Drought Indices and Their Application to East Africa,” International Journal of Climatology, Vol. 23, No. 11, 2003, pp. 1335-1357. doi:10.1002/joc.931
- R. M. N. Dos Santos and A. R. Pereira, “PALMER Drought Severity Index for Western Sao Paulo state, Brazil,” Revista Brasileira de Agrometeorologia, Vol. 7, No. 1, 1999, pp. 139-145.
- J. E. Cole and E. R. Cook, “The Changing Relationship Between ENSO Variability and Moisture Balance in the Continental United States,” Geophysical Research Letters, Vol. 25, No. 24, 1998, pp. 4529-4532. doi:10.1029/1998GL900145
- E. R. Cook, D. M. Meko, D. W. Stahle and M. K. Cleaveland, “Drought Reconstructions for the Continental United States,” Journal of Climate, Vol. 12, No. 4, 1999, pp. 1145-1162. doi:10.1175/1520-0442(1999)012<1145:DRFTCU>2.0.CO;2
- F. K. Fye, D. W. Stahle and E. R. Cook, “Paleoclimatic Analogs to Twentieth-Century Moisture Regimes Across the United States,” Bulletin of the American Meteorological Society, Vol. 84, No. 7, 2003, pp. 901-909. doi:10.1175/BAMS-84-7-901
- A. G. Dai, K. E. Trenberth and T. R. Karl, “Global Variations in Droughts and Wet Spells: 1900-1995,” Geophysical Research Letters, Vol. 25, No. 17, 1998, pp. 3367-3370. doi:10.1029/98GL52511
- P. Rahimzadeh, A. Darvishsefat, A. Khalili and M. Makhdoum, “Using AVHRR-Based Vegetation Indices for Drought Monitoring in the Northwest of Iran,” Journal of Arid Environments, Vol. 72, No. 6, 2008, pp. 1086- 1096. doi:10.1016/j.jaridenv.2007.12.004
- T. Raziei, I. Bordi and L. S. Pereira, “A PrecipitationBased Regionalization for Western Iran and Regional Drought Variability,” Hydrology and Earth System Sciences, Vol. 12, No. 6, 2008, pp. 1309-1321. doi:10.5194/hess-12-1309-2008
- J. T. Shiau and R. Modarres, “Copula-Based Drought Severity-Duration-Frequency Analysis in Iran,” Meteorological Applications, Vol. 16, No. 4, 2009, pp. 481-489. doi:10.1002/met.145
- S. Morid, V. Smakhtin and M. Moghaddasi, “Comparison of Seven Meteorological Indices for Drought Monitoring in Iran,” International Journal of Climatology, Vol. 26, No. 7, 2006, pp. 971-985.
- F. Rahimzadeh, A. Asgari and E. Fattahi, “Variability of Extreme Temperature and Precipitation in Iran during Recent Decades,” International Journal of Climatology, Vol. 29, No. 3, 2008, pp. 329-343.
- H. Van den Dool, J. Huang and Y. Fan, “Performance and Analysis of the Constructed Analogue Method Applied to U.S. Soil Moisture over 1981-2001,” Journal of Geophysical Research, Vol. 108, No. D16, 2003, p. 8617. doi:10.1029/2002JD003114
- E. J. Janowiak and P. P. Xie, “CAMS–OPI: A Global Satellite-Rain Gauge Merged Product for Real-Time Precipitation Monitoring Applications,” Journal of Climate, Vol. 12, No. 11, 1999, pp. 3335-3342. doi:10.1175/1520-0442(1999)012<3335:COAGSR>2.0.CO;2
- R. W. Reynolds, “A Real-Time Global Sea Surface Temperature Analysis,” Journal of Climate, Vol. 1, No. 1, 1988, pp.75-86. doi:10.1175/1520-0442(1988)001<0075:ARTGSS>2.0.CO;2
- R. W. Preisendorfer, “Principal Component Analysis in Meteorology and Oceanography,” Edited by C. D. Mobley, Elsevier, Amsterdam, 1988.
- D. S. Wilks, “Statistical Methods in the Atmospheric Sciences,” Academic Press, California, 1995.
- T. Murat, K. Telat and S. Faize, “Spatiotemporal Variability of Precipitation Total Series over Turkey,” International Journal of Climatology, Vol. 29, No. 8, 2008, pp. 1056-1074. doi:10.1002/joc.1768
- A. Dai, E. K. Trenberth and T. T. Qian, “A Global Dataset of Palmer Drought Severity Index for 1870-2002: Relationship with Soil Moisture and Effects of Surface Warming,” Journal of Hydrometeorology, Vol. 5, No. 6, 2004, pp. 1117-1130. doi:10.1175/JHM-386.1
- A. Soltani and M. Gholipoor, “Teleconnections Between El Nino/Southern Oscillation and Rainfall and Temperature in Iran,” International Journal of Agricultural Research, Vol. 1, No. 6, 2006, pp. 603-608.
- M. J. Nazemossadat, “Winter Drought in Iran: Associations with ENSO,” Drought Network News, Vol. 13, No. 1, 2001, pp. 10-13.
- M. J. Nazemosadat and I. Cordery, “On the Relationships Between ENSO and Autumn Rainfall in Iran,” International Journal of Climatology, Vol. 20, No. 1, 2000, pp. 47-62. doi:10.1002/(SICI)1097-0088(200001)20:1<47::AID-JOC461>3.0.CO;2-P
- S. A. Masoodian, “On Relationship Between Precipitation of Iran and North Atlantic Oscillation,” Geographical Research, Vol. 23, No. 4, 2009, pp. 3-18.
Appendix 1
A station observation based global land monthly mean surface air temperature dataset at 0.5 × 0.5 latitude-longitude resolution for the period from 1948 to the present was developed recently at the Climate Prediction Center, National Centers for Environmental Prediction. This data set is different from some existing surface air temperature data sets in: 1) using a combination of two large individual data sets of station observations collected from the Global Historical Climatology Network version 2 and the Climate Anomaly Monitoring System, so it can be regularly updated in near real time with plenty of stations and 2) some unique interpolation methods, such as the anomaly interpolation approach with spatially-temporally varying temperature lapse-rates derived from the observation based Reanalysis for topographic adjustment. You can find the complete manuscript through: ftp://ftp. cpc.ncep.noaa.gov/wd51yf/GHCN_CAMS/Resource/cpc_globalT.pdf
Appendix 2
The yearly average of the spatial-temporal PCA processed through the leading mode during the worst drought period (1999-2002).
NOTES
*Associate professor and chairman of ASMERC.
#Corresponding author: Ali Didevarasl (Senior expert of ASMERC), ASMERC, Islamic republic of Iran meteorological organization, Tehran, 1497716385, Iran. E-mail: ali_didehvar714@yahoo.com.