Soft Nanoscience Letters
Vol. 2 No. 4 (2012) , Article ID: 23425 , 4 pages DOI:10.4236/snl.2012.24014
The Size Effect of TiO2 Anatase Nanoparticles on Photon Correlation Spectroscopy
![]()
Department of Physics, University of Sistan and Baluchestan, Zahedan, Iran.
Email: *hadavi@phys.usb.ac.ir, *sharifi@phys.usb.ac.ir, *soheil.sharifi@gmail.com
Received August 8th, 2012; revised September 11th, 2012; accepted September 25th, 2012
Keywords: TiO2; Nanoparticle; Light Scattering; Spectroscopy; SEM
ABSTRACT
In this work, the anataze phase of TiO2 nanoparticles was prepared by sol gel method. We changed time and temperature of calcinations to change size and property of nanoparticles. The Transmission Electron Microscopy and Scanning Electron Microscopy were used for characterization of the TiO2 nanoparticles. The nanoparticle size was increased with time and temperature. We found that the average size of samples was changed from 30 to 46 nm with changing temperature from 450˚C to 650˚C and at fixed temperature (450˚C) with changing of calcination times from 1 to 3 hours, the size was changed from 30 to 58 nm. For study the dynamic of nanoparticles, the TiO2 nanoparticles were added to water with 2.4 weights present of particles to the water. The different size of TiO2 nanoparticles was studied with photon correlation spectroscopy. The relaxation time was increased with increasing of nanoparticle size and so diffusion coefficient was decreased.
1. Introduction
TiO2 is a wide band gap semiconductor (3.2 eV) and has many useful applications like photo catalyst activity [1], field effect transistors (as dielectric gate) [2,3], UV detectors (as photo absorber), Dye Synthesized Solar Cells (DSSC) [4], gas sensors [5], electrochromic displays [6] and so on. One of the main applications of Titanium dioxide Nanostructures is photo sensitivity to UV lights in creating of electron and holes for decomposition of much organic and inorganic pollution in waste water and air. Due to relation of optical properties and photo responsively of TiO2 nanoparticles to nanoparticle size, surface area and morphology, optimization of these parameters in order to having efficient response have crucial importance. The photon correlation spectroscopy is a technique for study dynamic of nanoparticles on the solutions [7,8]. Here we will present the results of analyzing the sample morphology which be prepared by Transmission Electron microscopy(TEM), Scanning Electron Microscopy (SEM) and also Photon correlation spectroscopy (PCS) in sol gel derived nanoparticles.
2. Experiments
2.1. Synthesis of Nanoparticles
In this work, the anataze phase of TiO2 nanoparticles was prepared by sol gel method. All the chemical materials Including TiCl4, NH3(OH) (25%), NaOH (97%), HCl, AgNO3 were supplied by Merck company, Germany.
In order to synthesize of the nanoparticles, TiCl4 was used as Ti source. At first step, a 10% aqueous solution of NH3(OH) was added to TiCl4 drop wise. During the process the amount of PH should be controlled carefully. At PH = 5, the sol changes to milky gel and stop the stirring process. By increasing of PH to 7 we should stop adding of NH3(OH). The following chemical reaction is performed during the process.

In this process, NH3Cl is unwanted material and should be subtracted from the gel. To do this, the gel was washed sometimes with distilled water and centrifuged at 500 rpm.
At next stage, the white precipitate powder was dried in room temperature for 30 hours. Finally the powder was grinded and calcinated for 1, 2 and 3 hours at 450, 550 and 600 centigrade degrees in air.
For calcination of the products we used heating furnace model CWF 1200.
2.2. Characterization
Morphology of the nanoparticles was analyzed with TEM and SEM. In this work, Scanning electron spectroscopy was down by Phillips, model XL30 and transmission electron microscope (TEM) images were prepared by Phillips, CM 200. Table 1 show calcination conditions for preparation of different samples.
The powder was grinded and calcinated for 1, Figures 1-4, hours at 450, (Figure 4), 550 (Figure 5), and 650 (Figure 6), centigrade degrees in air.
Figure 1 shows a typical TEM micrograph of the sample 1.
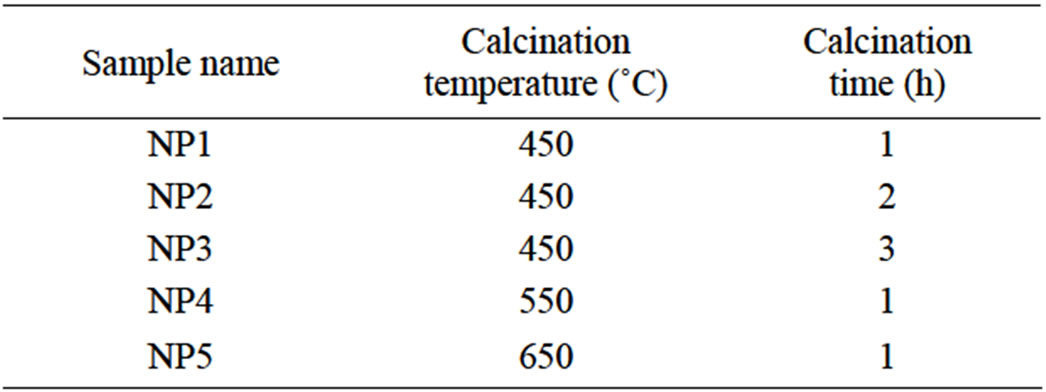
Table 1. Calcinations conditions for prepared nanoparticles.
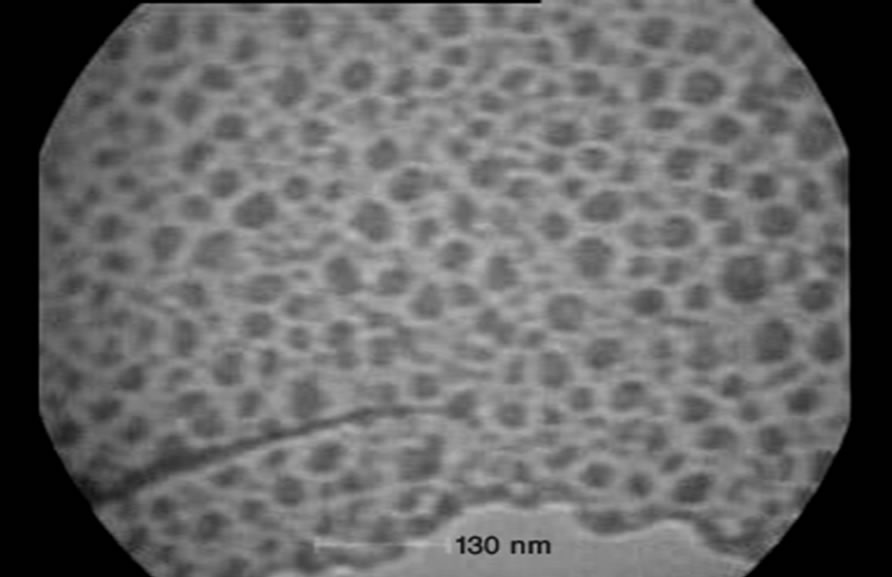
Figure 1. TEM micrograph for NP1.
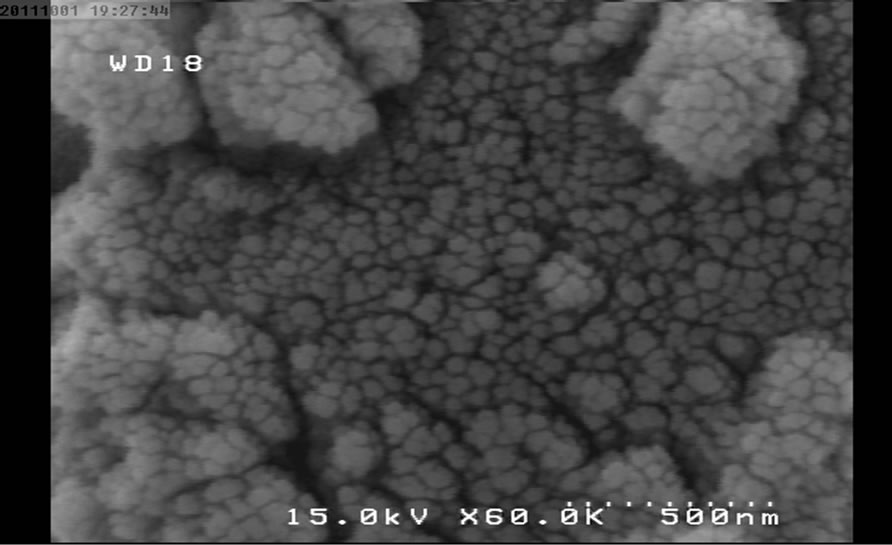
Figure 2. SEM micrograph for NP1.
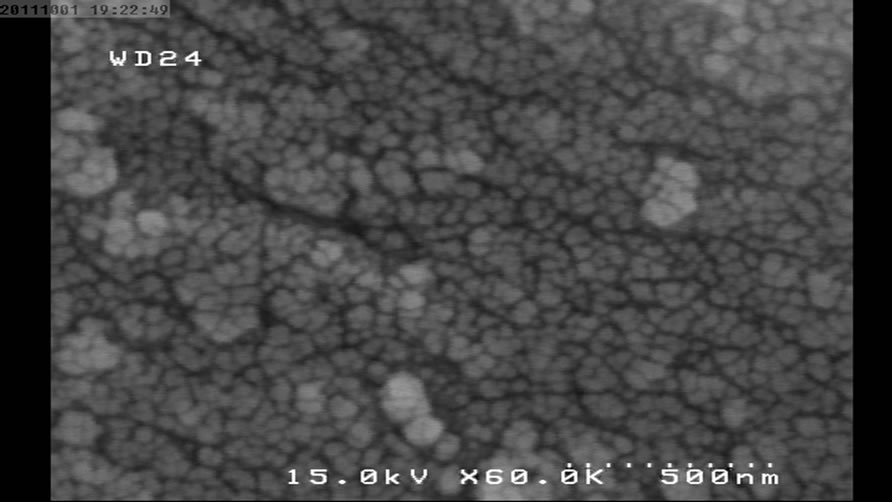
Figure 3. SEM micrograph for NP2.

Figure 4. SEM micrograph for NP3.
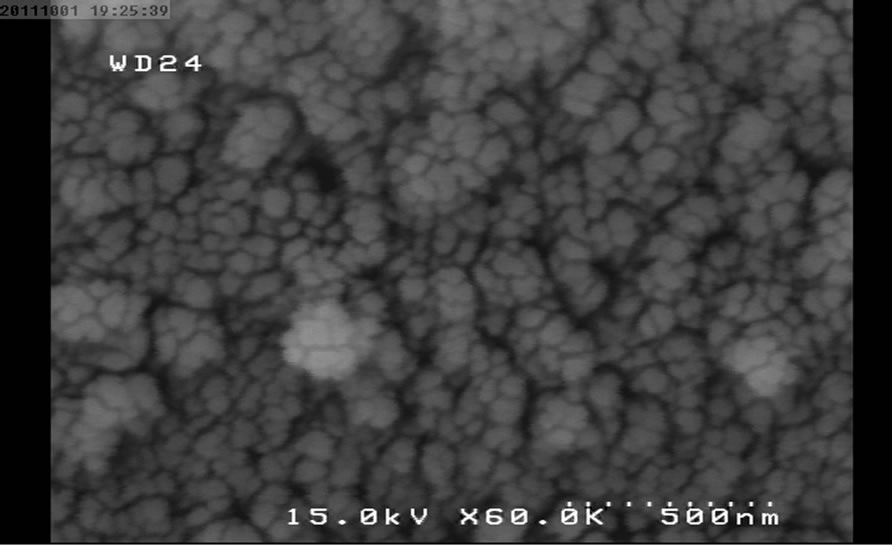
Figure 5. SEM micrograph for NP4.
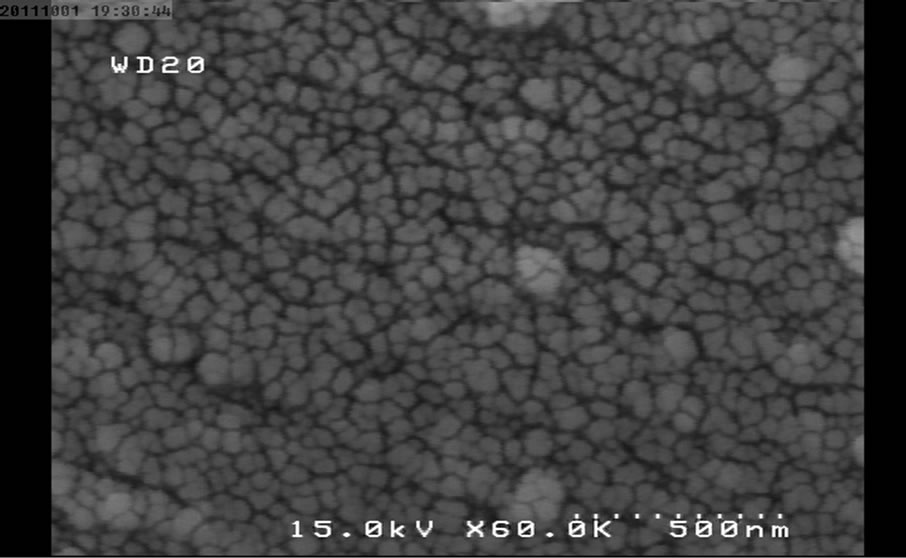
Figure 6. SEM micrograph for NP5.
The TEM micrograph shows the prepared nanoparticles have less than 50 nm size and globular morphology.
The following SEM micrographs show surface morphology of the prepared samples calcinated at different temperatures and times.
The SEM micrographs were revealed the average size of the nanoparticles was increased with temperature and duration of post heat treatment. The average size of samples calcinated at 450˚C, 550˚C and 650˚C are 30, 40 and 46 nm and for the samples calcinated at fixed temperature (450˚C) for 1, 2 and 3 hours are 30, 35 and 58 nm respectively.
2.3. Photon Correlation Spectroscopy
Dynamic light scattering (DLS) or photon correlation spectroscopy measurements were performed using an ALV Single-detector version compact goniometer system, from ALV-GmbH, Langen, Germany. The light source is a He-Ne laser, operating at a wavelength of 632.8 nm with vertically polarized light. The beam was focused on the sample cell through a temperature-controlled cylindrical quartz container, which is filled with a refractive index matching liquid (toluene). We performed the experiment at room temperature with an accuracy of ± 0.2 ˚C. The scattering angle θ = 900, corresponds to a scattering wave vector (q) of 1.87 × 10⁷. The parameter q is determined from
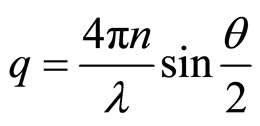 (1)
(1)
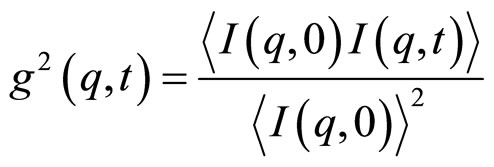
In this formula n is the refractive index of the solvent (n = 1.33), λ is the wavelength of the laser, and θ is the scattering angle. In the DLS experiments, the normalized intensity time autocorrelation function 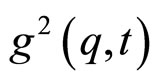 was measured [8,9].
 (2)
(2)
 is the scattered intensity at a given q and time t. The
  function is related to the normalized electrical field correlation function g1(q,t) by the Siegert relation [9] assuming that the system is an ergodic medium [9]
 (3)
(3)
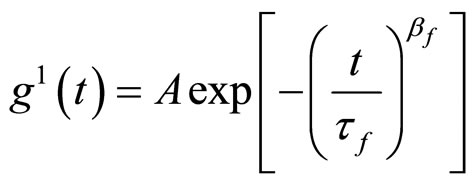
B is the coherence factor of the equipment. All the correlation functions in this work were fitted by stretched exponential functions.
 (4)
(4)
Here A, τf, βf, are amplitude of fast relaxation, fast relaxation time and the stretched exponential exponent of fast respectively. The stretched exponential function describes the decay processes that have a distribution of relaxation times. The parameters βf (between one and zero) measure the width of the distribution function. The mean value of the relaxation time for both modes is given by
 (5)
(5)
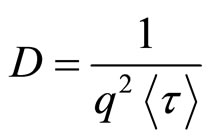
where Γ is the gamma function. The slow and fast diffusion (D) was calculated by equation (6), [10].
 (6)
(6)
In the photon correlation spectroscopy, the normalized
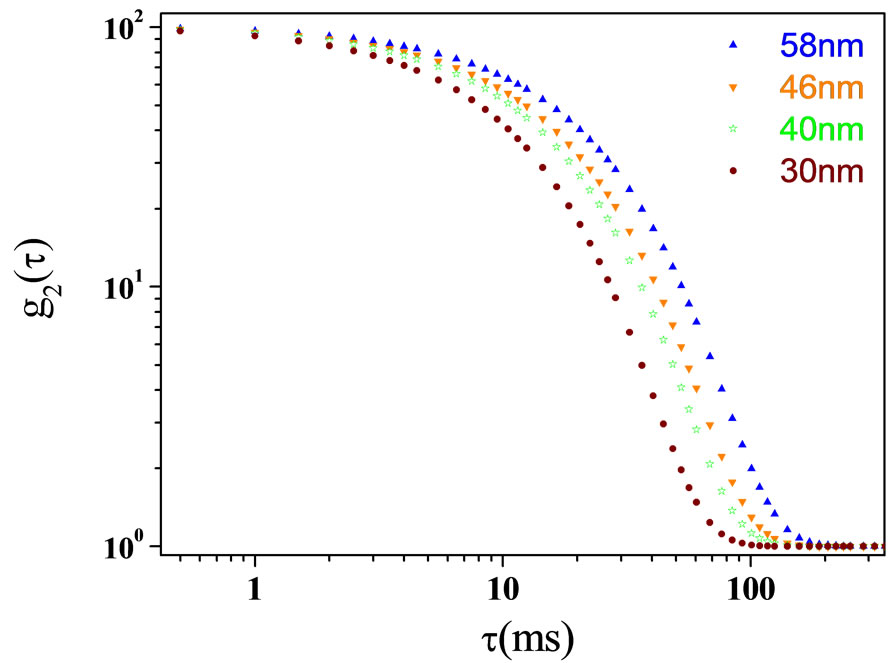
Figure 7. Autocorrelation functions as function of relaxation time for different size of TiO2 with 2.4% nanoparticle at water at room temperature.
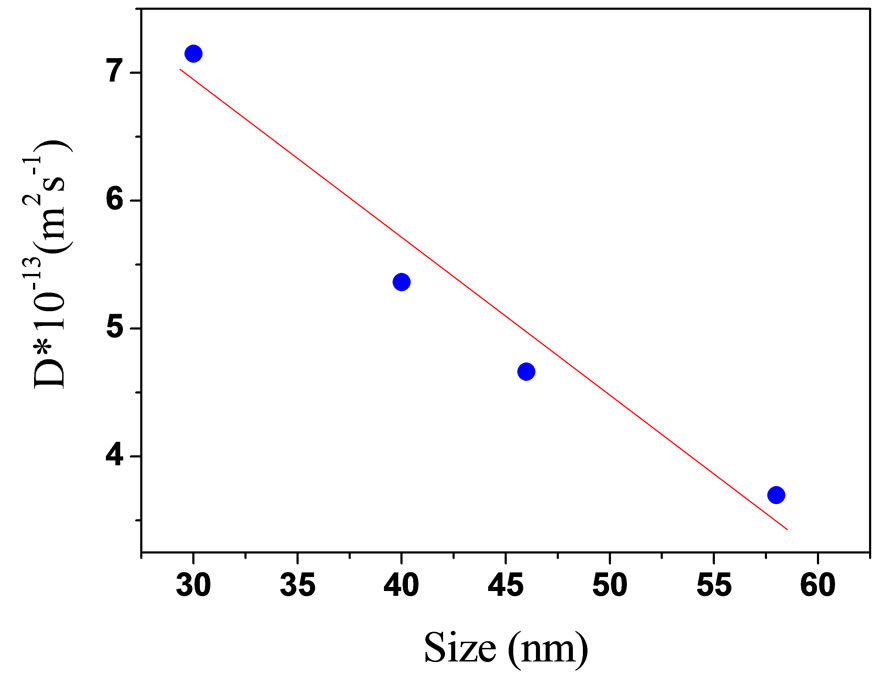
Figure 8. The collective diffusion coefficient as a function of TiO2 with 2.4% nanoparticle at water at room temperature.
intensity time autocorrelation function g2(τ) was measured, Figure 7. The diffusion was calculated with the method that was explained in the references from Equation (6). The diffusion coefficient of light scattering data’s as function of size of TiO2 are presented in the Figure 8. Our results show with increase of size of droplets, the relaxation time was increased. So, the diffusion is decreasing with increase of size.
3. Conclusion
The anataze phase of TiO2 nanoparticles was prepared by sol gel method. The results of TEM and SEM shows, the average size of samples are increased with increasing of calcinations temperature and time. The solution of TiO2 nanoparticles with water at the constant nanoparticels to water (2.4% wt) was prepared for study the dynamics of nanoparticels. The dynamic light scattering was used to study diffusion coefficient of different size of TiO2 nanoparticles. Our results, show with increasing of size of particles, the relaxation time is increased and diffusion coefficient is decreased.
REFERENCES
- J. g. Yu. et al., “Fabrication and Characterization of Ag-TiO2 Multiphase Nanocomposite Thin Films with Enhanced Photocatalytic Activity,” Applied Catalysis B: Environmental, Vol. 60, No. 3-4, 2005, pp. 211-221.
- C. He, et al., “Influence of Silver Doping on the Photocatalytic Activity of Titania Films,” Applied Surface Science, Vol. 200, No. 1-4, 2002, pp. 239-247. doi:10.1016/S0169-4332(02)00927-3
- K. Kim, et al., “DRAM Technology Perspective for Gigabit Era,” IEEE Transactions on Electron Devices, Vol. 45, No. 3, 1998, p. 598.
- A. Kumar, “Growth of Aligned Single-Crystalline Rutile TiO2 Nanowires on Arbitrary Substrates and Their Application in Dye-Sensitized Solar Cells,” The Journal of Physical Chemistry C, Vol. 114, No. 17, 2010, pp. 7787-7792. doi:10.1021/jp100491h
- Z. Li, “Highly Sensitive and Stable Humidity Nanosensors Based on LiCl Doped TiO2 Electrospun Nanofibers,” Journal of the American Chemical Society, Vol. 130, No. 15, 2008, pp. 5036-5037. doi:10.1021/ja800176s
- Y. J. Kim, “Effect of TiO2 Particle Size on the Performance of Viologen-Anchored TiO2 Electrochromic Device,” Journal of Nanoscience and Nanotechnology, Vol. 7, No. 11, 2007, pp. 4106-4110. doi:10.1166/jnn.2007.029
- M. Amirkhani, S. Sharifi and O. Marti “The Effect of Simultaneous Size Reduction and Transient Network Formation on the Dynamics of Microemulsions,” Journal of Physics D: Applied Physics, Vol. 45, No. 6, 2012, Article ID: 365302.
- K. Nikjoo, M. Aliahmad, S. Sharifi and M. Sargazi, “Photon Correlation Spectroscopy and SAXS Study of Cylindrical to Spherical Transition in the AOT Microemulsion by Changing Solvent,” Soft Nanoscience Letters, Vol. 2, No .2, 2012, pp. 17-21. doi:10.4236/snl.2012.22004
- N. Karimi, S. Sharifi and M. Aliahmad “Photon Correlation Spectroscopy and SAXS Study of Mixture of NaCl with AOT Microemulsion at X = 6.7,” Optics and Photonics Journal, Vol. 2, No. 1, 2012, pp. 54-58. doi:10.4236/opj.2012.21008
- S. Sharifi, M. Amirkhani, J. M. Asla, M. R. Mohammadi and O. Marti, “Light Scattering Study of Mixture of Polyethylene Glycol with C12E5 Microemulsion,” Soft Nanoscience Letters, Vol. 2, No. 1, 2012, pp. 76-80.
NOTES
*Corresponding authors.