Journal of Sensor Technology
Vol.4 No.2(2014), Article
ID:46816,15
pages
DOI:10.4236/jst.2014.42008
Flexible Impact Force Sensor
Chen Liu, Yukio Fujimoto, Yoshikazu Tanaka
Department of Transportation and Environmental Engineering, Hiroshima University, Higashi-Hiroshima, Japan
Email: fujimoto@naoe.hiroshima-u.ac.jp
Copyright © 2014 by authors and Scientific Research Publishing Inc.
This work is licensed under the Creative Commons Attribution International License (CC BY).
http://creativecommons.org/licenses/by/4.0/


Received 16 May 2014; revised 3 June 2014; accepted 10 June 2014
ABSTRACT
When human body is punched by boxing glove, both body surface and boxing glove deform in a complex shape. The purpose of this study is to develop a flexible sensor that can be used in such interface. Firstly, several mechanical phenomena, which are the cause of the error signal of the sensor, are discussed. These are the influences of out-of-plane bending deformation, shear force caused by rubbing, shear force caused by the Poisson’s effect of contact material, and the lateral compressive force caused by the overhanging deformation of flexible material. Then, a prototype sensor that can eliminate the error factors of these is developed. The sensor is a distribution type impact sensor in which sixteen sensor elements are arranged in a 4 × 4 matrix. Punching experiments using a boxing glove are carried out by installing the sensor on the load cell, on the concrete wall and on the sandbag. From the experiment, it is found that the impact force can be measured with good accuracy by using the sensor. Despite the fact that the sensor has inadequate distribution number of sensor elements, the sensor structure meets mechanical requirements for the flexible impact sensor.
Keywords:Flexible Sensor, Impact Force, Boxing, Sandbag, Distribution Type Sensor, Human Body

1. Introduction
When a boxer punches the human body, both body surface and boxing glove deform in a complex shape. At present, the accurate measurement of impact force in such interface is said to be difficult. The reason is because the complex deformation and the complex force distribution are induced in the flexible interface and they affect the sensor output. Up to now, many kinds of tactile sensors such as resistance type [1] , piezo-resistance type [2] , capacitance type [3] and light intensity type [4] have been developed. Most of them are assuming to mount the sensor on the robot members. However, it has not been studied much about the influences of the deformation and the associated force distribution at the flexible interface on the accuracy of the sensor output. The reason of this is most of the tactile sensors are intended to use under a small force level and a small deformation level on the installation surface [5] [6] .
By the way, it has been reported that peak impact force of about 4 kN is generated when a strong boxer punches the face of crash test dummy [7] . When the hitting target is sandbag, the interface of glove and sandbag will be deformed more greatly. A suitable sensor which can measure the impact force in such condition is not seen at present. The purpose of this study is to provide a sensor that can measure the impact force accurately at the interface of large deformation and large force.
In this study, firstly, difficulty of force measurement in flexible interface is discussed based on the experiments using a sheet type sensor (Chapter 2). Then, some mechanical factors necessary to achieve the flexible sensor are discussed (Chapter 3). These factors are the out-of-plane bending deformation of sensor, the shear force caused by rubbing on sensor surface, the shear force generated by contact friction, and the transverse compression caused by the overhanging deformation of the flexible material.
In Chapter 4, as a sensor that can overcome the mechanical problems in flexible interface, a flexible sensor of distribution type is developed. In Chapter 5, boxing punching tests are carried out using a prototype sensor by installing the sensor on the sponge rubber sheet which is placed on the load cell or the concrete wall. Further, the punching test is carried out by installing the sensor on a sandbag. In particular, the present study is focused to achieve a sensor structure that is hard to cause trouble under a big impact force like boxing punching.
2. Measurement of Force on Soft Material Surface by Using a Sheet-Type Sensor
2.1. Spherical Surface Pressing on the Flexible Material Surface
As a simple case, spherical pressing experiment of a sensor installed on the flexible material surface was carried out. Figure 1(a) shows a sheet type sensor made from piezoelectric film (PVDF) of which both surfaces are covered by silicon rubber sheets [8] . When compressive force F is applied as shown in Figure 1(b), the rubber sheets shrink in the thickness direction and also be extended in the horizontal direction by the Poisson’s effect. Since the elastic modulus of PVDF is much larger than that of rubber sheet, the PVDF is stretched by the rubber elongation in the horizontal direction. Then, the output signal proportional to the compressive force F is generated in the sensor.
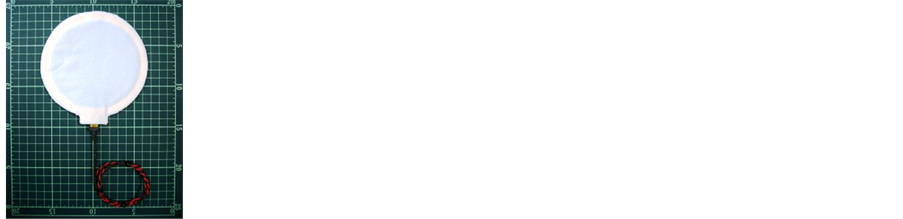
Figure 2(a) shows a sheet type flexible sensor with slit notches around the sensor edge. A single sheet type sensor is not possible to follow the out-of-plane deformation. In order to make out-of-plane deformation possible, one way is to process the slit notches around the sensor edge. The slit notches are expected to get a similar result with “preventing wrinkles of thin paper to wrap an apple”.
Figure 2(b) is the sensor covered by doubly stretch cloth on both surfaces. A polyethylene sheet is sandwiched in between the doubly stretch cloth. When the sensor with slit notches is directly placed on the flexiblematerial and pressed by curved surface object, the output signal of the sensor is influenced by the contact friction between the sensor and the contact object. The stretch cloth and the polyethylene sheet play a role to reduce the influence of contact friction by slide effect.
Figure 3 shows the condition of compression test. Thick acryl plate was fixed on the top of a load cell. Sponge rubber plate with 40 mm thickness was placed on the acryl plate. The sensor was put on it and pressed by spherical body with 50, 100 or 150 mm diameter. The experiment was carried out by changing the compressive force.
Figure 4 compares the relationship between the peak force of the load cell and the sensor output. A good linear relationship is seen in the figure. Despite the change in the diameter of spherical body, the output gradient does not change much. The dashed line in the figure shows the output gradient under the condition that the sensor is placed directly on the flat acryl plate. The sensor detects the normal force on the curved surface, but the load cell detects the vertical component. The difference in gradient of the two straight lines is considered to be related with the detection characteristics.
2.2. Fist Pressing, Palm Pressing and Fist Punching on the Surface of Flexible Material
Next experiment was carried out under the condition that the contact interface deforms in a complex shape. Figure 5 shows the conditions of fist pressing, palm pressing and fist punching. The experiments were conducted by changing the compressive force. Figure 6 shows the relationship between the peak force of the load cell and the peak output of the sensor during compression. A quite large scatter of plots is seen in the figure.
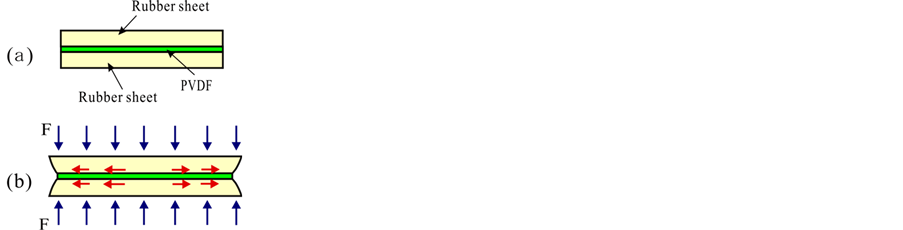
Figure 1. Sensor cross-section and its detection principle of compressive force.
 (a)
(a)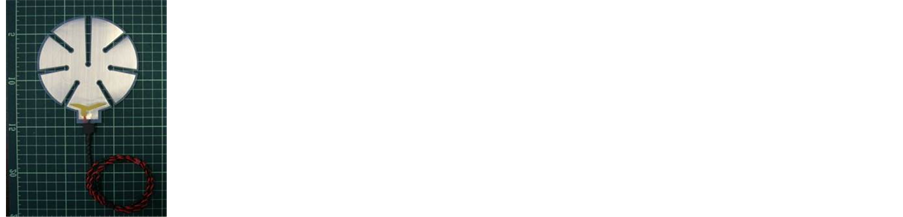 (b)
(b)
Figure 2. Sheet type flexible sensor. (a) Main body of sensor with slits in outer edges; (b) Sensor covered by stretch cloth.
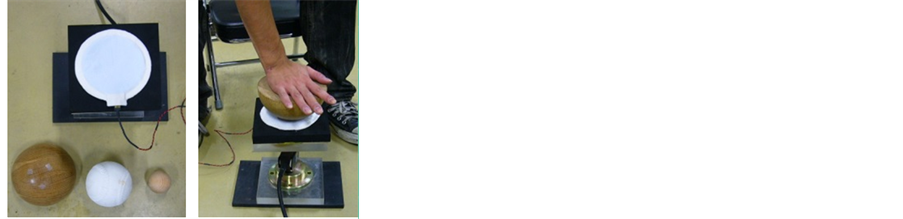
Figure 3. Spherical press of the sensor on the sponge rubber.
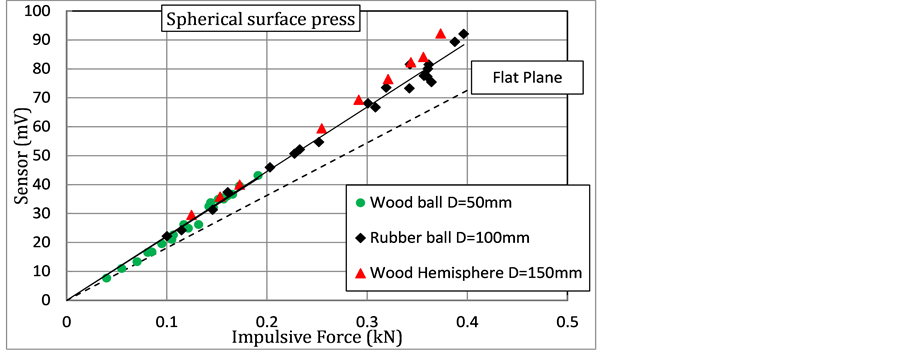
Figure 4. Sensor output vs. load cell output. Dashed line is the output gradient of the sensor on flat plane surface..
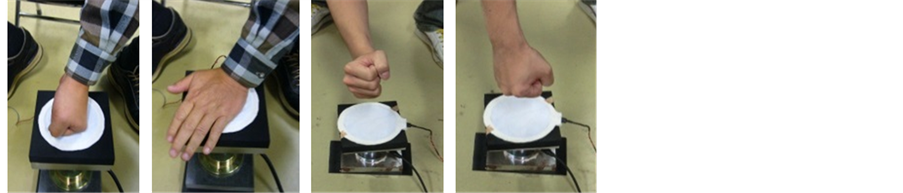
Figure 5. Fist press, palm press and fist punch of the sensor placedon the sponge rubber plate.
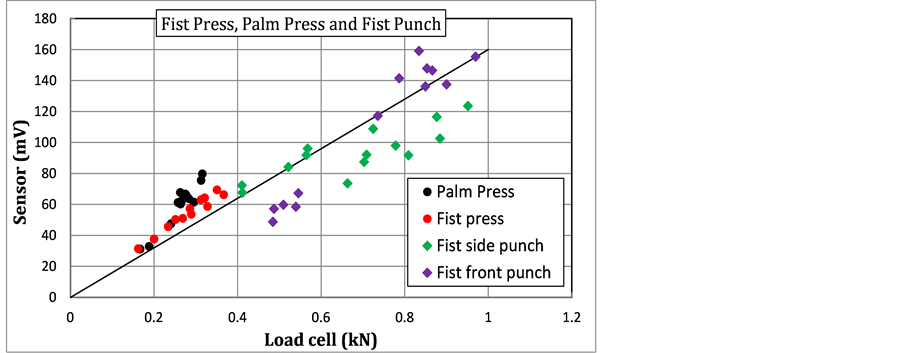
Figure 6. Relationship between the output peak of sensor and the peak force of load cell.
In the experiment of Section 2.1, the loading side was a hard material with simple contact surface and the receiving side was a flexible material. On the other hand, the contact surface of fist or palm is more complex and it changes in every trial. Further, rubbing force and inclined force are also working. The cause of the scatter of the output gradient can be considered as the influences of complex force distribution and the excessive out-of-plane deformation occurring in the sensor. This result means that a single sheet-type sensor is not suitable to achieve the measurement of impact force on the flexible material surface.
Figure 7 classifies the condition of impact force measurement into four levels, in view of the difficulties of measurement. Figure 7(a) is the condition that a hard object with simple contact geometry collides. Figure 7(b) is the condition that a soft object with simple contact geometry collides. In accordance with the deformation of soft object, in this condition, unexpected shear forces (rubbing force and contact friction) work at the interface. Figure 7(c) is the condition that a hard object with complex contact geometry collides. In this case, the outof-plane bending deformation of the sensor and the distributions of shear forces at the interface become more complex. Figure 7(d) is the condition that a soft object with complex contact geometry collides. In this case, stress distribution and deformation becomes most complicated. Boxing punching on sandbag surface is close to the condition of Figure 7(d).
3. Mechanical Issues in Impact Force Measurement on Flexible Material Surface
The objective of this research is to develop a sensor which can be used even when both objects of loading side and load receiving side are soft and the contact geometry is complicated. After repeating several experiments, the authors realized that the discussions about the error signals are necessary for the flexible sensor. They will be described in the following.
3.1. Influence of Out-of-Plane Bending Deformation of the Sensor Element
Figure 8 shows a sensor element used in the flexible sensor. A pair of silicon rubber sheet is adhered on the
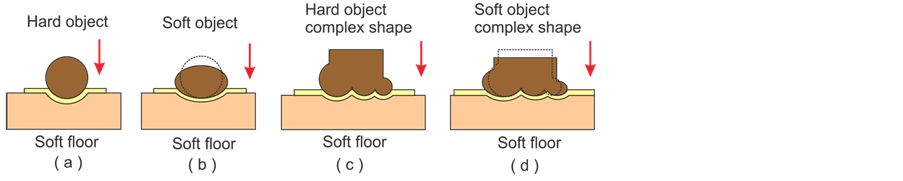
Figure 7. Difficulty of force measurement at flexible interface is classified into four levels depending on the shape of the impact object. (a) Hard object with simple contact geometry; (b) Soft object with simple contact geometry; (c) Hard object with complex contact geometry; (d) Soft object with complex contact geometry.
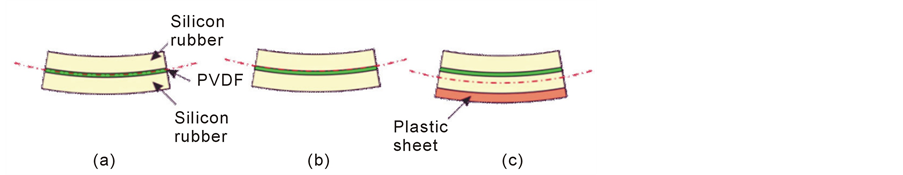
Figure 8. Error signal caused by the out-of-plane bending deformation of sensor element. (b) and (c) represent the shift of the neutral axis by bending deformation.
both surfaces of piezoelectric film (PVDF). The bending neutral axis comes to the center of PVDF thickness, theoretically, due to the vertically symmetric structure. Therefore, the sensor output should not occur almost by bending deformation. However, in practice, by variation in the thickness of the adhesive layer and etc., the neutral axis is shifted slightly from the center of PVDF thickness [9] . Thus result in the occurrence of tensile or compressive strain in PVDF (Figure 8(b)). If a resin sheet like a flexible substrate is adhered on one side surface of the silicon rubber, the bending neutral axis is further shifted, and results in greater strain (Figure 8(c)). It is extremely difficult to control the strain of PVDF caused by bending deformation.
3.2. Influence of Rubbing Force on the Sensor Surface (Shear Force Caused by Rubbing)
Figure 9 shows a schematic view of a sensor element placed on the floor, on which a compressive force F on the left side and a rubbing force S on the right side are acting. The vertical reaction force RF occurs below the F, and the shear force RS against S occurs caused by the friction between floor and sensor element. As the result, tensile strain is produced in the region between the points F and S (shown by red arrow). The rubbing force S sometimes is generated as the horizontal component of inclined force which is applied to the sensor surface.
3.3. Influence of Contact Friction on the Sensor Surface (Shear Force Caused by the Poisson’s Effect)
Figure 10(a) shows a sensor element sandwiched in between the metal plates. Since the elastic modulus of silicon rubber is smaller than those of PVDF and aluminum plate, the silicon rubber deforms into barrel-shape when compressive force F acts.
Figure 10(b) shows a state in which a pair of sponge rubber sheet is sandwiched between the silicon rubber and aluminum plate additionally and applied a compressive force F. Since the elastic modulus of sponge rubber is further smaller than that of silicon rubber, the sponge rubber deforms into bigger barrel-shape. Even if the same F is applied, the silicon rubber is stretched more in this condition. This means that the sensor output is affected by the Young’s modulus of the contact material as well as its thickness.
As an example, Figure 11 shows the magnitude of sensor output in accordance with the change of contact material. The output is adjusted as 1.0 when the sensor element is sandwiched directly between the aluminum plates. A circular sensor element with 50 mm diameter is used. The silicon rubber on both sides of PVDF is
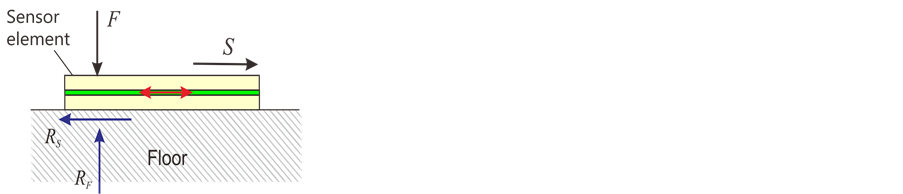
Figure 9. Example of the tensile strain (red arrow) generated in the sensor element caused by rubbing force. F is compressive force, S is rubbing force and RF and RS are the corresponding reaction forces.
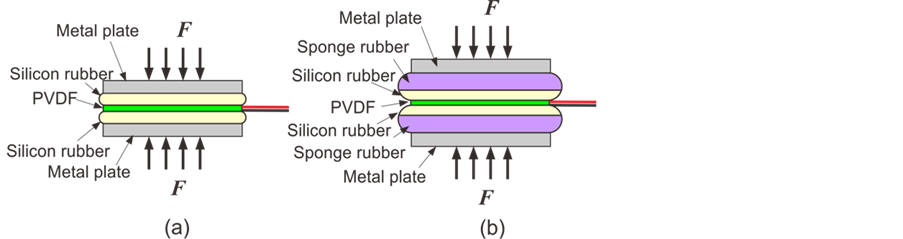
Figure 10. Error signal caused by the difference of contact friction.
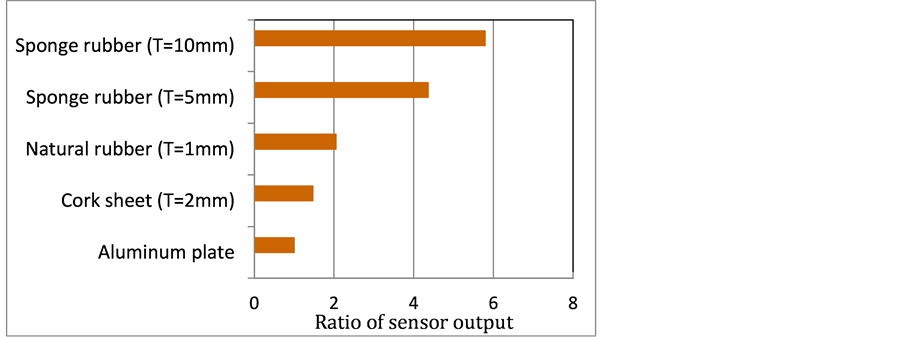
Figure 11. Variability of sensor signal caused by the difference of contact material.
1 mm thickness. Sponge rubber sheet (T = 5 mm, 10 mm thick) or natural rubber sheet (T = 1 mm) or cork plate (T = 2 mm) was sandwiched between the sensor element and the aluminum plate. As the contact material becomes softer, the sensor output increases as shown in the figure. In the case of thick sponge rubber (T = 10 mm), the magnitude becomes several times compared with the case of the aluminum plate.
3.4. Influence of Lateral Compression Caused by the Overhanging Deformation of Flexible Material
Figure 12 shows the state that a soft material in large size enough to cover the sensor element collides with the element. When the force F acts on the sensor surface, impact force (solid curve) in compressive direction is produced as shown in Figure 12(a) at first. However, by the succeeding deformation of soft material, a part exceeding the area of the sensor element may press the element from the lateral direction. By the transverse compressive force from the surrounding, the sensor generates a signal in opposite direction as shown by dashed
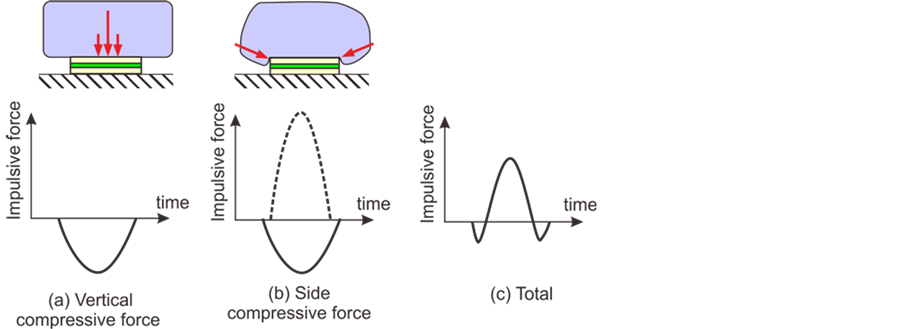
Figure 12. Lateral compression phenomenon caused bythe overhanging deformation of flexible material.
curve of Figure 12(b). As a result, the sensor signal becomes the sum of solid and dashed curve as shown in Figure 12(c).
Figure 13 shows an example of such waveforms by the free drop test of soccer ball. A circular sensor element with 50 mm diameter was placed on the load cell, and the ball was fallen onto the sensor. Figure 13 compares the sensor output (red curve) and the load cell output (black curve). When bottom of the ball collide the center of sensor, the sensor output is generated on the negative side. After that, it turns into the opposite side in the halfway, since the overhanging part of deformed ball presses the sensor laterally. Therefore, the sensor waveform becomes quite different from the load cell waveform. Such lateral compression occurs as well when the sensor bottom is in buried condition in soft material.
4. Flexible Sensor Made from Plural Sensor Elements Arranged in a Matrix
In order to eliminate the above influences, in this study, we develop a sensor element of rigid plate type. The sensor elements are distributed in a matrix, and the seam portion of each sensor element is connected flexibly in order to ensure the flexibility. Further, a new manner to acquire the sensor signal without using electrical wiring is employed.
4.1. Prototype of Sensor Element
Figure 14 shows the sensor element with 30 mm square and the twenty elements made for this research. At first, silicon rubber sheet with 1 mm thickness was adhered on both surfaces of PVDF. Next, a circular hole was drilled in the center of the silicon rubber, and the hole was filled with conductive rubber. The conductive rubber was designed to contact the electrode of PVDF. Furthermore, aluminum plate was adhered on the silicon rubber on each side. The upside and downside electrode of PVDF are connected with the upper and lower aluminum plate respectively via conductive rubber. In order to assure the electric contact between the PVDF and the aluminum plate, the conductive rubber was pressed by screw. The reason of using 5 mm thick aluminum plate is that metal plate with certain thickness is necessary in order to prevent the bending deformation.
Each sensor element was placed on load cell and punched by hand hammer (with felt cap) several times. Figure 15 shows examples of the impact force waveforms. Solid curve is the sensor output and dashed curve is the load cell output. Eventually, sixteen elements among them were selected and used for the flexible sensor.
Figure 16 shows the output gradient of the chosen sensor elements. The horizontal axis is the peak impact force obtained by load cell and the vertical axis is the peak output of the sensor element. As shown in the figure, load-bearing capacity of a single sensor element is more than 1.5 kN. If the impact force is distributed to several sensor elements, then the load bearing capacity is more than 10 kN.
4.2. Prototype of Flexible Impact Force Sensor
Figure 17(a) shows a flexible sensor in which sixteen sensor elements are arranged in a 4 × 4 matrix. The sensor
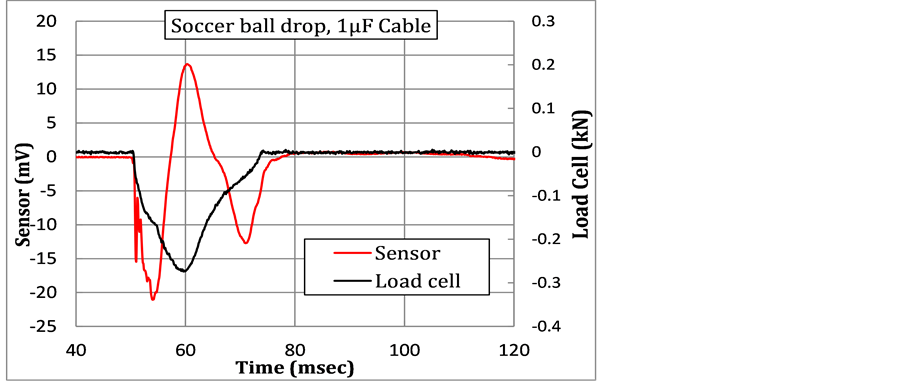
Figure 13. Impact force waveform in which vertical and lateral compression is mixed.
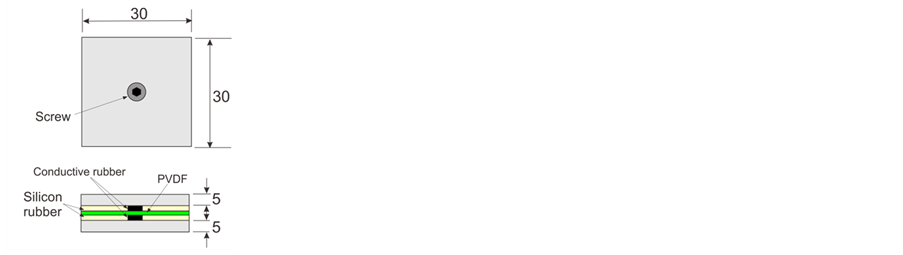
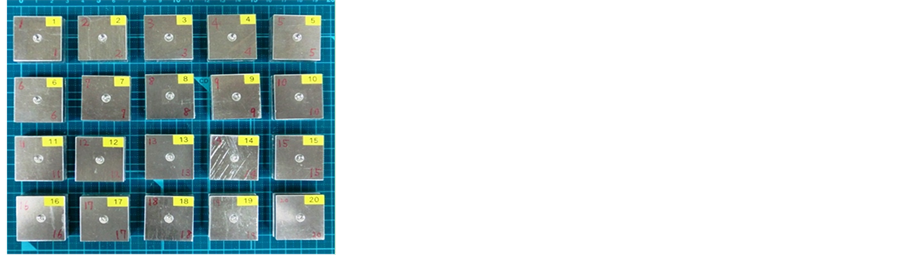
Figure 14. Configuration of the prototype sensor elements.
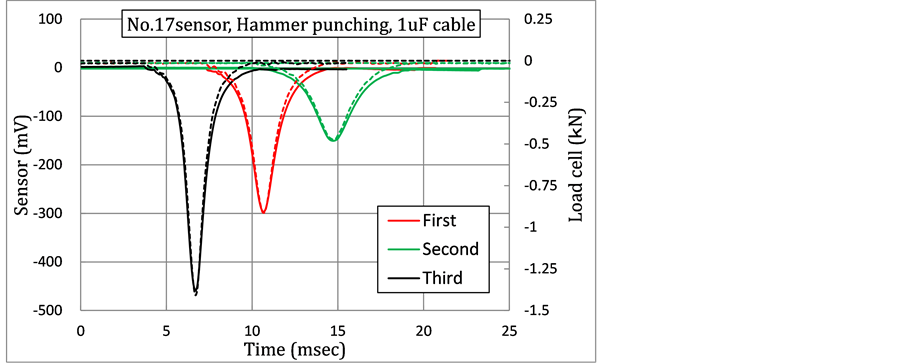
Figure 15. Example of impact force waveform of sensorelement (solid curve) and load cell (dashed curve).
is covered with artificial leather. Its surrounding and the vertical and horizontal column are finished by sewing. The total size is about 230 mm square. Figure 17(b) shows the sensor inserted into conductive cloth bag for static shielding. Green cable is the ground wire. Piezoelectric sensors are prone to be influenced by static electricity [9] [10] . In order to prevent the signal drift by static electricity, it is preferable to use in the state of elec-
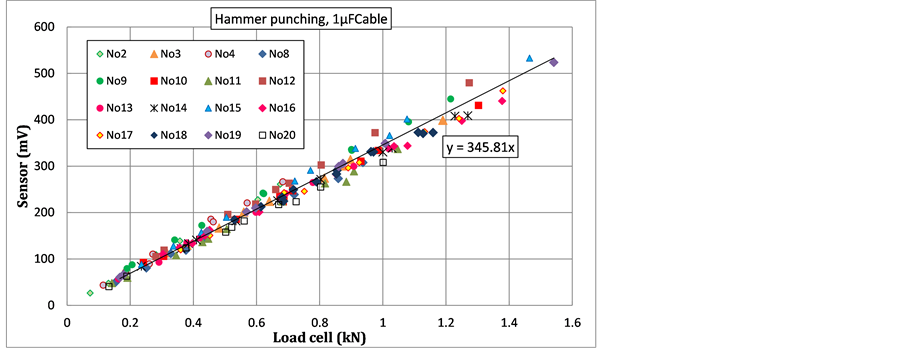
Figure 16. Relationship between sensor output and load cell output obtained by the hammer punching test.
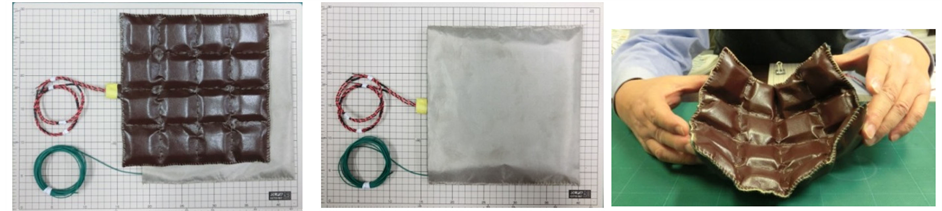
Figure 17. Prototype sensor. (a) Flexible sensor consisting of 4 × 4 sensor elements; (b) Conductive cloth bag; (c) Hold the sensor bend.
trostatic shielding. Figure 17(c) shows the state in holding by bending the sensor. Even though the sensor element itself is a rigid body, the connecting portions of the sensor elements can keep the flexibility.
Figure 18 shows the cross section view of the flexible sensor. The upper aluminum plates of all sensor elements are in contact with the upper conductive cloth. Further, the lower aluminum plates of all sensor elements are in contact with the lower conductive cloth. In order to prevent short-circuiting of the upper and lower conductive cloth, bilayer deer skin is sandwiched in the thickness center of the sensor as the insulation sheet. After sewing the intermediate portion of the sensor element and element, each sensor element is in a state put into a pocket.
The electrical wires are connected to the lower and upper conductive cloth respectively. In other words, the output signal of the sensor element is obtained from the conductive cloth via upper and lower aluminum plate. Because there is no electrical wiring to connect each sensor element, there is no risk of electric disconnection.
It is obvious that the flexibility of the sensor increases as the increase of the number of sensor elements distributed. If the sensor element is assumed as “a plate placed on the elastic floor”, the bending moment reduces along with the sensor dimension becomes smaller. Therefore, it is possible to reduce the sensor thickness as the size of sensor element is small.
5. Experiment
5.1. Comparison of Sensor Output and Load Cell Output
Figure 19 shows the photos of boxing punching test. First, thick acryl plate was fixed on the top of a load cell with 10 kN capacity. Sponge rubber sheet with 40 mm thickness was placed on it. Then, the flexible sensor inserted in the conductive cloth bag was placed on the sponge rubber and a student punched it by boxing glove. Since the sponge rubber is pretty thick, the central portion of the sensor is deformed concave by the punching.
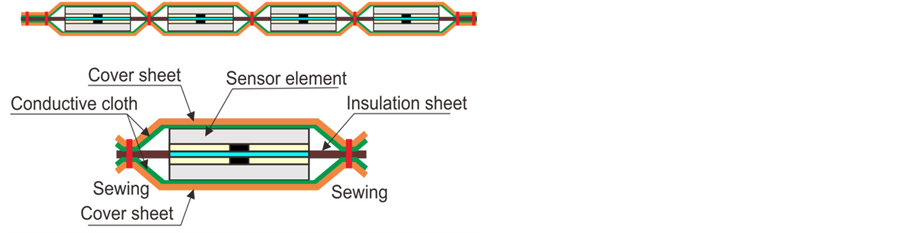
Figure 18. Schematic view of sensor cross-section. Cover sheet is artificial leather. Insulation sheet is bilayer deer skin.
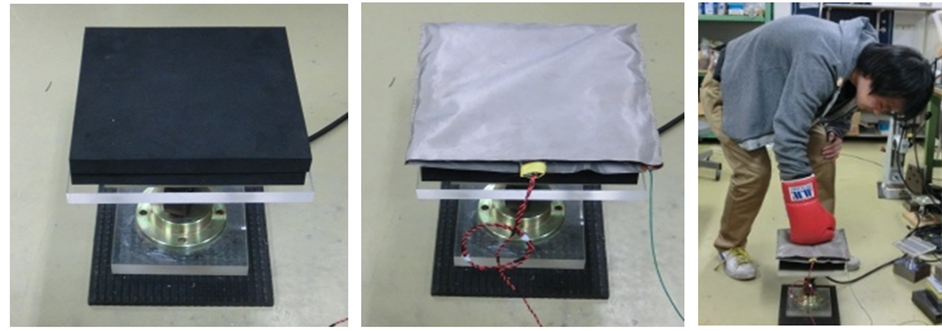
Figure 19. Impact test of flexible sensor on the load cell. (a) Sponge rubber (t = 40 mm) put on the load cell; (b) Sensor placed on the sponge rubber; (c) Punching test by boxing glove.
Also, similar experiment was conducted under the condition that the flexible sensor was placed directly on the acryl plate.
Figure 20 shows an example of impact force waveform measured in the above punching test. Solid and dashed curves indicate the experiments on the sponge rubber and the acryl plate respectively. The red curve is sensor output and the black curve is load cell output. The impact force waveform of the sensor is in good agreement with that of load cell.
Figure 21 shows the relationship between output peak of the sensor and output peak of the load cell. Regardless of the presence or absence of sponge rubber, the sensor output shows almost same gradient. This means that the sensor can measure the impact force in the flexible interface.
Figure 22 shows sponge sheet with 40 mm thickness overlaid on the sponge rubber. The total thickness of the bilayer is 80 mm. The sensor was placed on the sponge sheet and punched by boxing glove. In the figure, two examples of the impact force waveform are compared with that of the load cell output. As the sponge is so soft, the sensor was greatly deformed in a concave shape. There is somewhat difference in the waveform of sensor and load cell.
Figure 23 shows the sensor placed in bent condition on the wood semicircular column with diameter 150 mm. Some positions of the sensor were fixed with gum tape. Then, the sensor was punched by boxing glove. The relationship between the load cell output and the sensor output are indicated by black diamond. The red circle in the figure is the output gradient of the experiment shown in Figure 22. These two gradients are substantially coincident. Moreover, this output gradient is in good agreement with that in Figure 21.
5.2. Punching Test of the Sensor Installed on Concrete Wall
Figure 24 shows the punching test by boxing glove on concrete wall. Firstly, sponge rubber sheet (40 mm thickness) was pasted on the concrete wall. The sensor was placed on the sponge rubber sheet and the several
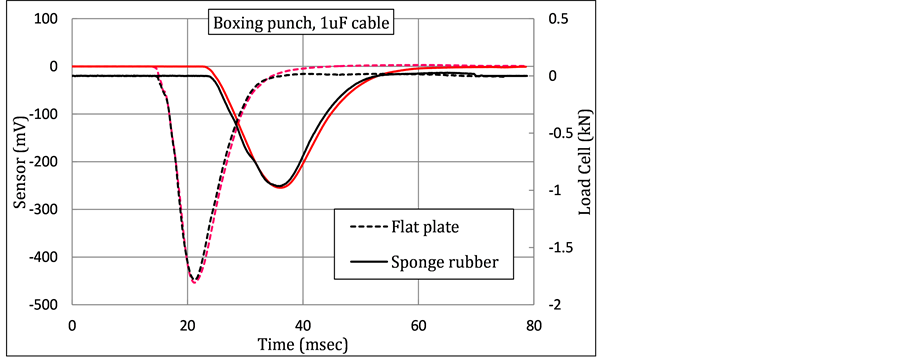
Figure 20. Impact force waveforms of the sensor and the load cell. Red curve is sensor, black curve is load cell.
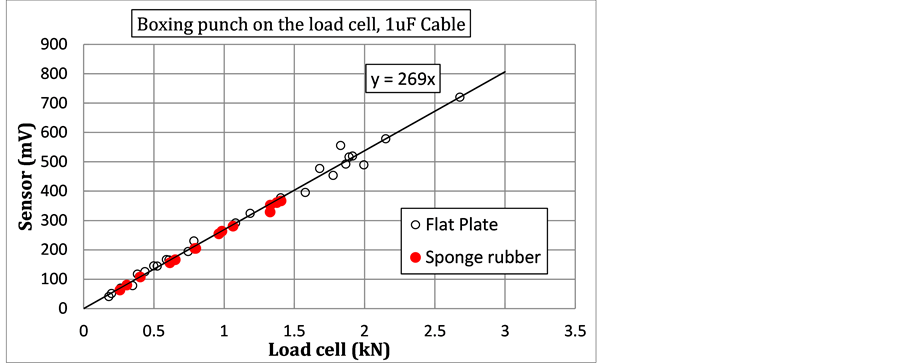
Figure 21. Comparison of the peak output between sensor and load cell.
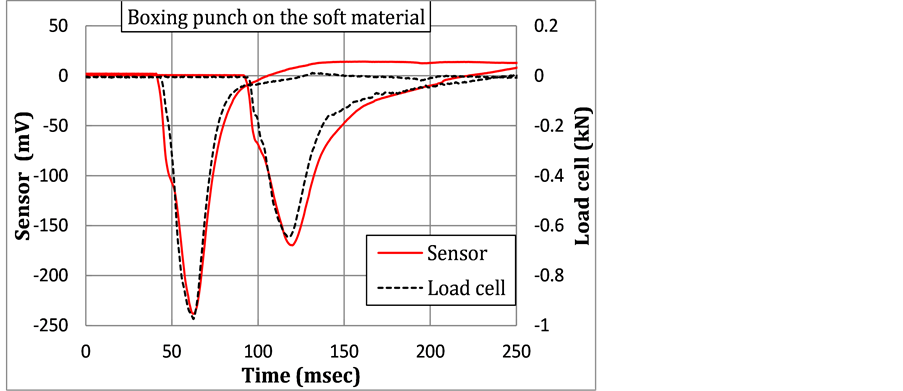
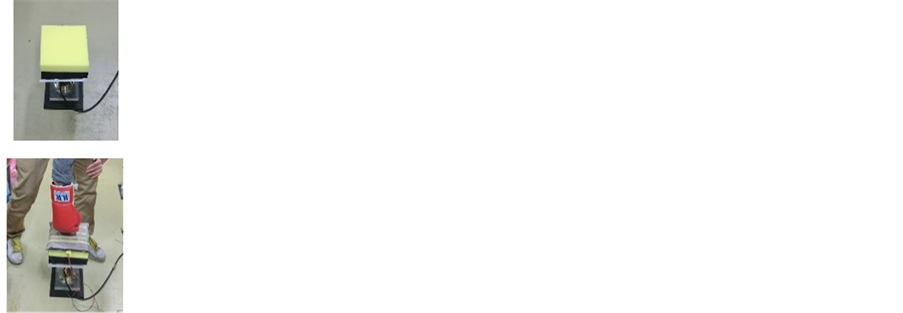
Figure 22. Impact force waveform of sensor and load cell. Sponge is overlaid on top of the sponge rubber.
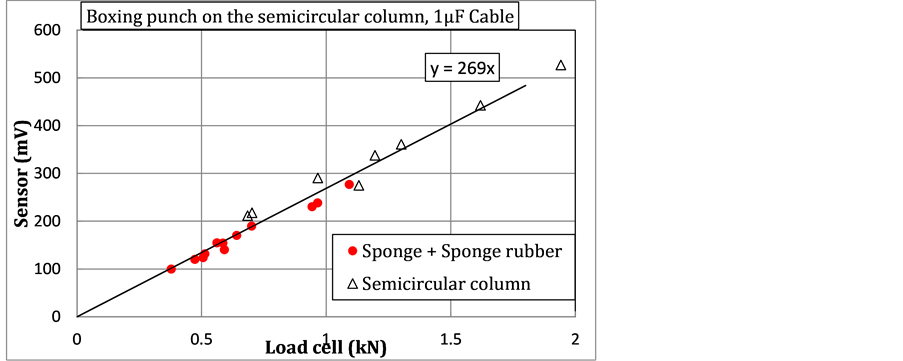
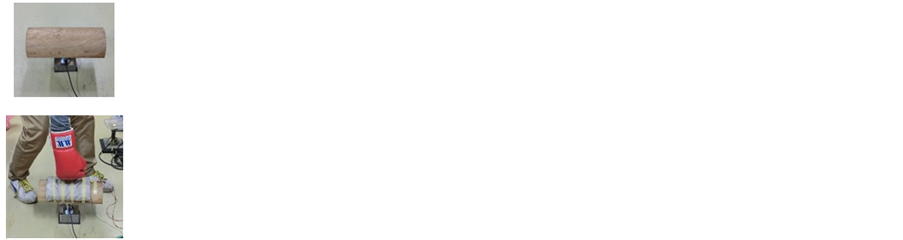
Figure 23. Relationship between sensor output and load cell output. Black diamond: semicircular column.Red circle: sponge & sponge rubber sheet.
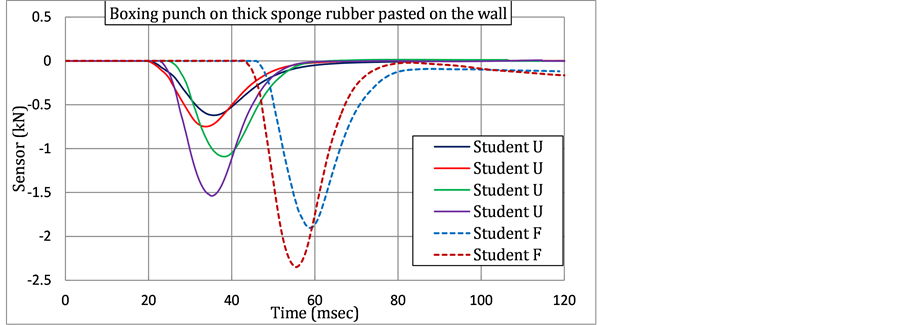
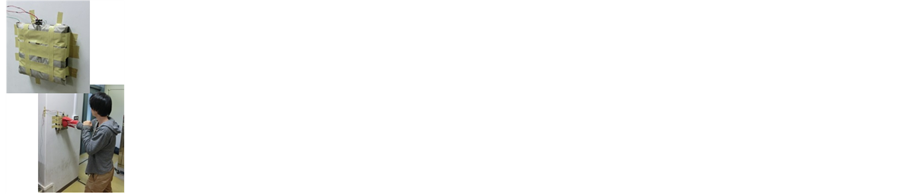
Figure 24. Boxing punching of the sensor installed on the 40 mm thick sponge rubber pasted on concrete wall.
parts are fixed on the wall with gum tape. Four impact force waveforms weakly punched by student “U” and two waveforms strongly punched by student “F” are shown in the figure. The peak impact force by the strong punching is around 2 kN. The contact time is about 30 - 40 msec.
5.3. Punching Test of the Sensor Installed on Sandbag
Figure 25 shows the experiment of boxing punching sensor was placed on the surface of a sandbag (soft sandbag) of gymnasium and fixed with gum tape. Compared with the punching on the concrete wall, the sandbag is softer and a concave deformation is induced on sandbag surface by punching.
Figure 26 shows the impact force waveforms. The peak impact force ranges 0.7 kN and 0.9 kN. The contact time is about 70 msec and this is longer than that on the wall punching. In the figure, it is seen that the gradient of impact force becomes gentle from the middle of unloading. This reason is considered as follows. The sandbag swings rearward by the punching. Therefore, the forward speed of the glove persists for a while even after passing the peak load. Since the pull-back of the glove is delayed, the contact between glove and sandbag is continued for a while. The difference of the gradient of unloading segment is clear when compared to the waveform of wall punching in Figure 24.
6. Improvement of the Sensor Flexibility
Sensor elements described above is 30 mm square and 12 mm thickness. To improve the flexibility of the sensor,
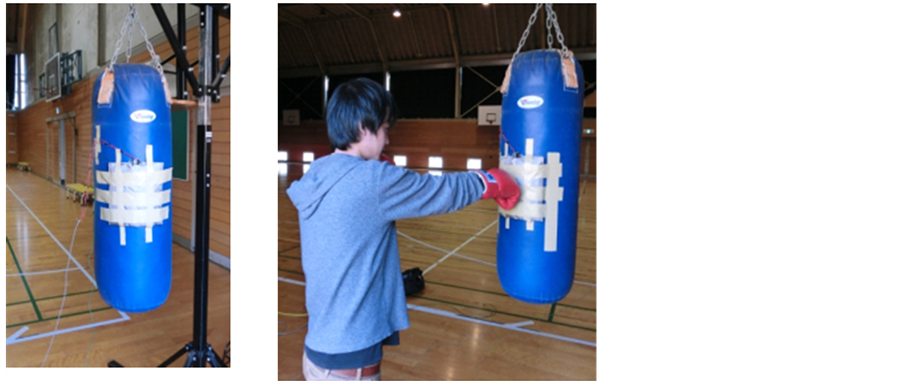
Figure 25. Boxing punching of the sensor installed on the sandbag.
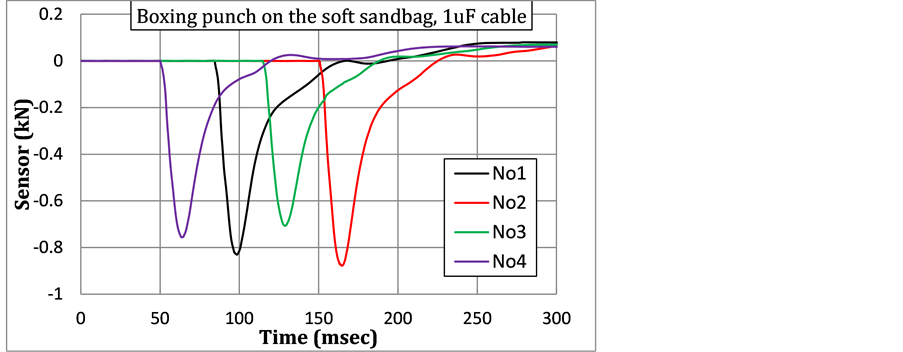
Figure 26. Impact force waveform of the sensor installed on the soft sandbag surface and punched by boxing glove.
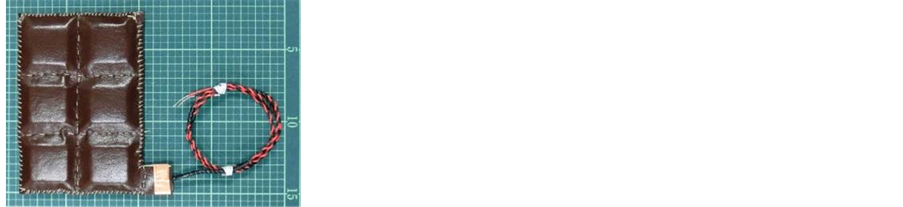
it is necessary to increase the distribution density by reducing size and thickness of the sensor element. Figure 27(a) shows slightly small sized sensor elements with 25 mm square and 8 mm thickness. Figure 27(b) is a flexible sensor made from the six elements.
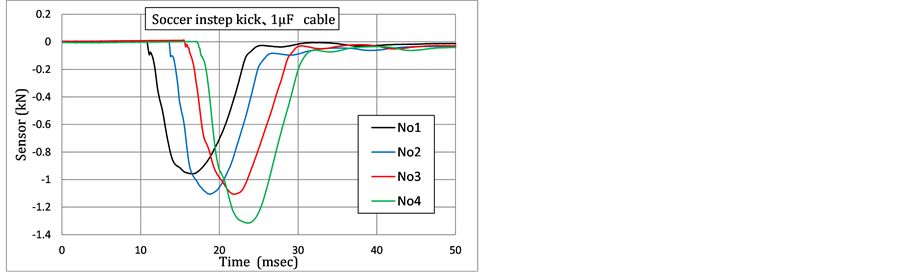
Figure 28(a) shows the sensor fixed to the instep of soccer shoes with cords and rubber bands. Figure 28(b) shows the impact force waveforms of instep kick of soccer ball. The strength of the kick is the extent to path to nearby players. The peak impact force is about 1 kN and the impact time is about 12 - 15 msec. This contact time is close to the value shown in the reference [11] .
From the experience, it seems possible to miniaturize the element size to 15 mm square and 5 mm thickness. When the element becomes smaller than that, however, reconsideration of the manufacturing process is necessary. In spite of the rough distribution density of the sensor elements, the sandbag sensor was not much discomfort at the time of use. On the other hand, in the soccer shoe sensor, the sensor weight and the lack of flexibility were felt uncomfortable. “Flexibility” and “light weight” are thought to be more important for the sensors installed on human body side.
7. Conclusions
This study is aimed to develop a flexible sensor which can be used in the measurement of impact force in flexible interface. The boxing punching is chosen as the measurement object. The results obtained are as follows.
 (a)
(a)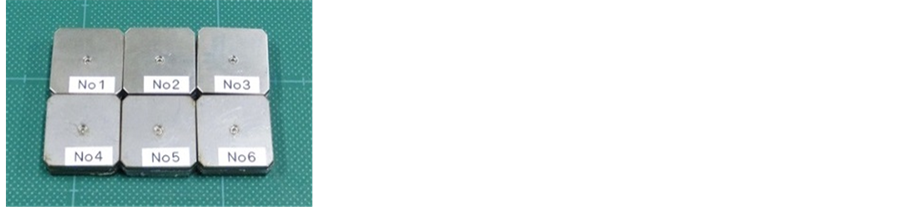 (b)
(b)
Figure 27. (a) Sensor elements of 25 mm square and 8 mm thickness; (b) Flexible sensor made fromsix sensor elements.
 (a)
(a) (b)
(b)
Figure 28. (a) Set up of the sensor on soccer shoe; (b) Impact force waveforms of instep kick of soccer ball.
1) A flexible sensor in which sixteen sensor elements are arranged in a 4 × 4 matrix is developed. Each sensor element is a rigid plate structure. The sensor elements are arranged at regular intervals. Both entire surfaces of the sensor elements are covered with artificial leather, and its surrounding and the vertical and horizontal columns are finished by sewing. Flexibility of the sensor is achieved by the flexible leather connections between adjacent sensor elements;
2) Sum of the output signal of each sensor element is collected through the conductive cloth. Since there is no electrical wiring inside the sensor, the sensor structure is hard to break by the impact force which is realized;
3) Boxing punching experiments were carried out by installing the sensor on concrete wall and sandbag. The flexible sensor showed a good performance in the experiments;
4) The proposed sensor is inadequate distribution number of sensor elements, but the proposed sensor includes mechanisms to achieve a flexible sensor with high accuracy. By increasing the distribution density of the sensor element, it can approach to the practical sensor.
Flexibility, thinness, lightness, toughness and accuracy are the keys of flexible impact force sensor. Overcoming of these problems is essential for the realization of the sensor that can be installed on human body or robot.
Acknowledgements
The authors wish to thank Tadashi Uesugi, Takahiro Namikawa, Atsushi Maeda and Takuya Okada of the Graduate School of Engineering, Hiroshima University for their assistance in experiments. This work was partially supported by the Venture Business Laboratory of Hiroshima University.
References
- Ishikawa, M. and Shimojo, M. (1982) A Method for Measuring the Center Position of a Two Dimensional Distributed Load Using Pressure-Conductive Rubber. Transactions of the Society of Instrument and Control Engineers, 18, 730-735.
- Mei, T., Li, W.J., Ge, Y., Chen, Y., Ni, L. and Chan, M.H. (2000) An Integrated MEMS Three-Dimensional Tactile Sensor with Large Force Range. Sensors and Actuators, 80, 155-162. http://dx.doi.org/10.1016/S0924-4247(99)00261-7
- Lee, H.K., Chang, S.I. and Yoon, E. (2006) A Flexible Polymer Tactile Sensor: Fabrication and Modular Expandability for Large Area Deployment. Journal of Micro Electromechanical Systems, 15, 1681-1686. http://dx.doi.org/10.1109/JMEMS.2006.886021
- Donati, M., Vitiello, N., De Rossi, S.M.M., Lenzi, T., Crea, S., Persichetti, A., Giovacchini, F., Koopman, B., Porobnik, J., Munih, M. and Carrozza, M.C. (2013) A Flexible Technology for the Distributed Measurement of Interaction Pressure. Sensors, 13, 1021-1045. http://dx.doi.org/10.3390/s130101021
- Lee, M.H. and Nicholls, H.R. (1999) Review Article Tactile sensing for Mechatronics—A State of the Art Survey. Mechatronics, 9, 1-31. http://dx.doi.org/10.1016/S0957-4158(98)00045-2
- Lumelsky, V.J., Shur, M.S. and Wagner, S. (2001) Sensitive Skin. IEEE Sensors Journal, 1, 41-51. http://dx.doi.org/10.1109/JSEN.2001.923586
- Walilko, T.J., Viano, D.C. and Bir, C.A. (2005) Biomechanics of the Head for Olympic Boxer Punches to the Face. British Journal of Sports Medicine, 39, 710-719. http://dx.doi.org/10.1136/bjsm.2004.014126
- Fujimoto, Y. and Setyanto, A.T. (2007) Sheet Type Impact Force Sensor by the Use of Piezoelectric Film. Transactions of the Japan Society of Mechanical Engineers, Series C, 73, 184-191. (in Japanese) http://dx.doi.org/10.1299/kikaic.73.184
- Fujimoto, Y., Shintaku, E., Tanaka, Y. and Fujiyoshi, J. (2012) Pad Type Compressive Force Sensor Suitable for High-Speed Impact Force Measurement. Transactions of the Japan Society of Mechanical Engineers, Series C, 78, 2438-2449. (in Japanese)
- Fujimoto, Y., Liu, C., Uesugi, T., Tanaka, Y. and Shintaku, E. (2013) Pipe Surface Sensor for Impulsive Force Measurement. Transactions of the Japan Society of Mechanical Engineers, Series C, 79, 113-123. (in Japanese) http://dx.doi.org/10.1299/kikaic.79.1949
- Shinkai, H., Nunome, H., Ikegami, Y. and Isokawa, M. (2008) Ball-Foot Interaction in Impact Phase of Instep Soccer Kick. In: Reilly, T. and Korkusuz, F., Eds., Science and Football VI, The Proceedings of the 6th World Congress on Science and Football, Routledge, Abingdon, 41-46.