Journal of Sensor Technology
Vol.4 No.1(2014), Article ID:43933,12 pages DOI:10.4236/jst.2014.41004
A Smart Multi-Sensor Approach to Monitoring Weak People in Indoor Environments
Bruno Andò, Salvatore Baglio, Antonio Pistorio
D.I.E.E.I., University of Catania, Catania, Italy
Email: bruno.ando@dieei.unict.it
Copyright © 2014 by authors and Scientific Research Publishing Inc.
This work is licensed under the Creative Commons Attribution International License (CC BY).
http://creativecommons.org/licenses/by/4.0/


Received 30 March 2013; revised 23 December 2013; accepted 15 January 2014
ABSTRACT
This paper deals with a novel system to assist weak people while exploring indoor environments. The proposed architecture is aimed to monitor the position and inertial behavior of users as well as environmental status (e.g. temperature, humidity, gases leakage, or smoke). The system is based on a Wireless Sensor Network and smart paradigms which extract relevant information from data collected through the multi-sensor architecture. The data collected are then processed to build awareness of User-Environment Interaction and User-Environment Contextualization. This knowledge is used to build information that is useful to the user for safe and efficient exploitation of the environment and to the supervisor for a suitable assessment and management of hazard situations. The paper mainly focuses on the multi-sensor system architecture and smart paradigms used to implement the User-Environment Contextualization feature.
Keywords:WSN; Weak People Monitoring; Assistive Systems; Sensor Data Fusion; User-Environment Contextualization; User-Environment Interaction

1. Introduction
The state of the art in the field of assistive systems for weak people and the role of emerging technologies is extensively discussed in [1] -[6] . Navigation assistive systems must accomplish two main tasks: to build awareness of surroundings and to provide the user with information that is useful for safe and efficient mobility. Several technologies can be used to acquire information from the environment, such as ultrasonic, infrared, laser and cameras, while auditory and/or tactile solutions can be used to provide relevant feedback to the user [7] -[10] .
The Binaural Sonic Aid (SonicGuide) is a sophisticated head-mounted device which exploits an ultrasonic wide-beam to convert environment contents into audio codification [9] .
The Miniguide system is a handheld device which uses an ultrasonic beam to measure the distance to obstacles. In order to convey the information about the presence and distance of obstacles vibrational feedback is exploited [10] .
Examples of electronic travel aids based on electromagnetic and optical devices are described in [11] [12] . The Kahru Tactile Outdoor Navigator [13] is a wearable tactile harness-vest display which provides directional navigation instructions by exploiting vibrating motors.
In [14] an electronic assistive system for outdoor mobility is presented which uses a tactile display embedded in a vest to provide directional information.
The NavBelt is a system that uses an array of ultrasonic sensors mounted on a belt to provide an acoustical feedback about the presence of obstacles very close to and ahead of the user [15] .
The ActiveBelt exploits a GPS, a geomagnetic sensor and a belt tactile display to support directional navigation [16] .
The evolution towards more cognitive devices exploits a camera to perceive the environment and convenient translation of its contents into sounds or tactile perception. Examples of such systems are the vOICe system by Philips Co [17] and the Intelligent Glasses [18] .
Notable efforts have also been dedicated to the development of solutions using digital tags, active badges, accelerometers, temperature and photodiodes to transmit some form of remote signal once the user gets into the range of the device [19] .
The main drawbacks of several navigation systems in the literature are related to discontinuous assistance for the user, the high cost and sometimes the arbitrary form of information provided [19] .
Sensor networks and ambient intelligence are setting new directions in the field of ambient assistive living (AAL) [20] [21] .
In [22] a CANBUS (Controller Area Network Bus) sensor network is proposed which aims to provide weak users (elderly or impaired people) with information that is useful for safe and efficient exploitation of indoor environments. The main system functionalities are based on advanced localization techniques and paradigms providing awareness of the User-Environment Interaction (UEI), such as the presence of obstacles or services. The advantages of this approach are mainly related to the possibility of providing the user with a continuous spatio-temporal form of assistance. This feature represents a dramatic advance with respect to the state of the art and this is mainly due to the methodology adopted for user localization. The latter is based on the continuous interaction between the user module, equipped with an ultrasound transmitter, and a distributed architecture of sensor nodes equipped with ultrasound receivers. This methodology allows a very accurate estimation and a continuous update of the user’s position within the environment [22] .
The assistive system discussed in [23] and detailed through this paper represents an improvement with respect to the architecture proposed in [22] . The proposed approach allows for distributed monitoring of the environmental status (in terms of hazards such as fires, gas leakage, smoke), the user’s position and the user’s inertial behavior (posture and dynamic). The main novelty of this solution consists in the possibility of building awareness of the User-Environment Contextualization, UEC (implemented through the UEC tool), which actually relates the user status to the environment status. The correlation between user postures and hazard events is an example of this relationship which can provide the system supervisor with useful information to properly manage critical events. Moreover, the use of a WSN is a convenient substitute for the CANBUS network.
This paper mainly addresses novel features of the assistive system, with particular regard to the UEC tool functionality and solutions adopted for both environment monitoring and assessment of the user inertial behavior. It must be considered that the WSN developed also implements the user localization task and the UEI functionalities mentioned above and addressed in depth in [22] . The implementation and experimental assessment of the UEI tool are also described in [24] .
Combining the awareness furnished by the UEI and UEC tools represents a novel approach to assisting weak users in the mobility tasks of daily living. Information provided by these tools (the user’s position, the presence of obstacles and services, the user’s status and environment hazards) could be used to provide the user with useful information for safe and efficient mobility and the supervisor with a descriptive representation of the status of both the user and the environment. The latter could help the supervisor to take decisions and to perform actions to manage hazards or specific user needs.
Information coming from the UEC and UEI tools is automatically processed by a Decision Support System (DSS) which can provide optimal information for the user and a list of suggested actions for the system supervisor.
The main advantages of the proposed system are highlighted in following statements:
Ÿ great accuracy of the user localization system due to accurate measurements of (multiple) distances between the user and network nodes, leading to a suitable distance measurement redundancy.
Ÿ the continuous operation mode of the localization system which provides user positions with high spatiotemporal resolution.
Ÿ continuous spatio-temporal awareness of User-Environment Interaction.
Ÿ real-time awareness of User-Environment Contextualization.
The above features represent a dramatic advance in the form of assistance provided to weak people compared with traditional solutions in the state of the art.
In conclusion, it can be affirmed that the proposed system provides a continuous awareness of the user-environment relationship (contextualization and interaction) which provides real-time assistance for the user and relevant information for alerts management to the supervisor.
The low cost, the flexibility of the architecture, and the ease of use/implementation are other interesting features of the proposed system.
A general overview of the working lab-scale prototype is described in Section 2. Sections 3 and 4 give details of sensing features and other solutions adopted to monitor the user’s inertial status. In Section 5, the UEC functionalities will be described along with examples of information generated to support the user and the supervisor. Experimental results are discussed in Section 6.
2. An Overview of the System Developed
A schematization of the assistive system developed to support mobility of weak people in indoor environments is shown in Figure 1. The system architecture consists of a Wireless Sensor Network (WSN) with multi-parametric sensor nodes, a user module, a server node connected to a PC, pre-processing algorithms, UEC and UEI paradigms, the DSS, a Graphical User Interface (GUI) for the supervisor and a dedicated User Interface.
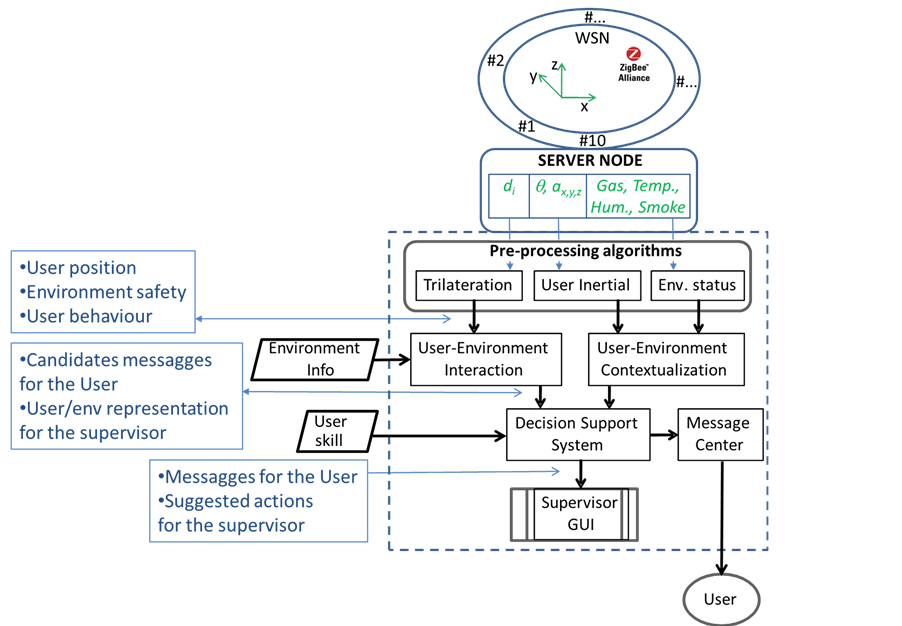
Figure 1. A schematization of the assistive system (© 2011 IEEE, M&N2011, [23] ).
The WSN architecture has been developed with commercially off-the-shelf components implementing a ZigBee based protocol. Network nodes have been equipped with sensors for environmental monitoring (gas, temperature, humidity, smoke) and ultrasound sensors (US) for user localization.
The user module is equipped with sensors to detect the user’s inertial behavior and a US transducer for the user localization task.
Rough data gathered by the WSN (environment quantities, user inertial quantities, user distance from the sensor nodes) are used by pre-processing algorithms to implement user localization, user inertial status monitoring and environmental status monitoring tasks.
The user localization is performed through trilateration algorithms using distances between the user and the sensor nodes. Distances are measured by ultrasound sensors installed in the network nodes and the user module [22] .
The User-Environment Interaction (UEI) tool exploits information on both the user localization and the environment itself (obstacles, services) to detect upcoming events (collisions, presence of services close to the user). Due to the above features, the supervisor is updated with the user’s position while the UEI generates candidate messages for the user, with an assigned priority, assuring an efficient and safe mobility task. Details on the above paradigms can be found in [22] [23] .
The User-Environment Contextualization (UEC) tool provides the supervisor with awareness of the user status relative to the environment status, and generates candidate messages for the user with an assigned priority, as detailed in Section 3. In the current version, the DSS is in charge of sorting candidate messages generated by the UEI and UEC tools, while future releases will implement both smart assistive tasks, also taking into account the user’s skill/abilities. Another possible action to be performed by the DSS is the generation of suggested actions for the supervisor, on the basis of information generated by the UEC tool, in order to manage emergencies.
User notifications are delivered through the message center that manages the user interface.
For convenience, the user interface of the lab-scale prototype is a Bluetooth headphone remotely controlled by the message center. However, the architecture developed can work with other kinds of interface (e.g. tactile devices).
The GUI provides rough data coming from the sensor network (environmental sensors, inertial sensors in the user module, user’s distance from the network nodes), information extracted by the user inertial tool (user posture, user dynamic), information given by the UEI tool (user localization in the environment map, interaction with obstacles and services) and the information given by the UEC tool (user status related to the environment status).
In the following, the WSN architecture, the multi-sensor strategy adopted to monitor environmental quantities and the user status and the UEC tool will be presented.
3. The WSN Architecture
In this section the architecture implemented for the monitoring of critical environmental quantities is described. The system consists of a “server node” and a set of autonomous sensor nodes which can monitor temperature, humidity, smoke and the presence of gases.
In particular, the WSN developed consists of ten nodes which are suitable to cover the test-bed environment under consideration, also taking into account the operating range of the sensors used (around 5 m) to measure the user’s distance from the network nodes.
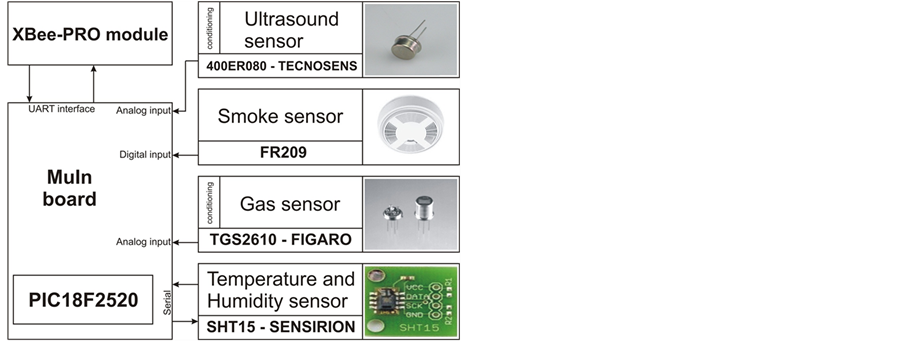
The architecture and the real view of a network node are schematized in Figures 2(a) and (b), respectively.
Each node, except for the server node, is equipped with the Multi-Interface (MuIn) board by Droids®. The latter is a versatile 10-Bit Multi Interface Board equipped with a PIC18f2520 running at 40 MHz, two PWM channels, five analog channels and a I2C bus. The firmware for the PIC18f2520 microcontrollers of the MuIn board was implemented through the MPLAB IDE development environment by Microchip. The wireless link is implemented through the XBee-PRO modules by MaxStream, Inc., which support the ZigBee communication protocol in the ISM 2.4 GHz frequency band. The main specifications of the MuIn boards and XBee-PRO modules are given in Tables 1 and 2, respectively.
The server node is implemented through the XBee-USB board connected to the PC server.
Network nodes are fully battery operated while the server node is directly connected to a PC through a USB port. For the purpose of this work, the system components are commercially off-the-shelf and low-cost devices.
 (a)
(a)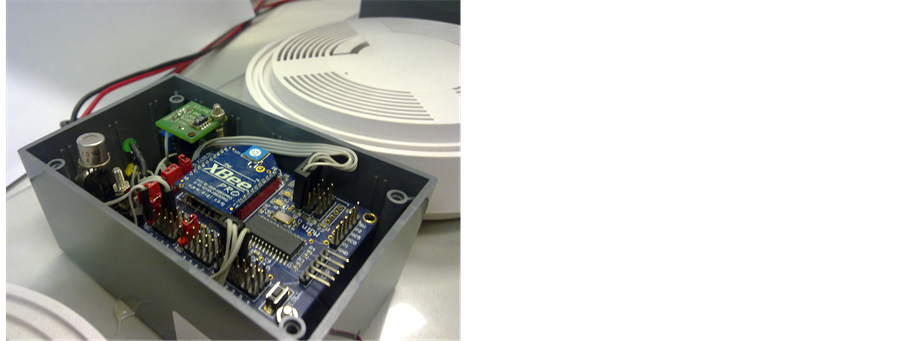 (b)
(b)

Table 1. MuIn specifications.
Table 2. XBee-PRO module specifications.
The smoke sensor used is the FR209 device, shown in Figure 2(a). It is a low power device (over 10 s: 10 µA@9 V for 9 s and 1 mA@9 V for 1 s) using a photoelectric readout strategy which is particularly suitable to detect slow-burning fires. The device output, connected to a digital input of the MuIn board, reveals if the smoke concentration in the environment exceeds a pre-established safety threshold.
The gas sensor is the TGS2610 by FIGARO, shown in Figure 2(a), which is characterized by a high sensitivity to methane, propane and butane. The device’s operating range is between 500 ppm and 10,000 ppm with a sensitivity of about 250 µV/ppm. The conditioning circuit shown in Figure 3 has been developed to adapt the output voltage level of the gas sensor to the analog input of the MuIn board. Circuit components are defined in Table 3. The circuit is devoted to power the heater resistance of the TGS2610 sensor and to convert the variation of the sensor resistance, Rs, related to gas concentration, into an output voltage, Vout. The latter is acquired by the MuIn board.
Temperature and humidity are measured through the SHt15 device by SENSIRION, shown in Figure 2(a), in single chip CMOS technology. The operating range of the temperature sensor is between −40˚C and +120˚C with a resolution of 0.04˚C and an accuracy of +/−0.3˚C. The operating range of the humidity sensor is between

Table 3. TGS2610 gas sensor main specifications.
0% RH and 100% RH with a resolution of 0.4% RH and an accuracy of +/−2% RH. The device response time is less than 4 s, while its power consumption is 2 µW in sleep mode and 3 mW in measuring mode. The communication between the SHt15 device and MuIn board is supported by the I2C bus.
Each node is also equipped with the 400ER080 ultrasound receiver by Tecnosens, shown in Figure 2(a), which interacts with the ultrasound transmitter embedded in the user module in order to measure the user’s distance from each sensor node [22] . The experimental characterization of the system revealed an uncertainty of the order of 1 cm (with an uncertainty coverage factor of 3) in the estimation of user coordinates along the x and the y axis [22] .
The GUI is implemented in LabVIEWTM and, as discussed in Section 5, it allows for the monitoring of environmental and user parameters. Two different communication modes have been developed for the WSN: polling and event triggered.
Polling: all the network nodes are cyclically interrogated by the server node. Each node, when interrogated by the server, sends back the last data acquired by the sensors. After a pre-fixed timeout the server switches to the next node. A list of addressable nodes can be defined through the GUI interface.
Event triggered: this operation mode is strategic for power saving and management of critical events. In particular, a network node communicates with the server only if an ultrasound echo is received or an environmental quantity exceeds a pre-fixed threshold.
It must be considered that the power budget of nodes equipped only with an ultrasound transducer is mainly due to the MuIn board and the XBee-PRO module (see Tables 1 and 2). As shown above, the life time of battery operated nodes depends also on the communication strategy adopted. Nodes equipped with environmental sensors consume more power, as is evident from the sensor specifications.
4. The User Module and the Inertial Tool
As shown in Figure 1, data gathered by the user module and elaborated by dedicated algorithms provide specific information on the user’s inertial behavior (e.g. static or dynamic status, posture and stair negotiation) which can be useful to perform a suitable contextualization of the user with respect to the environment status.
The user module, which could be positioned on the user’s chest, is hence equipped with sensors for monitoring the user’s inertial status and a US transducer dedicated to localization tasks.
The position of the user module must be known in order to correctly process signals coming from the inertial and compass sensors and to properly reconstruct the user’s heading and posture. Moreover, in order to reduce occurrences in which the user’s body blocks the propagation of the ultrasound signal, which could compromise the accuracy of localization, the US transmitter should be placed close to the user’s ear (e.g. by installing the US transducer on the headphone used to deliver messages to the user).
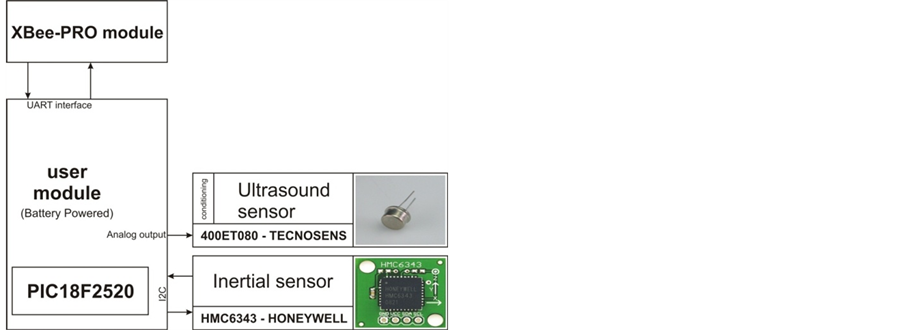
Figure 4(a) shows the architecture of the user module. The device consists of a MuIn board equipped with sensors and the XBee-PRO device. Each user module is univocally identified by an ID in order to implement the multi-user functionality of the assistive system.
The orientation and inertial status of the user are detected by the HMC6343 solid-state compass module with tilt compensation by Honeywell. HMC6343 is an I2C device embedding a three axial compass, a three axial accelerometer and a PIC® core. The device resolution is 0.1˚ while its operating range in the magnetic domain is ±2 G. The compass sensor is used by the UEI tool for the sake of user tracking, while the inertial sensor is used by the user inertial tool.
Concerning the estimation of the user’s heading, the calibration facility provided by the HMC6343 manufacturer has been implemented in the MuIn board by a dedicated firmware. This is needed to correct for hard-iron distortions of the magnetic field, for example due to magnetized materials near the compass. The compass calibration procedure has to be repeated in different sites of the environment considered. The block diagram in Figure 4(b) shows the sequence of operation implemented by the user module firmware. The calibration mode must be operated at the very beginning of the user module operation and it requires a 360˚ rotation around Y axis followed by a 360˚ rotation around the Z axis. At the end of the calibration procedure the actual heading is measured and sent to the server. As discussed in Section 6, the compass sensor has also been characterized to take into account influences related to the set-up developed.
Algorithms of the user inertial tool process data coming from the HMC6343 sensor to build the user’s inertial status. The main features performed by the tool are the detection of the user’s dynamic (stationary or moving), the estimation of the user’s posture (standing, bending, lying down) and negotiation of stairs.
In order to estimate the user’s posture in terms of tilt with respect to the ground plane (XY), the following expression has been used [25] :
 (a)
(a) (b)
(b)
Figure 4. The user module. (a) Schematization, (b) sequence of operations implemented by the user module firmware.
 (1)
(1)
where ai (i = y, z) are averaged acceleration components (ay forward, az vertical) in order to improve the system’s robustness against false posture estimations, especially between erect and bent conditions.
Estimation of the user’s tilt allows us to classify the user’s posture (erect, bent, lying down), on the basis of rules outlined in Table 4. The thresholds in Table 4 have been fixed by several experimental surveys. Although inertial quantities could also be extended to detect other user postures (e.g. seated) this point has not been addressed in this work.
Merging tilt information with the acceleration along the Z axis allows for estimation of the supine or prone position if a horizontal tilt has been detected.
The user’s dynamic condition is estimated following rules in Table 5 assuming, as the initialization state, that at the system start-up the user is in a static state. The strategy adopted exploits information on the user’s actual posture, the previous user dynamic and the mean square value of the vertical acceleration estimated over n samples [26] :
 (2)
(2)
where  is the moving average over n samples.
The thresholds in Table 5 have been fixed by several experimental surveys.
Another feature implemented by the user inertial tool is the detection of stair climbing. With this aim the following quantity has been estimated [26] :
 (3)
(3)
which computes the displacement between the vertical acceleration and its moving average over n samples. Term  in (3) is the standard deviation of the vertical acceleration. Comparing quantity (3) with a suitable experimentally fixed threshold (0.69 for the device under test) allows for the detection of stair climbing activity. The observed az is also permanently compared to nominal values observed in the event of stair climbing activity to filter out false positives estimations.
Quantities (1)-(3) are estimated by the user inertial tool running on the PC server.
5. The User-Environment Contextualization Tool and the GUI
The UEC tool exploits data coming from the environment monitoring and the user inertial tool to build a representation of the user’s status with respect to the environment status.
Pre-processing algorithms (see Figure 1) will provide the user’s inertial status (posture and dynamic) and the.
Table 4. Rules for user posture estimation.
Table 5. Rules for user dynamic estimation.
environment status to the UEC tool, which generates candidate messages for the user (with an associated degree of priority) as well as a description of the user-environment status for the supervisor In the above-mentioned data flow, each condition (a combination of user status and environment status) is associated with an Identification Number, ID_UEC, with a priority, UEC_Priority. Highest priority, 4, is associated with a warning coming from the user status, while priorities 0 and 2 are associated with “no warning” and “environmental warning”, respectively. Priorities 1 and 3 have been reserved for service and obstacle-related events generated by the UEI tool. Table 6 reports examples of candidate user messages generated by the UEC and UEI tools. Message priorities are indicated by the numbers in brackets. As an example, in the case of a user in an erect posture and a safe environment, an “obstacle”-related message will have a higher priority than a “service”-related message. In the case of environmental hazards (e.g. gas leakage) the user will receive an instruction to move towards the emergency exit with a higher priority than any “service”-related message and a lower priority with respect to an “obstacle” notification.
Moreover, in the presence of an environmental hazard, a user in an erect position could be provided with useful information on how to reach the emergency exit, while a user lying down will only be informed about incoming support (a “courtesy message” in Table 6).
The same approach has been used to generate candidate messages for the user by the UEI tool [23] .
The Graphical User Interface (GUI) used during the development phase for system debugging was implemented in LabVIEWTM. The GUI consists of several panels. The first one is dedicated to providing rough data coming from the sensor network and the user module. The second panel provides information generated by pre-processing algorithms as well as user orientation and position. The third panel provides the output of the UEC and UEI tools such as ID_UEC conditions and ID_UEI events. The last panel is the supervisor GUI and it provides information generated by the DSS, such as messages delivered to the user and, in a future release of the system, actions to be suggested to the supervisor.
6. Results
The main feature to be assured with this kind of assistive system for AAL is the reliability of the information provided to the user and the supervisor.
The validation of the UEI tool has already been addressed in [23] and its ability to estimate the user position with an accuracy of the order of 1 cm has been largely discussed.
In the following, results concerning the calibration of the compass sensor will be presented. In order to estimate the overall performance of the system used to measure the user’s orientation (the compass sensor and the overall conditioning electronics), experiments were performed which resulted in the calibration diagram shown in Figure 5. In particular, the compass was tested in the test-bed indoor environment by observing its response during complete turns. To perform the compass characterization, a dedicated experimental set-up was used. The set-up consists of a step motor and an encoder device used to perform an independent measurement of the imposed heading. A compass accuracy of 0.6˚ was estimated by taking into account the uncertainty of the experimental data and the calibration curve reported in Figure 5.
In a future release of the device a Gyroscope and a dedicated Kalman Filter will be exploited to reduce the
Table 6. Events and candidate messages for the user.
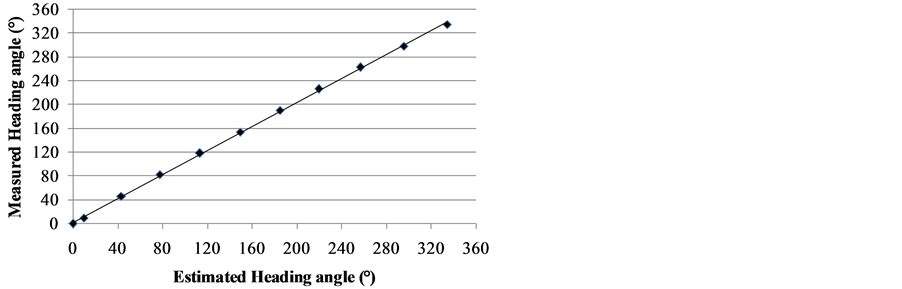
Figure 5. Calibration curve of the compass sensor.
effect of interfering quantities on the estimation of the user’s heading.
Several tests have been also performed to validate the reliability of the user inertial tool and UEC paradigms.
Measurement of the user’s tilt, performed by the HMC6343 sensor and model (1), exhibits an experimentally estimated uncertainty of 1˚. Taking into account the rules presented in Table 4, it can be affirmed that this uncertainty could affect the user’s posture classification only when the user’s tilt falls between two different posture intervals. In such cases the “user posture algorithms” will filter out this estimation and will wait for the next tilt estimation.
As concerns the reliability of the UEC tool, it must be noted that it is intrinsically guaranteed by the strategies used to classify the environmental status and the user inertial status. In fact, estimations of the user’s posture and environmental hazards are based on the implementation of analytical models and comparisons between model outputs and prefixed thresholds. As already addressed in Sections 3 and 4, the user’s posture is discriminated in three classes (erect, bent and lying down), while the user dynamic can be either static or moving and environment hazards could be present or not. This rough way of classifying events is recognized to be poor, limited by the sensors’ accuracy. However, as described above, actions have been performed to cope with specific situations occurring during the estimation of the user’s posture.
Experiments were performed to validate the system functionality by direct measurements with both technical staff and weak users. All the cases presented in Table 6 were reproduced during experiments several times and with different users. Tests were performed taking into account a real possible scenario where the user can assume postures revealing normal or “suspicious” conditions. The results obtained confirm the reliability of the proposed methodology to assess the User-Environment Contextualization.
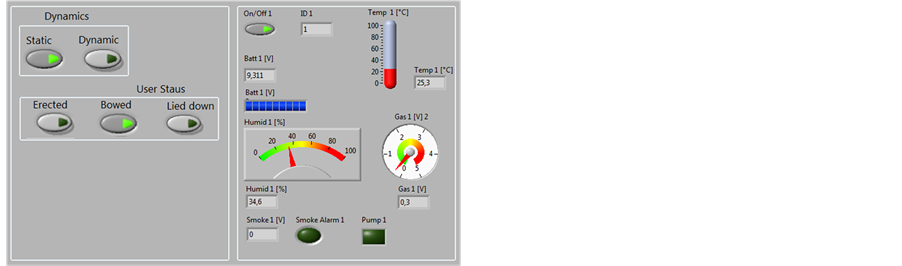
As an example, Figure 6 shows sections of the second and third panels of the GUI described in Section 5. The top left section of the second panel in Figure 6(a) shows the user inertial status while the other section report the environmental status.
The data collected show a seated user in a static condition and no hazards occurring in the environment. This data processed by the UEC tool provides the supervisor with the UEC description shown in the GUI presented in Figure 6(b). Moreover, the UEI tool provides the supervisor with information on the presence of obstacles or services close to the user as well as candidate messages for the user. Although, as already mentioned, the system operation has been tested for the set of foreseen cases shown in Table 6, for convenience other cases are not shown in this paper.
7. Conclusions
In this paper a WSN aimed to assist weak people exploring an indoor environment is described. The system exploits a multi-sensor architecture and dedicated algorithms to monitor the environmental status, and the user’s inertial behavior and position within the environment.
Several tests were performed to assess features of the sensor network, pre-processing algorithms and paradigms implemented in the UEI and UEC tools.
Future developments will address the implementation of a smart feature in the Decision Support System, improvement of the multi-sensor architecture in the user module, and tests in a wide range of real scenarios for the
 (a)
(a)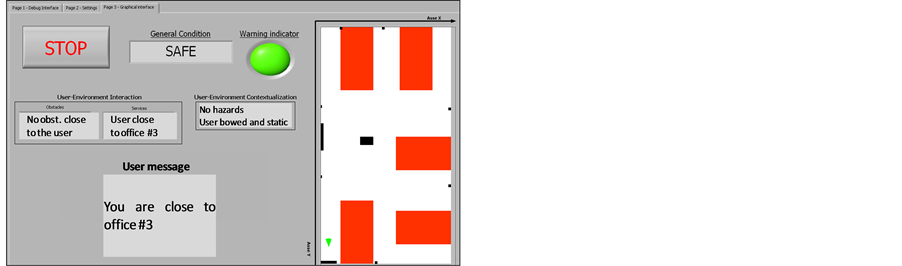 (b)
(b)
Figure 6. The Graphical User Interface. (a) panel for monitoring the environmental status and user inertial behavior; (b) panel for monitoring the user position and information provided by the UEI and UEC tools.
estimation of the system performance based on both supervised and un-supervised trials with end-users.
Although the system developed must be considered as a proof-of-concept of the assistive methodology proposed, future efforts will also be dedicated to the optimization of technical features such as the power budget and the Sensor Network topology.
Acknowledgements
Part of this work was carried out under the project RESIMA of POR-FESR Sicilia 2007-2013 (CUP: G63F11000590004).
References
- Hersh, M. and Johnson, M.A. (Eds.) (2008) Assistive Technology for Visually Impaired and Blind People. Springer, London. http://dx.doi.org/10.1007/978-1-84628-867-8
- Bujacz, M., Baranski, P., Moranski, M., Strumillo, P. and Materka, A. (2008) Remote Mobility and Navigation Aid for the Visually Disabled. Proceedings of the 7th International Conference on Disability, Virtual Reality and Assoc. Technologies with Art Abilitation, Maia, Portugal, 8-11 September 2008, 263-270.
- Velázquez, R. (2010) Wearable Assistive Devices for the Blind. In: Lay-Ekuakille, A. and Mukhopadhyay, S.C., Eds., Wearable and Autonomous Biomedical Devices and Systems for Smart Environment: Issues and Characterization, LNEE 75, Springer, 331-349.
- Farcy, R. and Bellik, Y. (2002) Comparison of Various Interface Modalities for a Locomotion Assistance Device. In: Miesenberger, K., Klaus, J. and Zagler, W., Eds., Computers Helping People with Special Needs, Springer, 421-428.
- Andò, B. and Ascia, A. (2007) Navigation Aids for the Visually Impaired: From Artificial Codification to Natural Sensing. IEEE Magazine on Instrumentation and Measurements, 10, 44-51. http://dx.doi.org/10.1109/MIM.2007.4284258
- Andò, B., Baglio, S., La Malfa, S. and Marletta, V. (2011) Innovative Smart Sensing Solutions for the Visually Impaired. In: Pereira, J., Ed., Handbook of Research on Personal Autonomy Technologies and Disability Informatics, Medical Information Science, Hershey, 60-74.
- Andò, B. and Graziani, S. (2009) Multisensor Strategies to Assist Blind People: A Clear-Path Indicator. IEEE Transactions on Instrumentation and Measurement, 58, 2488-2494. http://dx.doi.org/10.1109/TIM.2009.2014616
- Andò, B. (2008) A Smart Multisensor Approach to Assist Blind People in Specific Urban Navigation Tasks. IEEE Transactions on Neural Systems and Rehabilitation Engineering, 16, 592-594. http://dx.doi.org/10.1109/TNSRE.2008.2003374
- Kay, L. (1974) A Sonar Aid to Enhance Spatial Perception of the Blind: Engineering Design and Evaluation. Radio and Electronic Engineer, 44, 605-627. http://dx.doi.org/10.1049/ree.1974.0148
- GDP Research, Adelaide, Australia. www.gdp-research.com.au
- Villanueva, J. and Farcy, R. (2012) Optical Device Indicating a Safe Free Path to Blind People. IEEE Transactions on Instrumentation and Measurement, 61, 170-177. http://dx.doi.org/10.1109/TIM.2011.2160910
- Scalise, L., Primiani, V.M., Russo, P., Shahu, D., Di Mattia, V., De Leo, A. and Cerri, G. (2012) Experimental Investigation of Electromagnetic Obstacle Detection for Visually Impaired Users: A Comparison with Ultrasonic Sensing. IEEE Transactions on Instrumentation and Measurement, 61, 3047-3057. http://dx.doi.org/10.1109/TIM.2012.2202169
- Gemperle, F., Ota, N. and Siewiorek, D. (2001) Design of a Wearable Tactile Display. Proceedings of the 5th International Symposium on Wearable Computers, Zurich, 5-12. http://dx.doi.org/10.1109/ISWC.2001.962082
- Jones, L., Lockyer, B. and Piateski, E. (2006) Tactile Display and Vibrotactile Pattern Recognition on the Torso. Advanced Robotics, 20, 1359-1374. http://dx.doi.org/10.1163/156855306778960563
- Borenstein, J. (1990) The NavBelt—A Computerized Multi-Sensor Travel Aid for Active Guidance of the Blind. Proceedings of CSUN’s 5th Annual Conference on Technology and Persons with Visual Disabilities, Los Angeles, 21-24 March 1990, 107-116.
- Tsukada, K. and Yasumrua, M. (2004) Activebelt: Belt-Type Wearable Tactile Display for Directional Navigation. Proceedings of UbiComp 2004, Springer, LNCS3205, 384-399.
- Meijer, P. (1992) An Experimental System for Auditory Image Representations. IEEE Transactions on Biomedical Engineering, 39, 112-121. http://dx.doi.org/10.1109/10.121642
- Velazquez, R., Fontaine, E. and Pissaloux, E. (2006) Coding the Environment in Tactile Maps for Real-Time Guidance of the Visually Impaired. Proceedings of IEEE International Symposium on Micro-Nano Mechatronics and Human Science, Nagoya, 5-8 November 2006, 1-6.
- Andò, B. (2006) Sensors That Provide Security for People with Depressed Receptors. Instrumentation & Measurement Magazine, IEEE, 9, 56-61. http://dx.doi.org/10.1109/MIM.2006.1634992
- Shenai, K. and Mukhopadhyay, S. (2008) Cognitive Sensor Networks. Proceedings of the 26th International Conference On Microelectronics (MIEL 2008), NIŠ, Serbia, 11-14 May 2008, 315-320.
- Pauwels, E.J., Salah, A.A., and Tavenard, R. (2007) Sensor Networks for Ambient Intelligence. Proceedings of the IEEE 9th Workshop on Multimedia Signal Process, MMSP’07, Amsterdam, CWI, 1-3 October, 13-16.
- Andò, B., Baglio, S., La Malfa, S. and Marletta, V. (2011) A Sensing Architecture for Mutual User-Environment Awareness Case of Study: A Mobility aid for the Visually Impaired. Sensors Journal, IEEE, 11, 634-640.
- Andò, B., Baglio, S., La Malfa, S., Pistorio, A. and Trigona, C. (2011) A Smart Wireless Sensor Network for AAL. IEEE International Workshop on Measurements and Networking Proceedings (M&N), Anacapri, 10-11 October 2011, 122-125.
- Andò, B., Baglio, S., Lombardo, C.O., Marletta, V., Pergolizzi, E.A. and Pistorio, A. (2013) RESIMA: A New WSN Based Paradigm to Assist Weak People in Indoor Environment. IEEE International Workshop on Measurements and Networking Proceedings (M&N), Napoli, 7-8 October, 206-209.
- (2007) Freescale Semiconductor Application Note, Tilt Sensing Using Accelerometers Sensors, AN3461, Rev. 2, 2-4.
- Haché, G., Lemaire, E.D. and Baddour, N. (2011) Wearable Mobility Monitoring Using a Multimedia Smartphone Platform. IEEE Transactions on Instrumentation and Measurement, 60, 3153-3161. http://dx.doi.org/10.1109/TIM.2011.2122490