Advances in Chemical Engineering and Science
Vol.2 No.1(2012), Article ID:16714,6 pages DOI:10.4236/aces.2012.21004
The Influence of Ceric Oxide on Phase Composition and Activity of Iron Oxide Catalysts
1Department of Chemistry, Kazan Federal University, Kazan, Russia
2Scientifically-Technological Center, OJSC “Nizhnekamskneftekhim”, Nizhnekamsk, Russia
Email: VavilovDI@yandex.ru
Received October 3, 2011; revised November 15, 2011; accepted December 2, 2011
Keywords: Process of Dehydrogenation; Ferric Oxide; Ceric Oxide; Monoferrite and Polyferrite Systems
ABSTRACT
The process of dehydrogenation of methyl butenes to isoprene is conducted in the presence of iron oxide catalysts whose composition may include oxides of alkaline metals, alkaline earth metals, and transition metals. Catalysts of latest generation can also contain oxides of rare earth elements, particularly cerium oxide. However there is no any common opinion concerning its effect on catalytic properties of iron oxide catalysts. It is well known that ceric oxide has a positive effect on the quantity and stability of active centers and can play a critical role in a redox cycle of the dehydrogenation process. By means of differential thermal analysis, dispersion analysis and X-ray phase analysis, it was found in present study that introducing of ceric oxide promotes the decrease in hematite crystallite sizes. At the same time, it prevents potassium polyferrites formation, with the equilibrium of topochemical reaction between ferric oxide and po tassium carbonates moving predominantly to the formation of intermediate products-monoferrite systems, having greater catalytic activity. The increase in potassium monoferrite content results in dispersion of particles in the Fe2O3- K2CO3-СеО2 system that is accompanied by modification of texture characteristics. For this catalyst composition, the optimum concentration of ceric oxide (8.7 wt%), leading to the formation of a certain ratio of monoand polyferrite phases, was found. If more than 8.7 wt% of СеО2 is introduced, the modification of texture characteristics of catalyst samples takes place, that negatively affects their selectivity.
1. Introduction
As known from [1-3], the process of olefin hydrocarbons dehydrogenation is performed in presence of iron oxide catalysts where potassium ferrites are the active components that are formed in the process of solid phase interaction between ferric oxide and potassium compounds. Cerium compound which content varies in the range of 2 to 30 wt% [4,5] is used as a promoter affecting the catalyst activity [6]. Ceric oxide is considered [6] to increase the number of active centers and to influence on their nature. Polyvalent cation (Ce4+) of this metal has sufficient ionic strength intensifying the Fe-O link polarization that leads to increase in the basicity of catalyst surface where dehydrogenation reaction occurs [7]. In accordance with literature [7], cerium presence in catalyst promotes more intensive electron exchange between Fe2+ and Fe3+ ions which present in the polyferrite structure during dehydrogenation, thus preventing their complete recovery to Fe3O4. There is a few data in literature about ceric oxide effect on phase composition formation of iron oxide catalysts [6,8,9].
The objective of this study is to define ceric oxide influence on phase composition, iron oxide catalysts activity and to find out the mechanism of its activity.
2. Experimental
Model systems prepared by mechanical mixing of carbonate with ferric oxide or potassium carbonate, ferric oxide and cerous carbonate of different concentration, as well as catalyst samples obtained by the method of wet mixing of ferric oxide with potassium, magnesium, calcium, molybdenum and cerium salts, were analyzed. Produced mass was molded with hydraulic press into pellets with their subsequent drying-out and annealing on air at given temperatures and time.
For preparation of test samples the following substances were used: commercial potassium carbonate sesquihydrate (first grade), ferric oxide (≥98 wt% of iron in terms of Fe2O3), cerous carbonate (47% total oxides of rare earth elements), magnesium carbonate 3MgCO3∙Mg(OH)2∙3H2O (≥24.5% Mg), calcium carbonate (≥98%), ammonium molybdate tetrahydrate (≥98%).
X-ray phase analysis (XPA) of all samples was performed with a DRON-2 type updated diffractometer (CuKα radiation, graphite monochromator, 2Θ = 5˚ - 60˚, step 0.5˚, 30 kV, 15 mA, exposure time 3 s). Average coherent scattering region (CSR) was determined based on diffraction lines broadening.
Synchronous thermo analyzer CTA-409 PC Luxx (Netzsch, Germany) was used for thermal analysis. Experiments were carried out on air in temperature range of 25˚C to 1100˚C by heating a sample with the rate of 10˚C/min.
Particles size distribution and specific surface were determined with laser microanalyser of particles Analysette –22 (Fritzsch, Germany). The technique applied in laser particles determinant is based on diffraction pattern analysis principle and allows to estimate particles size distribution from 0.1 µm to 500 µm.
The analysis of model systems and catalysts samples for mono ferrite and potassium carbonate content was performed by the method of selective chemical analysis [10]. Relative error of the method for determination of potassium mono ferrite content and potassium carbonate content is 5% - 7% and 10% - 12% correspondingly.
Activity tests in dehydrogenation reaction of methyl butanes to isoprene were performed in laboratory flow type reactor (volume of catalyst charge is 40 cm3) in the range of reaction temperatures of 600˚C to 615˚C at bulk velocity of methyl butenes 1 h–1, under atmospheric pressure, by dilution of raw material with vapor basing on the 1:20 mole ratio C5H10:H2O. Contact gas composition and isoamilene fraction were analyzed by means of chromatography using two gas-liquid chromatographs with thermal conductivity detector.
Composition of light gases (H2, O2, N2, CH4 and CO) was determined in the column filled with NaX molecular sieves, and hydrocarbon mixture and CO2 composition was determined in the column filled with a 30% n-butyric acid triethylene glycol (NBTEG) diatomite-based sorbent (0.16 - 0.25 mm fractions).
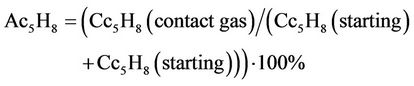
Catalyst activity (Ac5Н8) was classified by isoprene yield to missed methyl butenes calculated according to the following formula:
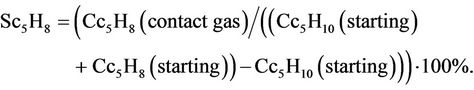
Selectivity on isoprene (Sc5Н8) was characterized on isoprene yield to decomposed isoamylenes calculated according to the formula:
Dehydrogenation products composition measurement accuracy evaluation was made using mathematical statistics methods, developed for small number of definitions (n < 30). Average arithmetic error of five measurements for each component and average squared error of individual measurement were calculated. Relative squared error is ±2%.
3. Results and Discussion
At the first stage of our study the model systems consisting of ferric oxide and potassium and/or cerium salts are examined. By thermal analysis of potassium carbonateferric oxide and potassium carbonate-ferric oxide-ceric oxide systems, heat effects and mass losses caused by salts decomposition, phase transitions and interaction of parent compounds were determined. The results obtained are presented in Figure 1 and Table 1.
Endothermal effects in the range of temperatures up to 200˚C are determined by removal of water physically adsorbed and crystallized from both potassium and cerium salt crystal hydrates. Maximal mass loss in this region is observed for three-component system. Endothermal
 (a)
(a)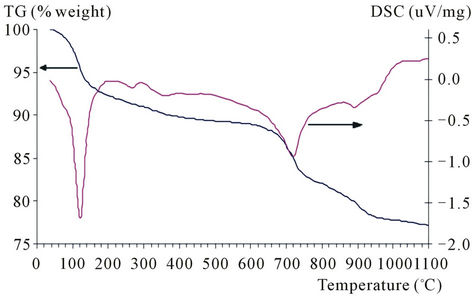 (b)
(b)
Figure 1. TG and DSC curves of model mixtures composed of ferric oxide 80% and potassium carbonate 20% (а), and ferric oxide 70%, potassium carbonate 20% and ceric carbonate 10% (b).
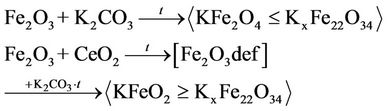
effect in the range of 600˚C to 800˚C found for Fe2O3- K2CO3 and Fe2O3-K2CO3-Ce2(CO3)3 systems is caused by ferrite formation, reactions (1) and (2) [9], as evidenced by the presence of potassium polyferrite diffracted lines with d = 11.90, 5.95, 2.83 Å etc. in roentgenogram of samples annealed at 800˚C.
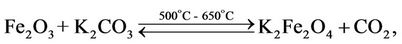 (1)
(1)
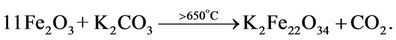 (2)
(2)
All other endothermal effects observed on DSC curve of three-component mixture are related to the following decomposition of Ce2(CO3)3∙5H2O [11]:
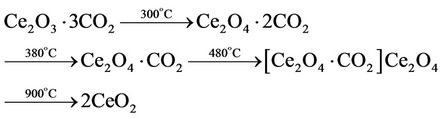 (3)
(3)
If cerous carbonate is introduced, the shift of endothermal effect minimum in temperature range of 600˚C - 800˚C does not practically occur. Maximal mass loss (∆G = 7.0%) in this range is observed for three-component system either due to CO2 removal as a result of a great amount of potassium ferrites formation or due to cerous carbonate decomposition. For confirmation of any version, samples annealed at 800˚C were tested by selective chemical analysis to reveal if free potassium carbonate and potassium mono ferrite presents [10]. It has been found that the Fe2O3-K2CO3 system contains 0.79% of mono ferrite and 0.90% potassium carbonate, and 1.59% and 9.57% correspondingly are contained in the Fe2O3- K2CO3-Ce2(CO3)3 system. Therefore, a noticeable mass loss (∆G = 7.0%) in temperature range of 600˚C - 800˚C for cerium-containing sample is explained by simultaneous processes of potassium mono ferrite formation and cerous carbonate decomposition.
The results obtained by selective chemical analysis indicate that introducing CeO2 to model mixture promotes formation of a great amount of potassium mono ferrite according to the Equation (1).
For determination of polyferrite phase content in systems the XPA method was used. The values of intensity and diffraction line areas relating to K2FexOy and α- Fe2O3 (Table 2) show that the number of porassium polyferrites decreases whereas free hematite content increases as ceric oxide content rises. It should be noted that hematite initial particles size decreases as CeO2 grows from 595 Å to 390 Å. This can be explained by entering of cerium into the crystal lattice of ferric oxide [12], as evidenced by widening of diffraction line with d = 3.67 Å (Table 2), with no solid solution formation. It can be assumed that decreased CSR of hematite is a result of microdeformation due to entering of cerium ions into ferric oxide matrix, that is in well conformity with literary data [12]. Most probably, ceric oxide prevents potassium polyferrites formation, with potassium monoferrites being mainly formed during the topochemical reaction of hematite and potassium carbonate that results from selective chemical analysis and published data [7].
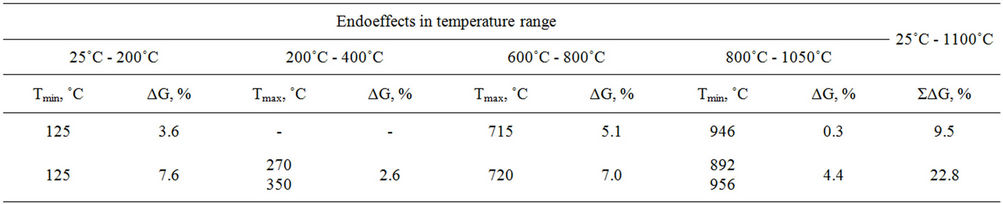
Table 1. Derivatographic analysis data of model mixtures.
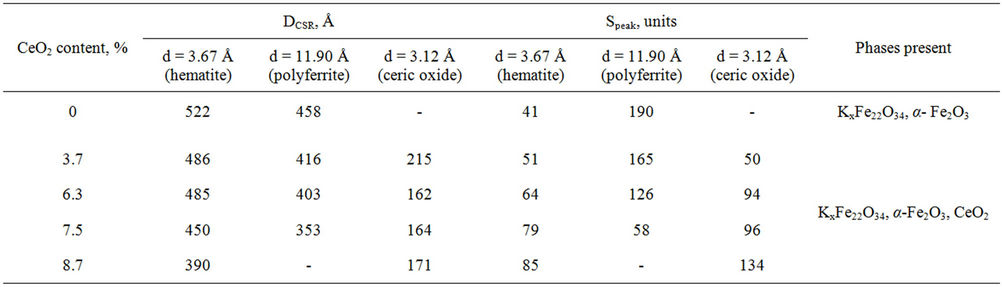
Table 2. Average values of crystallites and diffraction line areas according to XPA data of model mixtures.
Ceric oxide has similar effect on potassium polyferrites. Thus, roentgenogram analysis showed that when ceric oxide concentration grows from 3.7 to 8.7 wt%, the diffracted line of potassium polyferrite 002 moves from d = 11.79 to 12.01 Å. Probably, it might be due to either by introducing Се4+, having greater ion radius compared to Fe3+ (0.87 Å and 0.49 Å correspondingly), into K2FexOy polyferrite matrix to form point defects or ferrites of different structure K2Fe10O16, K2Fe14O22, K2Fe22O34, and others [5,13].
Ceric oxide promotes the decrease in CSR of pure hematite (Table 2) and prevents potassium polyferrite formation.
Basing on the aforesaid, ceric oxide influence on phase composition of iron oxide catalysts can be proposed:
Particle size analysis was used to study ceric oxide effect on particles size distribution and on specific surface of ferric oxide. When ferric oxide is annealed up to 950˚С, the shift of particles size distribution peak occurs to greater values from 0.5 to 0.85 µm because of recrystallization. As a result of introducing ceric oxide (6.7 wt%), a slight increase in particle sizes of the system Fe2O3-CеO2 is observed (Dср = 0.81 µm) in comparison with pure ferric oxide particle sizes (Dср = 0.66 µm).
Particle size analysis of model mixtures containing potassium carbonate, (Figure 2 and Table 3) demonstrated that the Fe2O3-K2CO3 system has monomodal particle size distribution with a peak at 245 µm, a low value of specific area and a high bulk weight (0.40 m2/g and 1.65 cm3/g correspondingly) (Table 3). As a result of topochemical reaction of potassium carbonate with ferric oxide in the absence of CeO2, a primary formation of potassium polyferrites having the average size of crystallites (DCSR = 458 Å), close to hematite average size (ВCSR = 522 Å) probably takes place. When interacted (adhered to each other), these potassium polyferrites facilitate particles agglomeration. In turn, this promotes a significant increase of particle sizes in the Fe2O3-K2CO2 system compared to pure α-Fe2O3 annealed under similar conditions (Table 2).
When ceric oxide is added up to 6.3 wt%, the peak of secondary particles size distribution shifts to smaller values in the region of 245 to 25 µm.
If ceric oxide content is higher than 6.3%, no shift occurs, however the growth if its intensity is observed. Figure 2 shows that fine fraction content increases and particles with sizes of more than 200 µm disappear. Here, the distribution becomes bimodal and the presence of two peaks is observed in the range of 1.4 to 25 µm. The average particles diameter decreases from 195 to 17 µm. As a consequence, the bulk density decreases from 1.56 to 1.22 cm3/g, and specific surface rises from 1.22 to 3.69 m2/g. The observed effect can be explained by the fact that as CeO2 is introduced the polyferrite phase (predominantly monoferrites) formation occurs to a less extent, that results in greater degree of particles dispersion of Fe2O3-K2CO3-Се2(СО3)3 system.
Most probably, introducing ceric oxide into model systems promotes the formation of less crystallized ferric
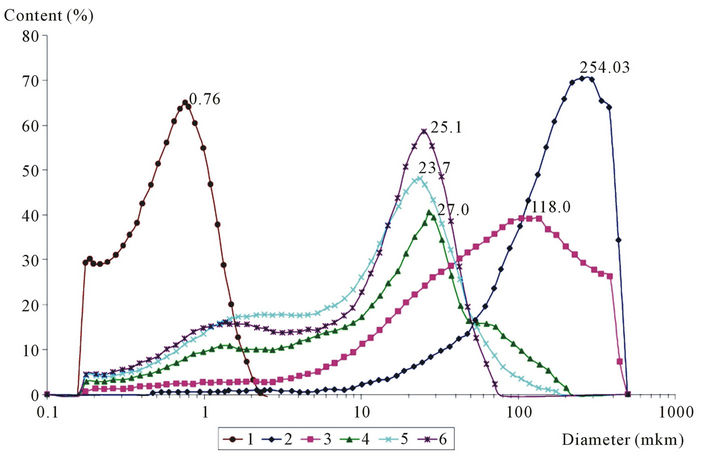
Figure 2. Curves of particle size distribution of ferric oxide (1) and mixtures containing potassium carbonate and СеО2 in the amount of (2) 0 wt%; (3) 3.7 wt%; (4) 6.3 wt%; (5) 7.5 wt%; (6) 8.7 wt%, annealed at 750˚С.
oxide as evidenced by its CSR decreased from 522 to 390 Å, stipulating the formation of predominantly finedispersed potassium monoferrite. In accordance with literary data [7], catalyst activity grows as monoferrite phase content increases. It can be assumed that the increase in ceric oxide concentration in ferric oxide catalyst will affect its performance characteristics.
For confirmation of this assumption, catalyst samples with the similar Fe2O3/K2CO3 ratio and different ceric oxide content (from 6.3 to 12 wt%) were prepared.
XPA results obtained for test samples are listed in Table 4. It can be seen that all alterations of phase composition observed on model systems take place also for test catalyst samples. Thus, when ceric oxide content grows the formation of polyferrite phase decreases, the content of both free ferric oxide and potassium monoferrite increases, as evidenced by the values of diffracted line areas of these phases (Table 4) and by the results of selective chemical analysis (Table 5).
Optimum cerium content (8.7 wt%) in catalyst samples with given formulation was found, where catalytic indexes have extreme values (46.3% and 89.8%). The increase in cerium concentration results in hematite content growth according to XPA data (Table 4), that leads to decreased selectivity of catalyst samples from 90% to 87%. As reaction selectivity depends on catalyst porous structure [14], it can be assumed that further increase in ceric oxide content the noticeable sample texture modification occurs.
As Table 5 shows, if ceric oxide concentration increases the activity of catalyst samples rises, that can be associated with the increase in potassium monoferrite content. This is evidenced by correlation of KFeO2 concentration with catalyst activity.
4. Conclusions
Model systems with different ceric oxide content were analyzed by means of differential thermal analysis, particle size analysis, and X-ray phase analysis. It was shown, that introducing of ceric oxide promotes the decrease in hematite CSR. It was found that in case of Fe2O3-K2CO2 system the predominant formation of potassium polyferrites is observed, by introducing CeO2 from 3.7 to 8.7 wt% the content of potassium monoferrites rises along with K2FexOy formation, that leads to particle dispersion from Dcp = 195.4 µm (0 wt% CeO2) up to 16.8 µm (8.7% CeO2). According to XPA data obtained for catalyst samples, a regular relationships typical for model systems are observed. Introducing of ceric oxide leads to increased content of the active phase-potassium monoferrite, stipulating catalytic activity growth. The optimal ceric oxide content of 8.7 wt% was found.
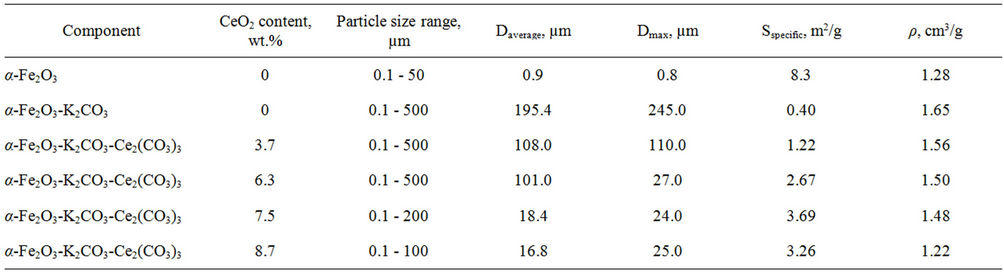
Table 3. Particle size composition, specific surface and bulk weight of model samples.

Table 4. Average values of crystallites and diffraction lines area according to XPA data of catalyst samples with various ceric oxide content annealed at 750˚C during 3 hours.
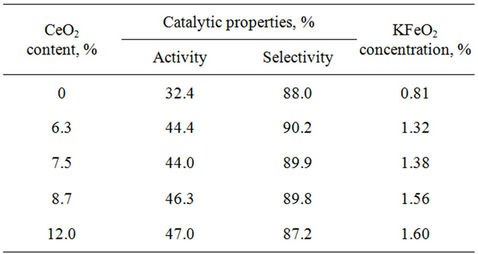
Table 5. Catalytic properties of catalyst samples with various ceric oxide content as a function of potassium monoferrite concentration.
5. Acknowledgements
The authors acknowledge funding support from the Ministry of Education and Science of Russian Federation.
REFERENCES
- N. V. Dvoretsky, E. G. Stepanov, G. R. Kotelnikova and V. V. Yun, “Formation Catalystically Active Ferrite of Potassium,” Chemical Fundamentals of Catalysts Formation: Interuniversity Collected Scientific Papers, Kinetics and Catalysis Affairs, Ivanovo, 1988.
- T. Hirano, “Active Phase in Potassium-Promoted Iron Oxide Catalyst for Dehydrogenation of Ethylbenzene,” Applied Catalysis, Vol. 26, 1986, pp. 81-90. doi:10.1016/S0166-9834(00)82543-9
- I. Serafin, A. Kotarba, M. Grzywa and Z. Sojka, “Quenching of Potassium Loss from Styrene Catalyst: Effect of Cr Doping on Stabilization of the K2Fe22O34 Active Phase,” Journal of Catalysis, Vol. 239, No. 1, 2006, pp. 137-144. doi:10.1016/j.jcat.2006.01.026
- V. M. Busygin, H. H. Gilmanov and S. V. Trifonov, “Catalyst for Dehydrogenation of Olefin and Alkylaromatic Hydrocarbons,” RF Patent No. 226675, 2004.
- M. Baier, O. Hofstadt, W. J. Pöpel and H. Petersen, “Catalyst for Dehydrogenating Ethylbenzene to Produce Styrene,” US Patent No. 6551958, 2003.
- N. Dulamita and A. Maicaneanu, “Ethylbenzene Dehydrogenation on Fe2O3-Cr2O3-K2CO3 Catalysts Promoted with Transitional Metal Oxides,” Applied Catalysis A: General, Vol. 287, No. 1, 2005, pp. 9-18. doi:10.1016/j.apcata.2005.02.037
- E. G. Stepanov, “Scientific Basics of Disintegrational Technology of Manufacturing Fresh Catalysts and Processing of Deactivated Catalysts of Petrochemical Processes,” Dr. Thesis, Yaroslavl State Technical University, Yaroslavl, 2005.
- A. Trovarelli, C. Leitenburg, M. Boaro and G. Dolcetti, “The Utilization of Ceria in Industrial Catalysis,” Catalysis Today, Vol. 50, No. 2, 1999, pp. 353-367. doi:10.1016/S0920-5861(98)00515-X
- J. Surman, D. Majda, A. Rafalska-Lasocha, P. Kustrowski, L. Chmielarz and R. Dziembaj, “Potassium Ferrites Formation in Promoted Hematite Catalysts for Dehydrogenation. Thermal and Structural Analyses,” Journal of Thermal Analysis and Calorimetry, Vol. 65, No. 2, 2001, pp. 445-450. doi:10.1023/A:1017920802391
- T. G. Zhdanova, R. A. Kuznetsova, A. S. Okuneva and N. K. Loginova, “Separate Identification of Potassium Compaunds in Iron-Chrompotassium Catalyst,” Promyshlennost SK (Synthetic Rubber Industry), No. 3, 1986, pp. 5-8.
- A. I. Leonov, “High Temperature Chemistry of Cerium Oxygen Compounds,” Leningrad, 1969.
- N. C. Pramanic, T. I. Bhuiyan, M. Nakaniahi, T. Fujii, J. Takada and S. I. Seok, “Synthesis and Characterization of Cerium Substituted Hematite by Sol-Gel Method,” Materials Letters, Vol. 59, No. 28, 2005, pp. 3783-3787. doi:10.1016/j.matlet.2005.06.056
- H. H. Gilmanov, A. A. Lamberov, E. V. Dementyeva, E. V. Shatochina, A. M. Gubaidullina and A. V. Ivanova, “Influence of Conditions of Heat Treatment on Formation Polyferrite Phases of Iron-Potassium Catalyst of Dehydrogenation,” Neorganicheskie Materialy (Inorganic materials), Vol. 44, No. 1, 2008, pp. 9-15.
- G. K. Boreskov, “Heterogeneous Catalysis,” Мoscow, 1988.