Journal of Transportation Technologies
Vol.05 No.01(2015), Article ID:53486,8 pages
10.4236/jtts.2015.51004
Arequipa’s Population Perception in Regard to the Infrastructure of the Avenues Venezuela and Daniel Alcides Carrión
Yampier F. Ramos Polanco
Universidad Católica San Pablo, Arequipa, Perú
Email: yampier.ramos@gmail.com
Copyright © 2015 by author and Scientific Research Publishing Inc.
This work is licensed under the Creative Commons Attribution International License (CC BY).
http://creativecommons.org/licenses/by/4.0/


Received 2 January 2015; accepted 18 January 2015; published 23 January 2015
ABSTRACT
The present study corresponds to a descriptive research, whose objective seeks to determine the level of satisfaction of the population of Arequipa city, in respect of public works infrastructure executed in the Avenues Venezuela and Daniel Alcides Carrion. We designed a survey questionnaire which was applied to 384 people randomly for convenience, in the areas surrounding the road interchange. The results showed that a 65.10% believed that the infrastructure works had a positive impact, in addition to a 52.86% and 7.29% of people who were satisfied and very satisfied respectively, with the vial exchange carried out in the Avenues Venezuela and Daniel Alcides Carrion.
Keywords:
Public Works, Infrastructure Works, Vial Exchange, Satisfaction, Population

1. Introduction
In the last ten years, Peru has had a sustainable growth in its economy. This is due to economic policies determined by the government, in addition to the momentum and promoting of the private investment. But Arequipa is not an alien to this growth; during the 2013 Arequipa posted growth in Gross Domestic Product of 6% [1] , quantity above the national average.
This growth is also reflected in the increment of the population [2] , at the end of the 1990s and 2000, appeared in Peru a social aspect called centralism1. This is why the government applied a strategy for decentralization, which entailed and generated a regional centralism in the major cities of Peru, Arequipa and Trujillo, that now represent important economic growth. Nowadays Arequipa receives immigrants from different parts from the south of Peru, like Tacna, Moquegua, Cusco and Puno; being approximately one million habitants as we can see in Table 1, becoming the region with the highest number of habitants after Lima and Callao.
Arequipa increases their economic growth thanks to the development of different sectors such as mining,

Table 1. Projected population to June 2013.
Source: INEI National Institute of Statistics and Informatics.
trade, construction, and services which promote employment generation, economic stability and improvement in the quality of life. Because of this, many citizens took advantage of this “economic boom” to invest in capital good, buying homes, cars, etc. This created serious problems due to the increase of the automotive park [3] (Table 2). The Regional Government and the District Governments had to take the initiative to redesign and rebuild many main roads, to facilitate and decrease the traffic congestion that was reflected by these problems [4] .
One of the main roads is the vial exchange of the avenues Venezuela and Daniel Alcides Carreon, which are parts of the first road ring in the structure of the Master Plan of Metropolitan Arequipa. This is because both avenues will become a quick way to achieve a fluidity in the vehicular transport and particular mass urban. This vial exchange is located in the Arequipa City, in the following coordinates (16˚24'44.1"S, 71˚32'07.3"W) as shown in Figure 1.
Venezuela avenue is part of the first ring in the structure of the Master Plan of Metropolitan Arequipa [5] ; along it there are already 4 exchanges vials, the same that were built in different periods, and therefore were not planned on a holistic basis. These avenues should already be on the fast track to achieve a fluidity in the vehicular
Table 2. Increase in the automotive fleet by departments in units.
Source: MTC Ministry of Transport and Communications.
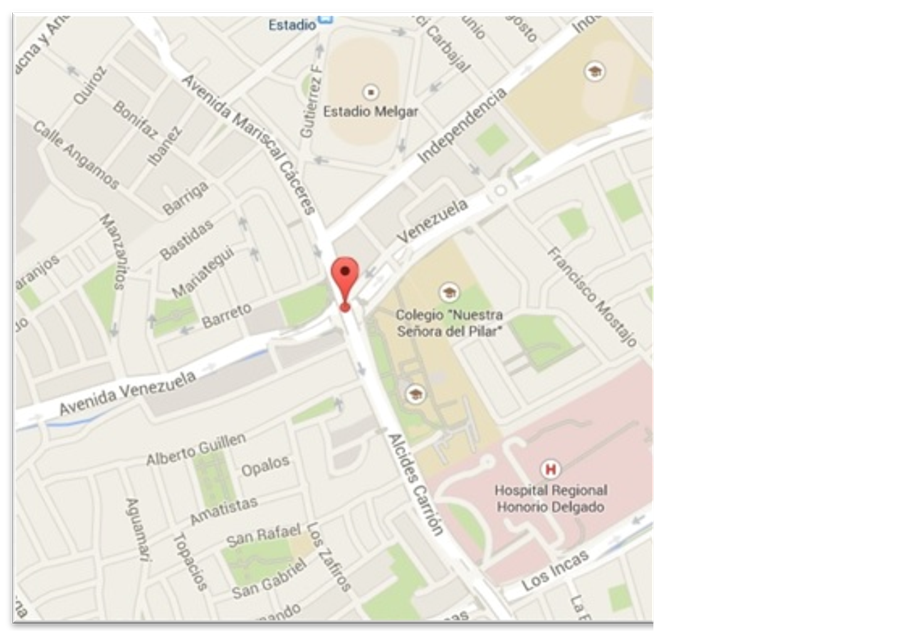 Source: Google Maps
Figure 1. Location Avenues Venezuela and Daniel Alcides Carrion-Satellite Map.
transport and particular mass urban. The oldest one of these exchanges is the av. Venezuela―av. Alcides Carrion, subject of this study and where the “Arequipa Bus” will circulate, along the corridor exclusive of transport.
Venezuela avenue is part of the first ring in the structure of the Master Plan of Metropolitan Arequipa 2002-2015. The sharing road is called “Palomar”. The exchange Palomar was designed in anticipation that the Av. Venezuela becomes, in the future, on a fast track (“zanjón”). It has three levels: an underpass crossing, a bridge―roundabout at the ground level―and another bridge at high altitude for the Exclusive Broker. The work in av. Alcides Carrion―Venezuela is valued at approximately 17 million 347 thousand soles. The municipal authority announced that the three road interchanges would require four months; however, only El Palomar, according to initial studies, would require up to 7 months for its execution.
This research seeks to analyse the perception of the population of the city of Arequipa with respect to the infrastructure works to study, by determining the level of satisfaction of the population as a percentage.
2. Methodology
2.1. Sample
For the calculation of the sample, it was considered as population the number of units of the fleet in the city of Arequipa to the year 20132, obtaining the sample of 384 persons, who were elected by non-probabilistic methods for convenience. Subsequently we proceeded to identify the person to survey based on the following standards:
a) Admit only people between 18 and more years, because the questions need to be answered in a mature way and consciously.
b) Identify places with high turnout of people and that are surrounding the Road Exchange.
c) Make an affixation of the sample proportional to the size of the total population.
d) Random distribution for convenience of the places to survey.
We surveyed a total of 384 people, with ages ranging from 18 to 65 years, of both sexes who live in the city of Arequipa and pass through the interchange road.
2.2. Instrument
We made a questionnaire survey, which collects data such as the frequency of transit and-or usage, number of time and to figure out why they use the exchange vial by determining a relation of alternatives:
a) Work
b) Recreation
c) School of their children
d) Visit a relative/friend
e) University/Studies
f) Procedures
g) Health centers/Clinics
h) Shopping/Go to a mall
i) Way of daily use
j) Others
In addition to determine the level of satisfaction with population, questions were developed using a Likert- type scale, taking as response options on the level of satisfaction:
a) Very dissatisfied
b) Dissatisfied
c) Indifferent
d) Satisfied
e) Very satisfied
As the same time, the questionnaire collected data from control as the sex and age of the participants.
2.3. Procedure
The process of data collection began with the election of the places and time of interviews, by determining the following places, for convenience:
a) Market: “El Palomar”
b) Shopping center “ParqueLambramani”
c) Shopping center “Mall Aventura Plaza”
d) National San Agustí University
e) Hospital: Honorio Delgado
f) Health center Daniel Alcides Carrión
g) Av. Salaverry, Instituto del Sur
These locations were selected in order to the following standards:
a) Place with high traffic of people and vehicles
b) Due to its location, surrounding and close to the Road Exchange.
c) Because they are public places where you can do the surveys without any problem or inconvenience.
Also an schedule for the interviews was determined considering the hours of highest traffic of people and vehicles, 7:00 am - 9:00 am and 4:00 pm - 7:00 pm. The implementation of the survey was conducted during the month of February of 2014 and lasted approximately 5 minutes and was conducted by 5 staff, trained in interviews and data collection. When the stage of gathering information was completed, the information was processed in the SPSS statistical software, to obtain the results.
3. Results
We surveyed 384 people between the ages of 18 and 65 years, of which 185 are female, representing a 48.2% and 199 are male representing a 51.8%, all of them citizens of Arequipa which often pass through the exchange of the avenues Venezuela and Daniel Alcides Carrión. The frequency of transit and/or use of this exchange vial is quite high as you can see in Figure 2 and Figure 3, a 47.66% of the population passes between 1 to 5 times, from Monday to Friday, while a 64.06% on the weekends.
In order to the reason for which people pass through the interchange road, we can observe that the most salient
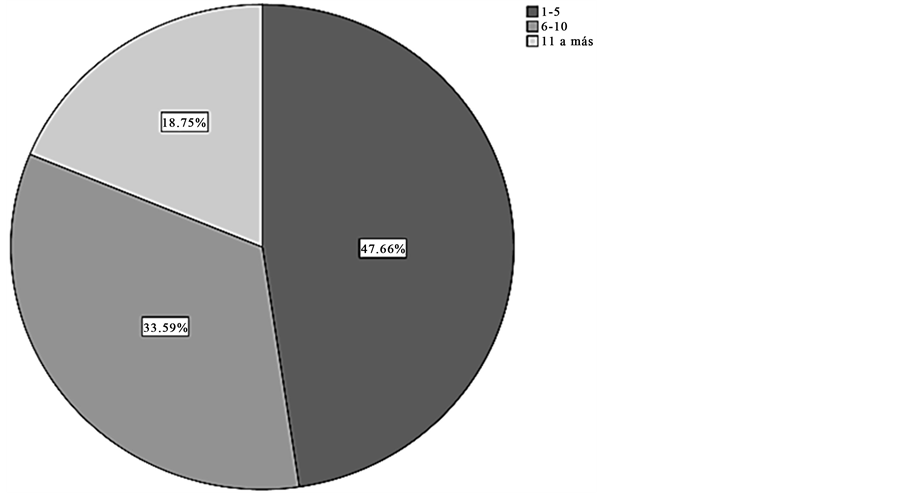
Figure 2. Frequency of transit of persons from Monday to Friday; How often transits the road interchange, Monday to Friday?
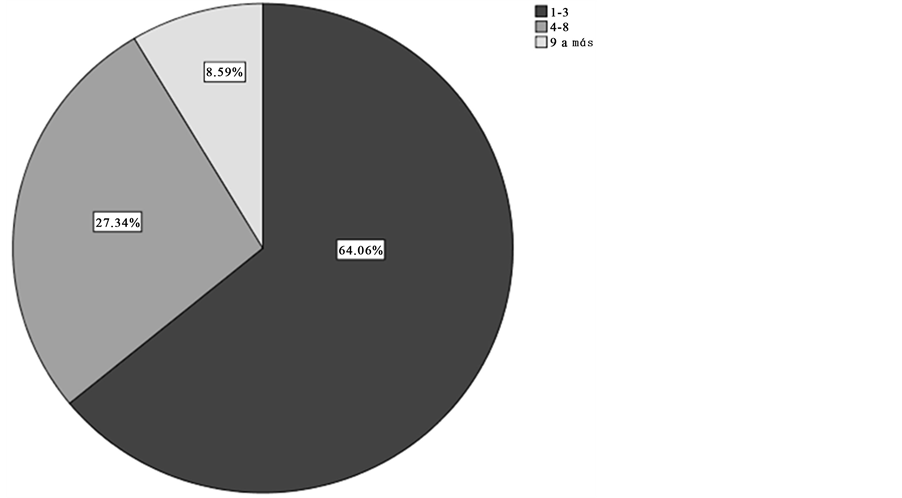
Figure 3. Frequency of transit of persons on weekends; How often transits the road interchange, Saturday and Sunday?
and important are: working with a 27.20%, followed by commercial centers 19%, universities or research centers 12.6% and medical centers 8.5% (Figure 4).
The perception of the population regarding to the impact of these public works infrastructure in their quality of life, the 65.10% believes that the impact is positive, while only the 14.06% thinks that it is a bad thing, on the other hand a 20.83% is indifferent to the impact or influence generated by this vial exchange (Figure 5). Another significant result is the impact on travel times using this fast track, where a significant 69.27% responded that this fast track reduce traveling time from one place to another, on the other hand a 12.76% said that the time has
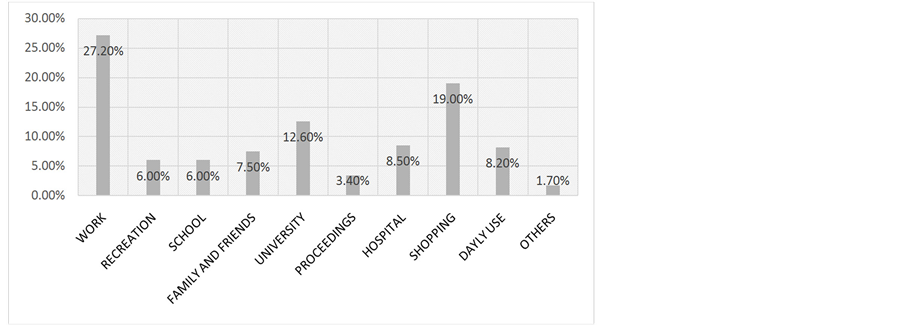
Figure 4. Reasons for using the exchange vial.
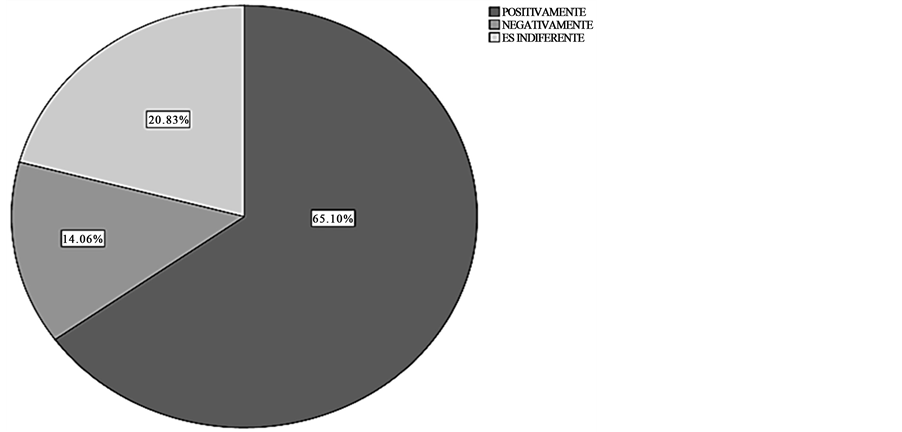
Figure 5. Impact on the quality of life of the exchange vial; How do affects the vial interchange at quality of life?
increase and 17.97% of the remaining population believes that the travel times remained the same (Figure 6).
As the most important result and giving response to the objectives of this study, we discovered that the perception of the population of the city of Arequipa regarding to public works in the exchange vial executed in the avenues Daniel Alcides Carrion and Venezuela is the following: the 52.86% is satisfied and 7.28% felt very satisfied with this infrastructure work. However the is a percentage which is very dissatisfied and unhappy as you can see in Figure 7.
In addition to the descriptive processing, we did a correlational analysis using the test of Kendall Tau-b. The results show that there is a strong correlation between people who frequently travel through the exchange road from Monday to Friday with the people passing on weekends; we can say that they live nearby. Another interesting result that present the study talks about travel times in connection with the satisfaction and subsequent recommendation to use the interchange road, because with lees time for transfer, higher degree of satisfaction, presenting a correlation of r = −5.24 and with less time for transfer, greater recommendation of the service, with a correlation of r = −0.431. Both results are significant and offer moderate inverse correlations. We can also say that to a greater degree of satisfaction, grater recommendation and when the traffic follow is better, the transfer time decrease, having a correlation of r = −0.454. To conclude we can say, in order to the results presented, that the degree of satisfaction and the potential recommendation to use the vial exchange are related to several factors, mainly on the fluidity of the traffic and the time to transfer. See Table 3.
4. Discussion
Arequipa is a city with great economic growth, above the average country; however this growth is mainly driven by the private sector. We can see more shopping centers, businesses, factories, industries and mines in the region, which generate employment generating an economic cycle. But this economic growth is not supported by the public sector; we do not have the infrastructure or the support of airports, terminals, ports, roads and avenues to support and collaborate with this economic growth. Therefore we can conclude that while it is true Arequipa is having an economic growth; we are still far from being able to talk about social development.
By observation we can see that the perception of the population in relation to a public works is always negative, before and during the execution of the project, but the results of this study show that once a project is completed, the perception of citizenship is good, demonstrating satisfaction levels quiet high. In conclusion we can say that it is important to invest in access roads to the city of Arequipa and thus contribute to the growth
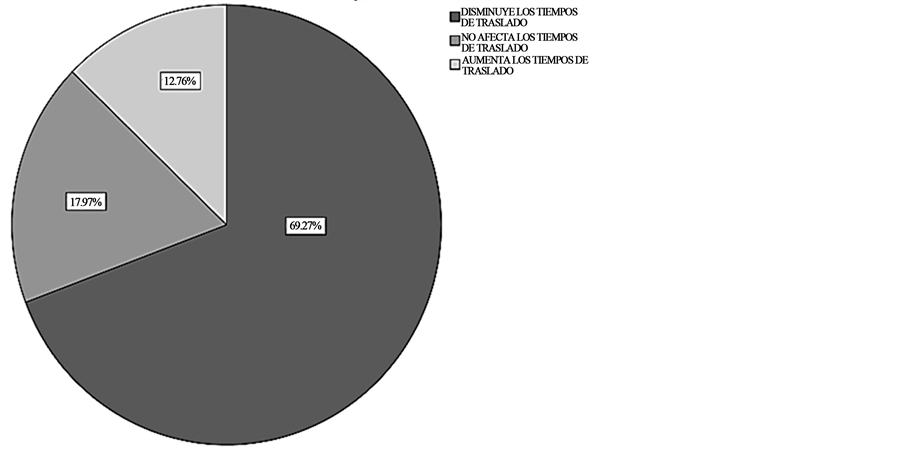
Figure 6. Impact on the travel times of vial exchange; How do affects the vial interchange at travel time?
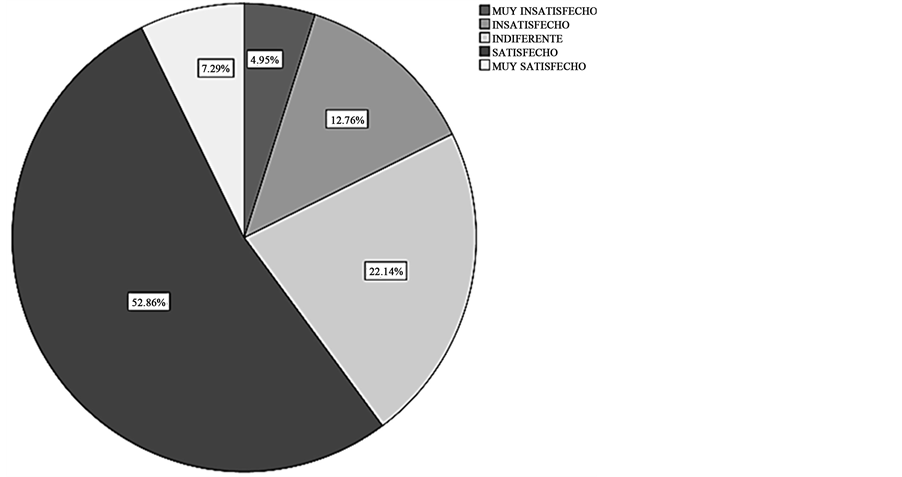
Figure 7. Degree of satisfaction in percentages.
Table 3. Correlational analysis.
*p < 0.05; **p > 0.01.
[1] Central Reserve Bank of Peru (2013) Report on Economic Growth. www.bcrp.gob.pe
[2] National Institute of Statistics and Informatics (2013) Population of Arequipa City. http://www.inei.gob.pe/media/MenuRecursivo/Cap19022.xls
[3] National Institute of Statistics and Informatics (2013) Population and Vehicle Fleet of Arequipa City. http://www.inei.gob.pe/estadisticas/indice-tematico/economia/
[4] Ministry of Health (2013) Population of Arequipa City according Districts. http://www.minsa.gob.pe/estadisticas/estadisticas/poblacion/poblacionmarcos.asp?04
[5] Provincial Municipality of Arequipa (2013) Project Profile. http://www.muniarequipa.gob.pe
NOTES

1Centralism in Peru: economic activity concentrated in the capital Lima.

2Presupuesto, M. d.-O. (s.f.). Ministerio de Transportes y Comunicaciones. Obtenido de www.mtc.gob.pe
.