Journal of Transportation Technologies
Vol.3 No.1(2013), Article ID:27023,5 pages DOI:10.4236/jtts.2013.31004
Using OD Estimation Techniques to Determine Freight Factors in a Medium Sized Community
1Department of Civil and Environmental Engineering, University of Alabama in Huntsville, Huntsville, USA
2Center for Management and Economic Research, University of Alabama in Huntsville, Huntsville, USA
Email: andersmd@uah.edu
Received November 14, 2012; revised December 15, 2012; accepted December 25, 2012
Keywords: Freight Modeling; Origin/Destination Estimating
ABSTRACT
Developing an understanding of the socio-economic factors that can be used to generate truck trip productions and attractions in small and medium sized communities can be used to improve travel models and provide better information upon which infrastructure decisions are made. Unfortunately, it is difficult to collect this data in a timely, cost-effective manner. This paper presents a methodology that uses matrix estimation techniques from existing traffic counts to develop origin/destination pairs that can be used to statistically develop truck trip generation models. A case study is presented and a model is presented for one smaller urban community.
1. Introduction
Freight transportation has become an increasingly important issue for small and medium sized communities [1-3]. Understanding which factors influence truck productions and attractions, and the magnitude of the influence within the modeling environment, could improve the accuracy of the models and potentially lead to better decisions regarding transportation infrastructure investment. These factors, if understood, could be developed into a truck trip generation model similar to other models that have been proposed [3], but developed for a local area. Unfortunately, it is difficult to directly measure and identify those factors that specifically predict truck volumes. Surveying individual companies provides a detailed view but lacks the transferability to the entire region and large scale cordon-line studies are expensive and impractical to perform. Thus, a new methodology to develop a truck trip generation equation would potentially be beneficial to transportation planners in smaller urban communities.
An alternative method to determine the number of trucks produced or attracted to locations within a smaller community is proposed in this paper. The method proposed uses existing truck traffic counts on a network and then working backwards to determine the origin/destination matrix that could have produced the specific counts observed. The method is presented in a paper by Van Zuylen and Willumsen where the origin/destination matrix estimation procedure was tested on a sample network and determined to produce accurate results [4]. The method is outlined in the text by Ortuzar and Willumsen, and demonstrates how there are a limited number of trip matrices that can be used to replicate the traffic volumes [5]. Once the origin/destination pattern is identified, the total quantity of trucks exiting and entering the zones can be used as actually production and attraction values. A regression analysis can be performed to understand the contributions of the socio-economic data within the zone and a prediction model for truck trip generation developed.
The methodology is used to determine the origin/destination pairs that would likely use the roadways upon which the count was collected. If a roadway indicates truck volume, it is assumed that the volume is developed from the origin/destination pairs that have that roadway along the shortest path, as it is unlikely that a truck would intentionally take a longer path through the network. The use of multiple roadways within the study area allow for distribution of truck traffic to alternate origin/ destination pairs until all the roadways are used and a final potential solution is reached. The final potential solution is used as the input instead of basic initialization beginning principle and another complete run of the roadways is performed. Iterative runs are performed until the difference between iterations reaches a desired level of closure and the most likely origin/destination matrix is obtained.
In this paper, an approach to determine the factors that contribute to truck generation models for a medium-sized community through the use of an origin/destination matrix estimation technique requiring existing truck traffic counts as the input is used. The paper discusses the application of the methodology to convert the truck counts into an origin/destination matrix for a case study community and then applies statistical techniques to determine the appropriate factors for truck trip generation using the number of truck produced and attracted to areas of the network and the corresponding socio-economic data for those areas. The contribution of the paper is the application of the methodology and a model that potentially can be utilized by other communities.
2. Methodology and Case Study
The focus of this paper is the development of a methodology capable of extracting an origin/destination matrix from a set of existing traffic counts; then, develop a statistical relationship to determine the trip production and attraction values for trucks in a small or medium sized community. The location for the case study was Mobile, AL, a medium sized community of approximately 300,000 people. This location was ideal as the Alabama Department of Transportation had recently conducted a set of manual truck counts at 42 locations within the Mobile area to be used for validating a freight model.
A methodology was developed to develop the estimated origin/destination matrix using traffic counts was developed to support the work and is shown in Figure 1.
The application of the methodology utilized CUBE/ TRANPLAN (Citilabs Corp.) to develop the origin/destination pairs that would use the roadway in question and
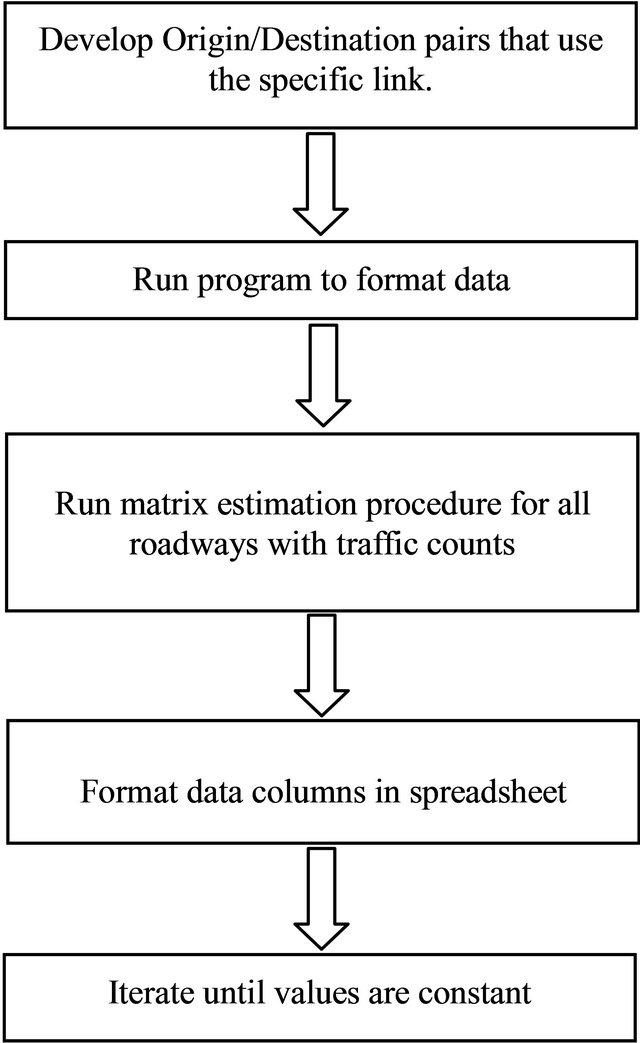
Figure 1. Flowchart of methodology.
EXCEL (MicroSoft Corp.) to run the matrix estimation technique. The approach used to create the EXCEL file to perform the analysis is as follows:
1a. Locate all the roadways in the Mobile CUBE/ TRANPLAN network that had a truck count conducted. This information was recorded to ensure all the roadways were properly used.
2a. Perform a Select Link Analysis within CUBE/ TRANPLAN for a roadway location corresponding to the truck count.
3a. Perform a Build Selected Link Trip Table within CUBE/TRANPLAN using the selected link to identify the specific origin/destination pairs that had that links along the shortest path.
4a. Export the trip table for the selected link for use outside of CUBE/TRANPLAN.
5a. Run a FORTRAN program that was developed by the authors to format the data for later use.
6a. Copy the data output from the FORTRAN program into EXCEL. The data entered into EXCEL included all of the origin/destination pairs available within the model, however, the formatting was such that pairs that used the roadway on the shortest path were coded with a 1 and those not on the shortest path were coded with a 0.
7a. Repeat Steps 2 - 6 until all roadways where a truck count was available were used.
To execute the matrix estimation in EXCEL the following steps were taken:
1b. Develop a column of all possible origin/destination pairs in the community.
2b. Add a column with a value of 1 for all possible origin/destination pairs to serve as an initializing value.
3b. Add a column from the previous set of steps that has the truck count for a link, and the 1 or 0 representing the origin/destination pairs likely to use that roadway.
4b. Divide the total truck count by the total number of pairs using the roadway and distribute all the traffic evenly to these origin/destination pairs.
5b. Add a column from the previous set of steps that has the truck count for the next link and the 1 or 0 representing the origin/destination pairs likely to use the next roadway.
6b. Sum the total expected traffic, either a value from step 4 or a 1 and divide the total truck count by the total usage on the roadway and distribute all the traffic evenly to these origin/destination pairs.
7b. Repeat Steps 5b - 6b until all of the roadways are used. This will give an initial solution.
8b. Repeat Steps 2b - 7b until reaching closure. Observing the difference that the initial solution developed in Step7b will serve as the initial value used in Step 2b. This will allow for the first potential solution to serve as an input to next iteration as opposed to starting over. Additionally, Steps 3b - 4b are unnecessary as they will also cause the knowledge gained from the previous iteration to be lost.
The steps presented were used in the case study with Mobile, AL using 42 truck count locations (Figure 2) and the Mobile CUBE/TRANPLAN network (Figure 3). The Selected Link Analysis and Build Selected Link Trip Table modules were executed and the shortest paths between origin/destination pairs were identified. As the truck counts used to build the origin/destination matrix contained internal, internal/external and pass-through trips, the origin/destination matrix contained all internal zones and zones representing external stations. These values were entered in EXCEL as directed and a total of fifty complete iterations, each one using all the truck count locations, were performed to ensure that a final solution was reached. To verify that the iterations reached a converging solution; the percent change in the total trips between iterations was tracked. Between iteration 49 and iteration 50, less than 0.01 percent change occurred in the total number of trips assigned in the network. A graph showing the change in total trips for each iteration is shown in Figure 4.
The final results contained the total number of trips expected between each origin/destination pair in the model. Thus, the matrix estimation technique was capable of taking the 42 truck count locations and developing a single origin/destination matrix that, when assigned to the network, would result in the counts collected. The final step in the process was to aggregate all the volume for each origin and use that value as the production for the zone and all of the volume for each destination and use that as the attraction for the zone. This process therefore was capable of identifying the number of trucks produced and attracted to zones within the community without direct sampling of businesses in the zone and using a cordon line to capture trucks crossing into and out of a zone.
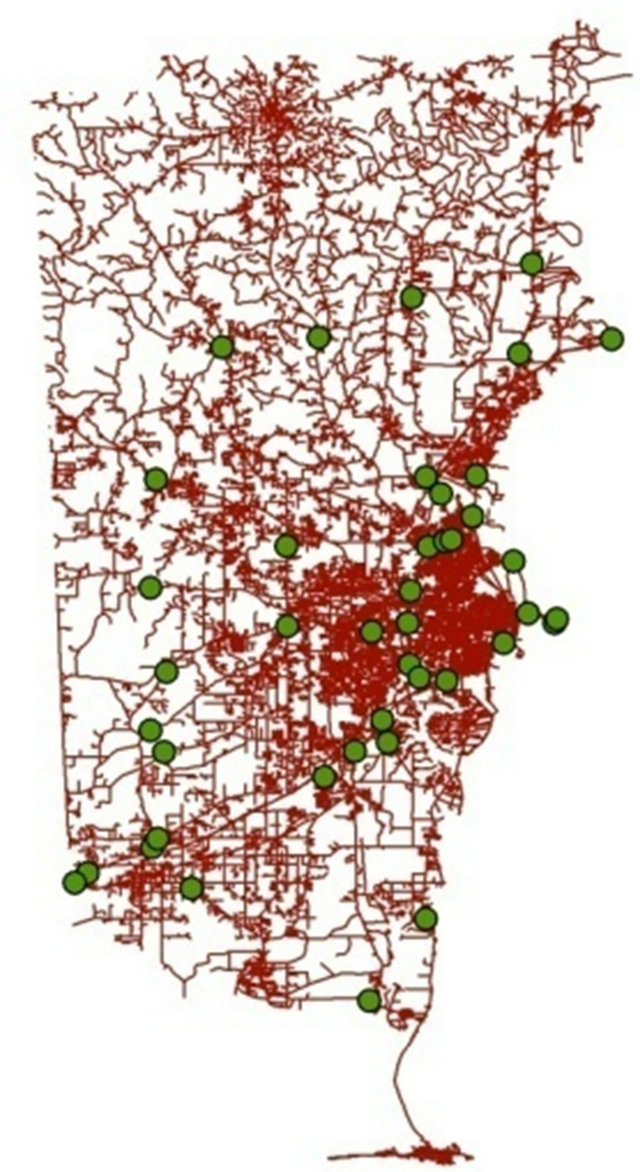
Figure 2. Map of mobile county showing truck count locations.
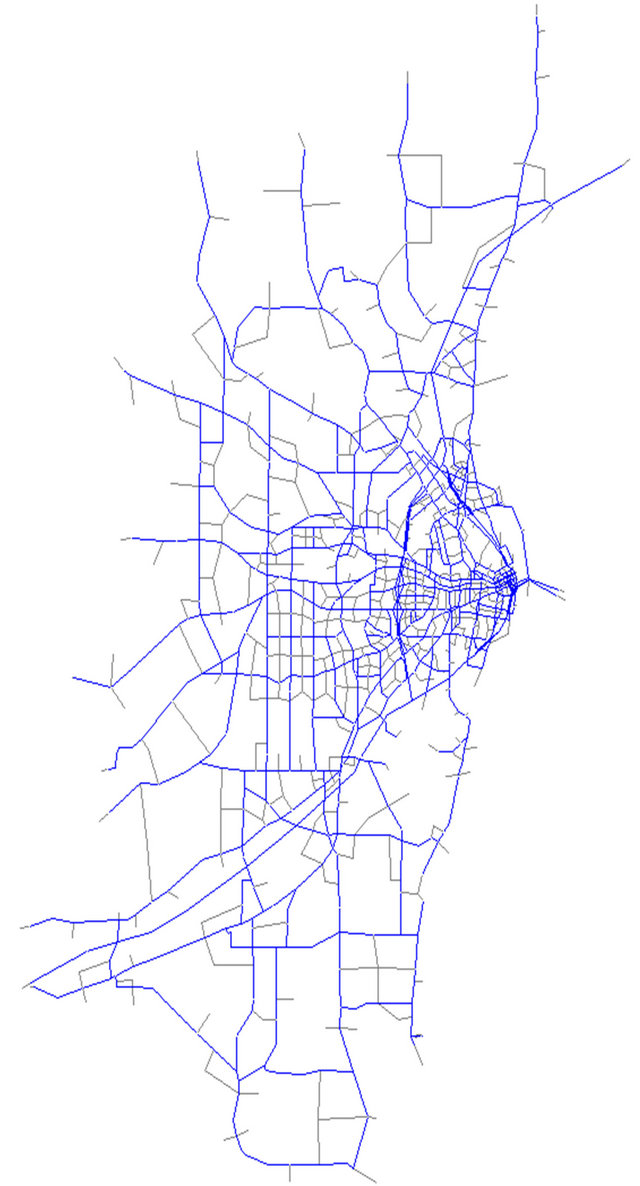
Figure 3. Mobile CUBE/TRANPLAN network.
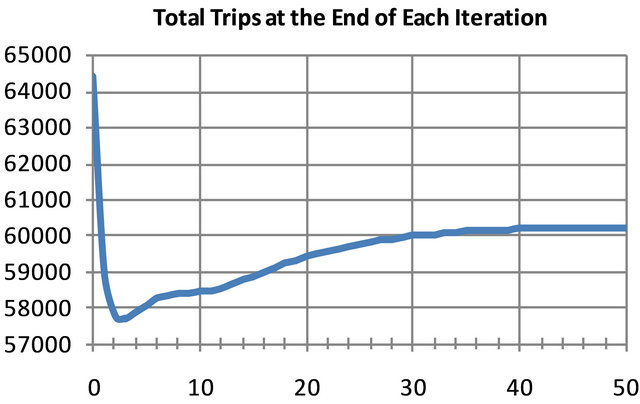
Figure 4. Total Trip Ends showing convergence.
3. Statistical Analysis
After completing the EXCEL runs, the data was combined into trips entering and exiting traffic analysis zone in the Mobile network. Truck trips were assigned into production values and attraction values. A statistical analysis was performed to develop a predictive model to create the number of trucks trips produced and attracted from the zones.
The variables used in the statistical analysis were provided by the Mobile MPO and represent a list of variables likely collected in the planning agencies of small and medium sized communities to perform trip generation for passenger trips. The variables were:
• Total Households
• Low Income Households
• Medium Income Households
• High Income Households
• Number of Students
• Number of Residents in Dormitories
• Total Employment
• Retail Employment
• Service Employment
• Other Employment
• Area in Acres
• Employment Density These variables, along with the production and attraction values were entered into MINITAB software and a regression analysis performed.
A stepwise regression analysis was performed and three variables were selected for inclusion in the model at the alpha = 0.05 level: Other Employment, Retail Employment and High Income Households. The coefficients for the model were determined by the software to minimize the error. The model developed was:
 (1)
(1)
In an attempt to improve the model, Other Employment was subdivided into Manufacturing Employment and Non-Manufacturing Employment. The Manufacturing Employment replaced the Other Employment in the stepwise regression analysis and the model developed was:
 (2)
(2)
Examining the equations developed in the process, the value of the parameters (positive and negative) show the interactions between the variables. The equations are not intended to be additive, such that an X number of additional employees or households will directly relate to a Y increase in trucks. Therefore, the application of the equation is based on the collection and distribution of the socio-economic data across the area.
As there was not a specific truck volume study performed for selected areas of Mobile due to time and budget limitations, a secondary validation technique was undertaken. The process involved applying the developed equations to the community and modeling the truck traffic that would result from the equations. These values were then compared to the actual truck counts on the roadway as observed during the traffic count process. Figure 5 presents a scatter plot of the model in predicting the number of truck trips in each zone versus the number of truck trips expected in each zone from the origin/destination estimation methodology. From the figure, it can be seen that the data trends to follow the 1:1 slope line indicating that the estimated truck trips for each zone are closely matched to the number of truck trips expected from the model in Equation (2). The correlation coefficient for the data is 0.6.
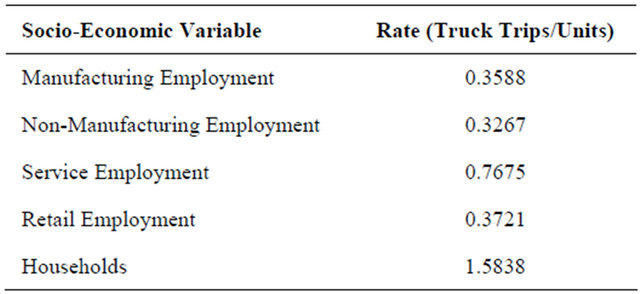
For comparison purposes, an analysis was performed using only the total estimated truck trips and employees by type of employment and households to give a one to one relationship (an X increase in employment or households results in a Y increase in trucks). For the different possible socio-economic data points, Table 1 presents the total rate. This table is presented as an alternative means to utilize the data collected in this study. For each socio-economic variable presented, the total number of trucks expected for the zone would simply be the aggregate value of socio-economic variable times the rate calculated. In this fashion, a direct value for truck trips could be calculated using a single variable, such as manufacturing employment.
4. Conclusions
This paper examined the use of a matrix estimation technique to develop a trip generation model for truck trips in a medium sized community. The methodology used had the benefit of operating using existing software and truck count data and socio-economic data that would be available at most smaller communities. The model developed for the case study community contained manufacturing employment and high income households as positive factors for truck trip generation, indicating that if a greater number of manufacturing employees or high income households were in an area, a greater number of
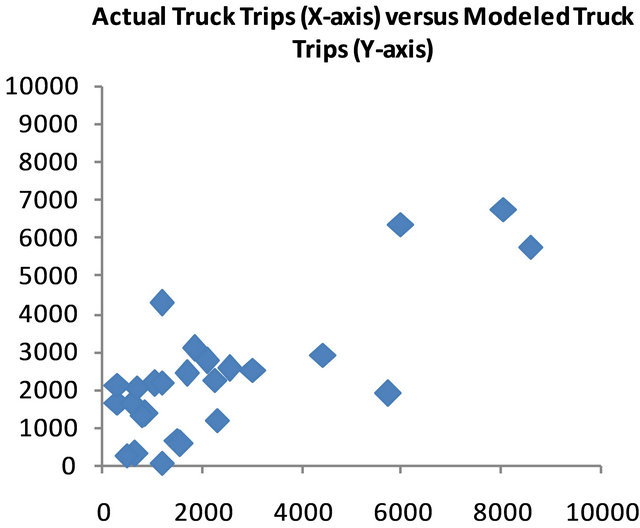
Figure 5. Comparison plot for model accuracy.
Table 1. Rate for socio-economic factor as single variable.
truck trips would be expected. This result make sense if you consider that manufacturing employees would be directly related to good movement and high income households might lead to increases in home deliveries.
The model could be improved by increasing the number of factors used in the analysis. The limitation of using household and employment data values at the sub-county level may have influenced the model and other potential factors that should be included in a truck trip generation model were missed. Overall, this paper presents a methodology and result for one smaller community that could be used add truck trips as an explicit trip purpose in their modeling efforts.
5. Acknowledgements
This research was sponsored by the U.S. Department of Transportation, Federal Transit Administration, Project No. AL-26-7262-03.
REFERENCES
- National Cooperative Highway Research Program (NC HRP), “Report 570: Guidebook for Freight Policy, Planning, and Programming in Smalland Medium-Sized Metropolitan Areas,” 2007. http://www.nap.edu/catalog.php?record_id=14036
- Cambridge Systematics, Inc., “Quick Response Freight Manual,” Federal Highway Administration, 1996. http://media.tmiponline.org/clearinghouse/quick/quick.pdf
- Cambridge Systematics, Inc., “Quick Response Freight Manual II,” Federal Highway Administration, 2007. http://ops.fhwa.dot.gov/freight/publications/qrfm2/qrfm.pdf
- H. J. Van Zuylen and L. G. Willumsen, “The Most likely Trip Matrix Estimated from Traffic Counts.” Transportation Research Part B: Methodological, Vol. 14, No. 3, 1980, pp. 281-293. doi:10.1016/0191-2615(80)90008-9
- J. de D. Ortuzar and L. G. Willumsen, “Modeling Transport,” 2nd Edition, John Wiley and Sons, New York, 1994.

