Journal of Signal and Information Processing
Vol. 3 No. 1 (2012) , Article ID: 17627 , 4 pages DOI:10.4236/jsip.2012.31004
Neural Network Based Order Statistic Processing Engines
![]()
1Department of Software Engineering, Izmir University of Economics, Izmir, Turkey; 2Electrical and Computer Engineering Department, Illinois Institute of Technology, Chicago, USA.
Email: *suleyman.unluturk@ieu.edu.tr
Received November 8th, 2011; revised December 16th, 2011; accepted December 30th, 2011
Keywords: Neural Networks; Back-Propagation Algorithm; Order Statistic Filters; Target Echo Detection
ABSTRACT
Order statistic filters are used often in the applications of science and engineering problems. This paper investigates the design and training of a feed-forward neural network to approximate minimum, median and maximum operations. The design of order statistic neural network filtering (OSNNF) is further refined by converting the input vectors with elements of real numbers to a set of inputs consisting of ones and zeros, and the neural network is trained to yield a rank vector which can be used to obtain the exact ranked values of the input vector. As a case study, the OSNNF is used to improve the visibility of target echoes masked by clutter in ultrasonic nondestructive testing applications.
1. Introduction
Order statistic (OS) processors have been widely used in the field of signal and image processing [1-3]. OS results can be obtained by sorting the elements of an input vector according to the rank of each element. Ranked outputs such as minimum, median and maximum have been used for target detection with applications in radar, sonar and ultrasonic nondestructive testing [4,5]. The problem of sorting has already been solved by sequential and iterative methods such as the bubble sort, selection sort, insertion sort, and quick sort with computational efficiency ranging between O(NlogN) and O(N2) comparisons and swapping operations [6]. As an alternative to conventional sorting techniques, a neural network design resulting from the harmony theory has been proposed for the sorting operation [7]. Neural network hardware can be implemented with parallel architecture using VLSI and FPGA technology, and this is highly desirable for high-speed computation [8-11].
In this paper, feed-forward neural network models [12] are introduced to find the minimum, the median, and the maximum of the input vectors consisting of real numbers. The back-propagation learning algorithm [13] is utilized in the training phase of the order statistic neural network filters (OSNNF). If the size of the input data is n, there is n! different input vectors including the same real numbers which give the same sorted output. Furthermore, the input vectors with real numbers demand an unlimited number of input vectors for training. Therefore, it is impractical to train an OSNNF with that many input data. Consequently, the trained OSNNF filter might not provide exact sorted results. In spite of this drawback, neural network filters can be trained to provide good approximation for the sorted results, and perhaps this might be sufficient for sorting the random processes in certain applications [4,5].
In practice, it is desirable to develop an efficient neural network model that can be used in finding the estimates of minimum, median, and maximum of the input vectors. To achieve this, simulation data is used in the training phase. The training set of data consists of random numbers with uniform distribution scaled between zero and one. Then, the neural network is trained to yield the ranked output (e.g., the minimum, the median or the maximum value of the input vector with real numbers). In the next section we present the design techniques for the neural network OS filters. Section 3 discusses an improved neural network solution that finds the rank of each input in order to reveal the exact sorted result. Section 4 utilizes these neural network filters to enhance the visibility of target echoes in high scattering clutter using split-spectrum processing (SSP).
2. Neural Network OS Filters
Figure 1 displays the structure for the neural network OS filter where the number of inputs is 8 (M = 8). This filter is a fully connected feed-forward neural network. When unordered uniformly distributed random numbers, x(i), are presented as an input vector of real numbers to the neural network, each output of the hidden neurons is the weighted sum of the input nodes and bias node passes
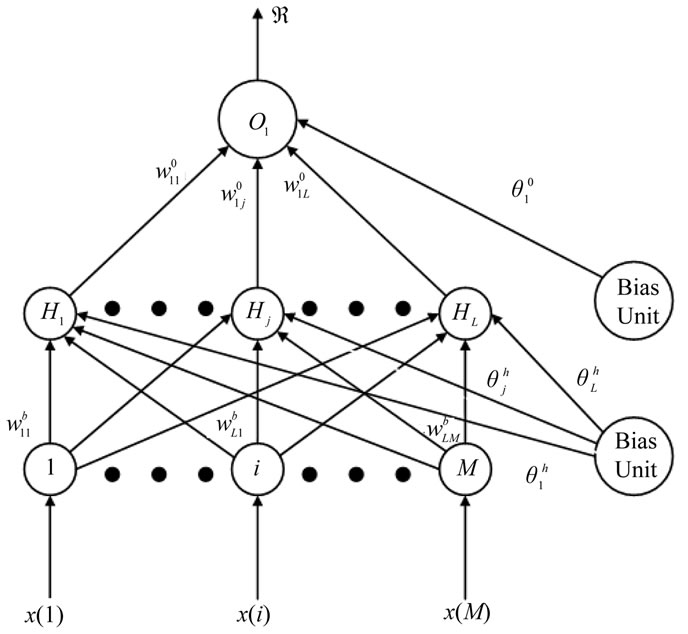
Figure 1. A three-layer model of an order statistic neural network filter.
through an activation function. The hidden neuron’s output of this neural network, 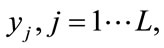 is given as
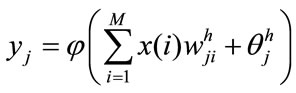 (1)
(1)
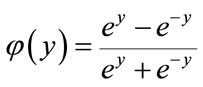
where the activation function for the hidden and output layer,  , is a tangent hyperbolic function defined as
 (2)
(2)
The term x(i) is an element of the input vector consisting of random numbers between 0 and 1,  is the weight from ith input neuron to the jth hidden neuron, and
  is the bias for the jth hidden neuron. Then, the ranked output,
  , of the neural network is the weighted sum of all the hidden neurons and the bias node, given as
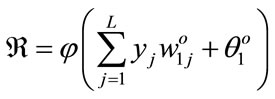 (3)
(3)
The training matrix is prepared using uniform random numbers between 0 and 1. Each column in the training matrix represents one set of these random numbers with a length of 8. Note that the size of the training set can be any number. The bigger the size of the training set, the better the estimation of the ranked output by the neural network is.
Training statistics of the neural network filters are given in Table 1. A total of 4000 sample vectors were applied to estimate the minimum (MinNNet), the median (MedNNet), and the maximum (MaxNNet). This training was reiterated for 2000 times (i.e., epochs) in order to find the best solution for the neural network. Training results show that the MinNNet, MedNNet and MaxNNet reach a lower training sum squared error that is 0.04. In
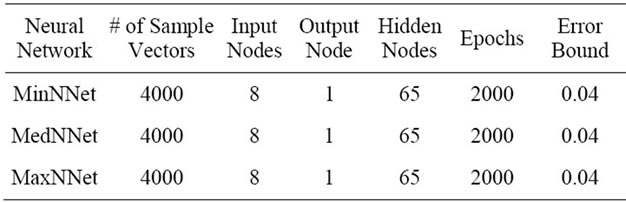
Table 1. Training statistics for MinNNet, MedNNet, and MaxNNet.
this study, Hinton diagrams [14] were utilized to examine the effectiveness of the neural network weights.
Testing results are shown in Figure 2. In this figure “+” shows the estimates for MaxNNet , “×” displays the estimates for MedNNet, and “o” depicts the estimates for MinNNet. In addition, solid lines indicate the desired values and estimates of order statistic neural network filters are superimposed over these desired values. Furthermore, as expected, Figure 2 shows that the MinNNET estimates the minimum values around 0, the MedNNET estimates the median values around 0.5 and the MaxNNET estimates the maximum values around 1. To obtain a better performance evaluation, the probability density functions of error for each neural network are estimated using the Parzen method [15]:
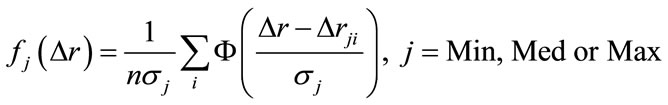 (4)
(4)
where  is the difference between the neural network output and the actual output for MinNNet, MedNNet or MaxNNet,
  is the Gaussian density function and constant
  is the variance.
Figure 3 shows the probability density functions of estimation error for each neural network. This figure illustrates how the neural network output values are affected by each neural network type to emphasize specific regions of the uniform random number distribution. Overall, the neural network is particularly efficient in obtaining the actual sorted result. For example, as can be seen in Figure 3, the maximum is 1, the median is 0.5 and the minimum is 0 with a high probability compared to other estimated values. The next section discusses an improved and precise neural network architecture for obtaing the actual ranked value.
3. Neural Network for Precise Order Statistic Filtering
The OSNNF becomes better when we add more random numbers into the training set. However, increasing the size of the random numbers to infinite in order to cover all possible combinations for input vectors, is impractical and unachievable. As a result, a trained neural network filter with a finite set of input vectors used for training
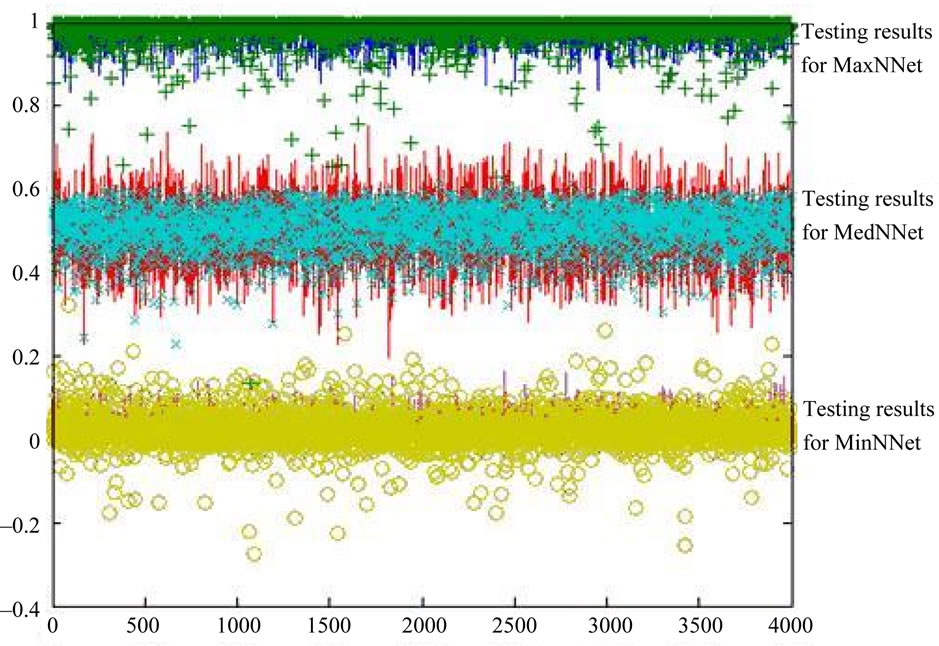
Figure 2. Testing results for MinNNet, MedNNet and MaxNNet. “+” shows the estimates for MaxNNet, “×” displays the estimates for MedNNet, and “o” depicts the estimates for MinNNet. These estimates are superimposed over the actual values shown by solid lines.
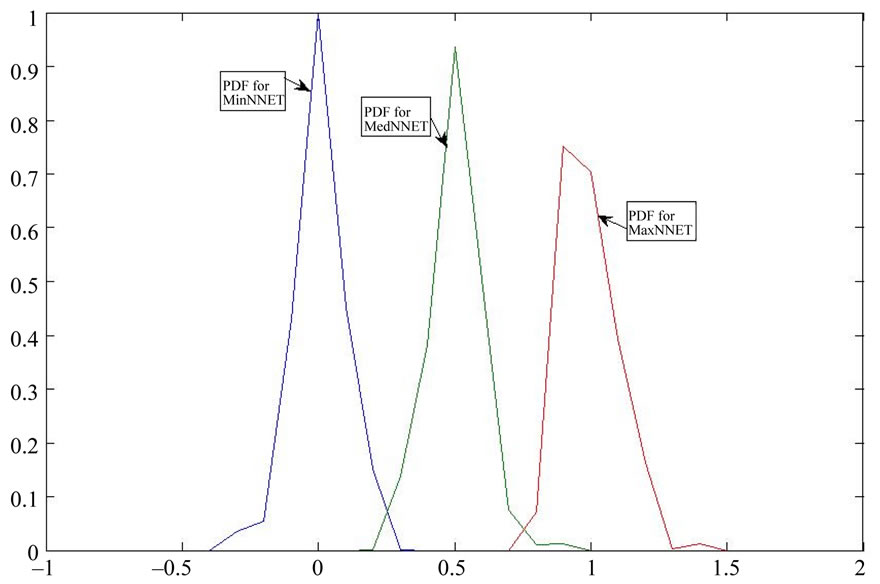
Figure 3. The probability density functions of errors for MinNNet, MedNNet and MaxNNet.
can only approximate the sorted outputs. Hence, to improve this design where the neural network output yields the exact ranked value, the input vectors are converted to a finite set of input vectors consisting of ones and zeroes elements.
Consider sorting N random numbers xi where i = 1, 2, ..., N. To generate ones and zeros as inputs to the neural network, each xi is compared with xj, where j = 1… N and j ≠ i:
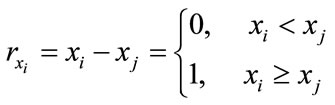 (5)
(5)
For example, consider the following input vector:
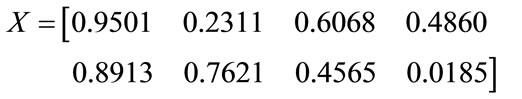
Based on the transformation shown in Equation (5), the following matrix can be generated
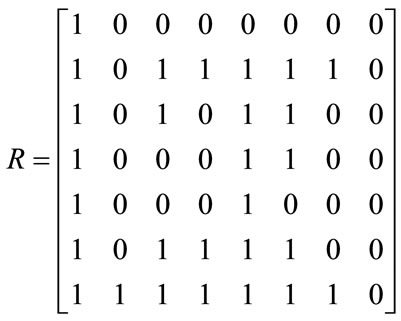
where the elements of the first column are calculated by comparing the first number, 0.9501, with the rest of the numbers within the input vector, the elements of the second column are calculated by comparing the second number, 0.2311, with the rest of the numbers and so on. Then, the output of the OSNNF becomes the actual rank vector,  , corresponding to each element within the input vector:
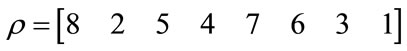 .
.
Examination of the rank vector reveals that the minimum element of x is 0.0185, because the corresponding neural network output for this element is 1; the maximum element in x is 0.9501, because the corresponding neural network output for this element is 8 and so on. The advantage of this input conversion is that the infinite input vectors of random numbers is converted to a finite set of input vectors with elements consisting of ones and zeros. And, for example, the size of the input space for an input vector with 8 elements will be 128. Consequently for an input vector of size N, the input space for the neural network is 2N-1.
For sorting 8 random numbers, the number of input elements to OSNNF is 7 and the output number represents the rank of . During training 10 hidden neurons were sufficient for detecting the rank of
  with a sum squared error of 0.0001 within 140 epochs. The OSNNF training took less iterations because of the finite size of the input space. In the next section we make use of OSNNF in ultrasonic target detection when the signal is corrupted by high scattering clutter [5].
4. OSNNF for Target Detection
Applying split-spectrum processing (SSP) to ultrasonic signals combined with order statistic filters improves the signal-to-noise ratio and the target visibility [5]. The order statistic detection filters perform better when signal and clutter have good statistical separation associated with a particular ranked output, such as minimum, median or maximum [4]. Our objective in this section is to replace the conventional order statistic filters with the OSNNF.
The block diagram of SSP coupled with the OSNNF is shown in Figure 4. The received broadband signal is partitioned into several subband channels [5] and the output of these channels are normalized using scaling factors 
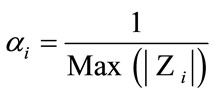 (6)
(6)
where  is the output of i-th bandpass (BP) filter at center frequency
 . There are three important issues in implementing SSP. These are the number of subbands (i.e., bandpass filters), the correlation among subbands due to spectral overlap, and the target information in each subband. There is an upper limit on the number of
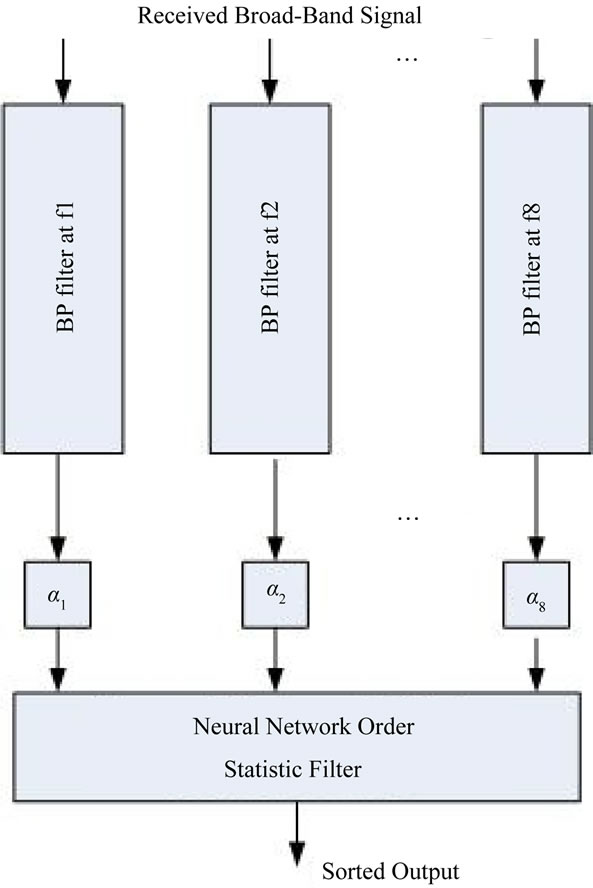
Figure 4. The block diagram of SSP based neural network order statistic target detector. In this figure αi, i = 1 ··· 8 are the scaling factors.
subbands that can be chosen without a large amount of overlap among the subbands. Correlation among subbands is not as critical to the performance of SSP as selecting the frequency range which contains information pertaining to the target echo.
The OSNNF is tested using experimental data to detect the target in presence of high scattering noise where the signal-to-noise ratio is less than zero dB (Figure 5(a)). The frequencies of the 8-channel bandpass filters reside within the frequency range of zero to 5 MHz and the bandwidth of each channel is 2.44 MHz. Figure 5 shows the outputs of OSNNF where it finds the exact values for the minimum, the median and the maximum of the 8 bandpass filters. The ranked output of OSNNF improves the SNR significantly and enhances the target echo visibility.
5. Conclusions
In this study neural network OS filters have been designed to replace the conventional sorting algorithms. Direct design of neural networks can only approximate the expected sorted output since; in general, the size of the input field is infinite. An improved design can be obtained by converting the input vector to a finite set of inputs consisting of ones and zeros. These data conversa-
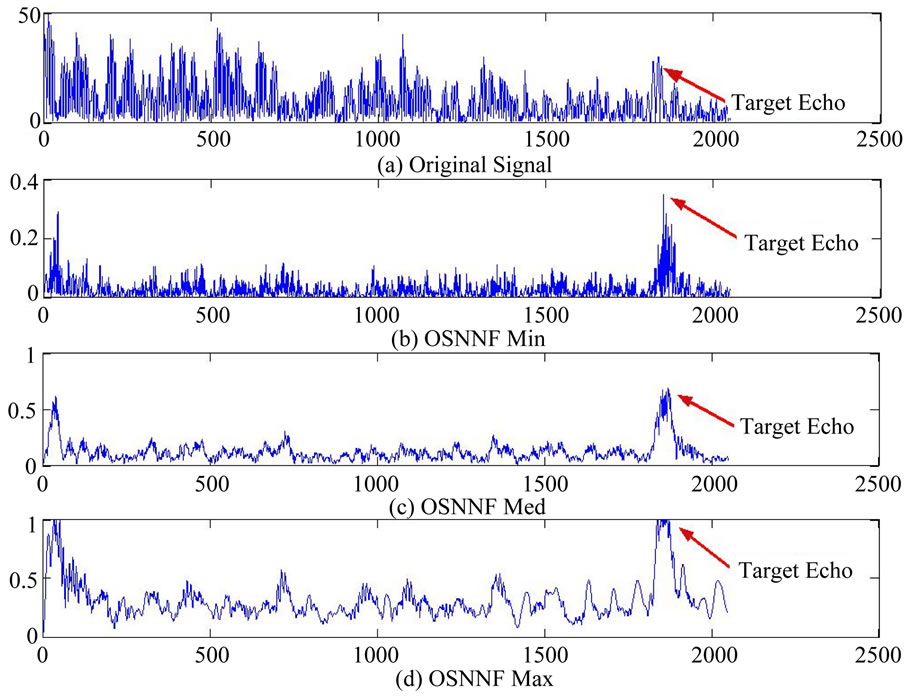
Figure 5. Performance of OSNNF for target detection. The target echo is representing the ultrasonic backscattered echo of a hole within a steel block. (a) Original experimental measurement with SNR less than zero dB; (b) OSNNF minimum output; (c) OSNNF medium output; (d) OSNNF maximum output.
tions offer three major advantages: 1) the size of the input space for the neural network becomes a finite number, 2) the zeros and ones simplify computation, and 3) the output of the neural network is a rank vector which can be used to obtain the exact ranked values. The design of the neural network order statistic filters was tested for ultrasonic target detection. Based on experimental observations, OSNNF can be efficiently used in split-spectrum processing in order to detect target signals in noisy environments.
REFERENCES
- J. Serra, “Image Analysis and Mathematical Morphology,” Academic Press, New York, 1988.
- I. Pitas and A. N. Venetsanopoulos, “Nonlinear Digital Filters, Principles and Applications,” Kluwer Academic Publishers, Boston, 1990.
- J. Astola and P. Kuosmanen, “Fundamentals of Nonlinear Digital Filtering,” CRC Press, Boca Raton, 1997.
- J. Saniie, K. D. Donohue and N. M. Bilgutay, “Order Statistic Filters as Postdetection Processor,” IEEE Transactions on Acoustics, Speech, and Signal Processing, Vol. 38, No. 10, 1990, pp. 1722-1732.
- J. Saniie, D. T. Nagle and K. D. Donohue, “Analysis of Order Statistic Filters Applied to Ultrasonic Flaw Detection Using Split-Spectrum Processing,” IEEE Transactions on Ultrasonics, Ferrorelectrics, and Frequency Control, Vol. 38, No. 2, 1999, pp. 133-140. doi:10.1109/58.68470
- M. A. Weiss, “Data Structures and Algorithm Analysis in C++,” Addison Wesley, Reading, 2006.
- T. Tambouratzis, “A Novel Artificial Neural Network for Sorting,” IEEE Transactıons on Systems, Man, and Cybernetıcs—Part B: Cybernetıcs, Vol. 29, No. 2, 1999, pp. 271-275. doi:10.1109/3477.752799
- P. W. Hollis and J. J. Paulos, “A Neural Network Learning Algorithm Tailored for VLSI Implementation,” IEEE Transactions on Neural Networks, Vol. 5, No. 5, 1994, pp. 784-791. doi:10.1109/72.317729
- B. M. Wilamowski and R. C. Jaeger, “Neuro-Fuzzy Architecture for CMOS Implementation,” IEEE Transaction on Industrial Electronics, Vol. 46, No. 6, 1999, pp. 1132- 1136. doi:10.1109/41.808001
- X. Zhu, L. Yuan, D. Wang and Y. Chen, “FPGA Implementation of a Probabilistic Neural Network for Spike Sorting,” 2010 2nd International Conference on Information Engineering and Computer Science, Wuhan, 25- 26 December 2010, pp. 1-4.
- J. Misra and I. Saha, “Artificial Neural Networks in Hardware: A Survey of Two Decades of Progress,” Neurocomputing, Vol. 74, No. 1-3, 2010, pp. 239-255.
- K. Hornik, “Multilayer Feedforward Networks as Universal Approximators,” Neural Networks, Vol. 2, No. 5, 1989, pp. 359-366. doi:10.1016/0893-6080(89)90020-8
- T. Masters, “Practical Neural Network Recipes in C++,” Academic Press Inc., New York, 1993.
- F. J. Bremner, S. J. Gotts and D. L. Denham, “Hinton Diagrams: Viewing Connection Strengths in Neural Networks,” Behavior Research Methods, Vol. 26, No. 2, 1994, pp. 215-218.
- E. Parzen, “On Estimation of a Probability Density Function and Mode,” Annals of Mathematical Statistics, Vol. 33, No. 3, 1962, pp. 1065-1076. doi:10.1214/aoms/1177704472
NOTES
*Corresponding author.