Agricultural Sciences
Vol.06 No.03(2015), Article ID:54525,10 pages
10.4236/as.2015.63031
Shifts in Carbon Stocks through Soil Profiles Following Management Change in Intensive Agricultural Systems
Baokun Lei1, Yongbo Xu2*, Yanfen Tang2, Konrad Hauptfleisch3
1Institute of Agricultural Resources and Environmental Sciences,
2Yunnan Agricultural University, Kunming, China
3International Federation of Organic Agriculture Movements,
Email: *xuyongboxx@163.com
Copyright © 2015 by authors and Scientific Research Publishing Inc.
This work is licensed under the Creative Commons Attribution International License (CC BY).
http://creativecommons.org/licenses/by/4.0/


Received 12 February 2015; accepted 7 March 2015; published 10 March 2015
ABSTRACT
Soil carbon content is an important ecosystem property, especially under the ongoing climate change. The stability of soil organic matter (SOM) is controlled by environmental and biological factors including anthropogenic-induced agricultural management change. However, understand- ing the effects of anthropogenic activities (e.g., intensive agricultural practices) on carbon stability of soil profiles remains a challenge. The objective of this study was to determine the changes in carbon stocks through soil profiles following agricultural management change from grain fields to greenhouse vegetable fields. The sampling sites were located in an intensive vegetable production area in northern
 -N leached to deeper soils increased by 3.7 times compared to that in the GF. The pH value and microbial biomass carbon (MBC) content were lower in the VF than in the GF. These results indicate that excessive nitrogen application as fertilizers might lead to deeper soil carbon depletion. Reducing nitrogen addition in intensive agricultural systems is thus necessary to reduce soil carbon loss and to maintain a relatively sustainable soil system.
Keywords:
Carbon Sequestration, Intensive Agricultural Systems, Fertilization, Soil Profiles

1. Introduction
Recent studies suggest that anthropological activities are creating regional environmental issues including changes in the levels of soil nitrogen, phosphorus, pH, and atmospheric CO2 [1] [2] . The effects of agricultural management change on soil carbon balance and stability, especially in deeper soil layers, have not been fully explored. The studies informed management strategies aimed at enhancing stability of soil OM and reducing CO2 emissions [3] .
Farmers are encouraged by local governments to convert grain fields (GF) to vegetable fields (VF) under the increasing consumer demand, which leads to potential increase in the farmers’ income. Compared with grain production, vegetable cultivation often requires more intensive management and greater inputs of fertilizers and more irrigation [4] . Studies have recorded significant acidification in croplands resulting from N fertilizer overuse [5] . The increased fertilizer application accompanying management change from GF into VF could alter soil properties at different soil depths.
Compared with grain production, vegetable cultivation often requires more intensive management and greater input of nitrogen fertilizer and more irrigation. Therefore, we hypothesized that the increased fertilizer application accompanying management change from GF to VF would alter soil properties at different soil depths, which could lead to considerable changes in nitrogen content through different soil layers.
China ranks the first in nitrogen fertilizer production and consumption in the world due to its vast population. Nitrogen influences carbon cycle, which is closely associated with global climate change. The misuse of nitrogen has therefore given rise to serious environmental problems.
Today, China is also a leading country in vegetable production and consumption with 17.3 Mha of land dedicated solely to vegetable production (National Bureau of Statistics of China, 2008). Vegetable cultivation, especially greenhouse vegetable production in northern China requires more intensive management in terms of tillage, irrigation, and fertilization. Several studies have recorded acidification, secondary salinization, nutrient enrichment, and nutrient imbalance in the soils of these systems [6] - [10] . However, the effects of vegetable production on soil carbon stability due to nitrogen overuse have not been investigated. Carbon dynamics in the surface soil and in deeper soil layers might be controlled by different mechanisms [11] [12] . Soil carbon in the deep layers was originally considered unsusceptible to decomposition. Recently, more attention has been given to carbon stability in deeper soil layers because of the giant carbon stock in deeper soil, which might accounts for more than 60% of the total carbon storage in soil profiles [13] . Previous studies have indicated that exogenous carbon or nitrogen trigger the rapid decomposition of old organic matter in deeper soil layers [14] [15] . The objectives of the present study were to determine the changes in total SOC and total N, the soil C:N ratio, and labile C pools (DOC and MBC) following the land-use conversion from cereal fields to vegetable field systems and to quantify the relationships between labile C pools, total SOC and soil pH. The study focused on the 0 - 90 cm of the soil profile because C and N transformations are likely to be affected by different management systems in holistic soil profiles.
2. Materials and Methods
2.1. Soil Sampling
The sampling sites were located in Shouguang County, Shandong Province, which is an area with intensive greenhouse vegetable production in northern China. The region is characterized by a typical continental monsoon climate with a mean annual temperature of 12.7˚C, 2549 h of mean annual sunshine, and a mean annual precipitation of

Table 1. Background information of the greenhouse vegetable fields in Shouguang, Shandong Province of northern China.
*Tomato (Solanum lycopersicum L.), pepper (Capsicum annuum L. var. annuum), cucumber (Cucumis sativus L).
each field, a
2.2. Soil Analysis
The pH of the soil samples was measured in 1:1 (w/v) soil suspension, where
 ?N were determined by extracting
 ?N using a TRAACS Model 2000 Continuous Flow Analyzer (Bran and Luebbe, Norderstedt, Germany).
Carbon concentration in the microbial biomass of the 0 - 30 cm and 30 - 60 cm soil samples was determined using a modified chloroform-fumigation-extraction method. Microbial biomass carbon content in the 60 - 90 cm soil samples was not determined due to the relatively lower content and larger error. The contents of soil microbial biomass in the profiles decreased remarkably within 0 - 60 cm and remained at the lowest level within 60 - 120 cm [17] . Fresh soil samples 25 g (equivalent to
2.3. Survey of Nitrogen Fertilizer and Manure Inputs
Inputs of nitrogen fertilizers and matters (organic carbon) were estimated according to the data collected from a survey of local farmers. Nitrogen inputs from irrigation water were acquired by recording the amount of irrigation water and monitoring the concentration of nitrogen in the water. The amount of N in the seeds was calculated by multiplying the seeding density by the N concentration of the seeds. Other N input sources were literature values (Table 3). C inputs were determined as following formula: C in straw + C in root + C in rhizodeposite + C in organic manure. C in rhizodeposite was estimated according to parameters in the reference [18] . Compared with cereal production, vegetable cultivation often requires more intensive management and larger inputs of nutrients and irrigation. This is especially true in North China greenhouse vegetable production systems, with more intensive management in terms of tillage, irrigation, and fertilization.
2.4. Statistical Analysis
Statistical analyses were performed using the SPSS software package for Windows (Version 11.5, SPSS Inc., Chicago). Soil indicators in the GF and the VF were compared using paired t-test (n = 20).
3. Results and Discussion
3.1. Correlation Analysis between Time under Vegetables and Soil Indicators
There were no significant correlations between time under vegetables and soil indicators. Although the GF systems were converted to VF about 4 to 17 yr previously, the varied time had no obvious influence on vegetable soil properties during the period studied (Table 2). Thus the land use conversion could be a more important driving force for soil carbon shifts.
3.2. Soil Nitrogen and Organic Carbon
The carbon input in the VF soils was significantly higher (p < 0.05) than that in the GF (Table 3), being 1.9 times higher than that of the GF soils. This was due to the large amount of organic manure input even though no crop residue was left in the vegetable fields. Carbon input through stubble and root deposition was much less than that of the organic manure, accounting for only 4% of the total carbon input in the soil of the vegetable fields. However, stubble and root deposition contributed greatly to the SOC stocks in the grain fields. To be specific, 82% and 11% of the total carbon input were derived from the stubble and the underground biomass in the GF, respectively. The biomass of the vegetative parts of the maize was larger than that of the wheat. This led to the result that carbon input into the soils of the maize fields was 524 kg∙ha−1 greater than that of the wheat fields.
Table 2. Correlation analysis between time under vegetables and soil indicators.
Note: Significant differences at p < 0.05 level. CN means carbon to nitrogen ratio. The numbers after letters mean soil depth in centimeter.
(a) (b)
Table 3. Carbon input in vegetable fields and grain fields. (a): Grain fields; (b): Vegetable fields.
Note: All the data presented in this table were from field survey except the RD and harvest index, which were obtained from literature. Among which, harvest index and RD value of the grain fields were from Bolinder et al. [18] , the RD value of the vegetable fields were from Chaves et al. [19] . TOC: total organic carbon. TN: total nitrogen. RD: rhizosphere deposition. OM: organic matter.
The total nitrogen input was 2345.5 kg∙ha−1 for the VF, which was about 9 times greater than that of the GF (236.77 kg∙ha−1) (Table 4). Nitrogen derived from the organic manure and chemical fertilizer accounted for more than 90% of the total nitrogen input in the vegetable fields.
The C:N ratio of the total input was 4.2:1 and 9.9:
The soil is classified as fluvo-aquic (Ochri-Aquic Cambosols) developed from alluvial river deposits and has a sandy loam texture. The roots were removed from topsoil under VF and retained under GF, which obtained more Carbon in GF than in VF through rhizodeposite. The soil bulk density in the 0 to
3.3. Soil Nitrogen and Carbon Stocks in Soil Profiles
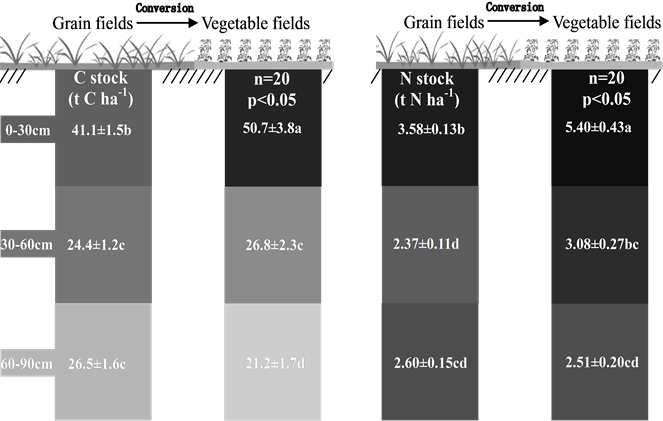
Soil carbon stock in the top soil (0 - 30 cm) of the VF was significantly higher than that of the GF, whereas in the deeper soil (60 - 90 cm), the reverse was true (p < 0.05) (Figure 1(a)). In the middle soil layer (30 - 60 cm), the carbon stock of the VF (26.8 mg C ha−1) was similar to that of the GF (24.4 mg C ha−1). The carbon stocks in the soil profile of the GF did not vary significantly below
The main reason for carbon increase in the top soil layer of the VF after converting from the GF was the carbon input in the form of organic fertilizers. The carbon input in the VF was 9.9 mg C ha−1, which far outweighed that of the GF (5.2 mg C ha−1), indicating that the high soil carbon content in the VF soils was mainly a result of land management rather than crop primary productivity.
The VF had more nitrogen (5.40 mg N ha−1) than that of the GF in top soil layer (0 - 30 cm) (Figure 1(b)), which might be a result of organic fertilizer application. Nevertheless, in the middle soil layer (30 - 60 cm), the nitrogen stock in the VF was still significantly higher than that of the GF.
Table 4. Nitrogen input in vegetable fields and grain fields.
Note: all the data presented in this table were from field survey except indicated otherwise in the parentheses.
Table 5. Characterization of soil properties.
Different letters represent significant differences at p < 0.05 level. The data are presented as mean ± standard error.
 (a) (b)
Figure 1. Organic carbon (a) and total nitrogen (b) stocks in soil profiles changed when grain fields were converted to vegetable fields. The soil profiles were divided into three layers: 0 - 30 cm, 30 - 60 cm and 60 - 90 cm. The left column of each pair of columns shows grain field (GF) soil profiles and the right columns are vegetable field (VF) soil profiles. Average carbon and nitrogen stocks in the GF and the VF were compared using the paired t-test (n = 20). Different letters represent significant differences at p < 0.05 level. The data are presented as mean ± standard error. The two-way arrows indicate significant correlations between carbon or nitrogen stocks in any two soil layers. The r values are the Pearson’s Correlation Coefficient.
3.4. Effects of Soil Active Ingredients on Carbon and Nitrogen Stocks
There was no obvious increase in the deep soil N pool of the VF compared to the GF despite the fact that 3.7 times more  -N had been leached into the deep soil layer of the VF compared with the GF (Figure 2). The fact that exogenous nitrogen leached into the deep soil layer may lead to indigenous carbon that has been stable being converted into a form that can be broken down quickly [23] - [26] . Therefore, excessive application of nitrogen fertilizer might cause the loss of carbon in deep soil layer. The feedback loop between inorganic nitrogen dynamics and microbial communities may be the key mechanism regulating soil carbon storage [26] - [28] . No significant increase was found in the amount of DOC in deep soil layers following the management change, although DOC in the surface soil layer of the VF was significantly higher than that of the GF (Figure 2). Studies have shown that the effect of adding exogenous carbon to deep soil layer can lead to the rapid decomposition of organic matter that has been previously maintained in the soil for a few hundred years [29] .
It was found that microbial biomass carbon (MBC) declined in the top soil layer in the VF compared to that in the GF despite adequate nutrient supply in the VF (Figure 3). The greater MBC amount in the deeper soil layer in the VF than that in the GF (Figure 3) possibly due to the nitrogen leaching stimulating the microbial activities [14] . The increased MBC in the deeper soil layer indicates greater microbial activities. Microbes play an important role in the decomposition of soil organic matter. Greater microbial activity usually equals higher decomposition rate. More carbon dioxide is released from the complex SOC, therefore reducing the SOC content. This may explain the fact that C stock in the deep soil layer of the VF was lower than that of the GF.
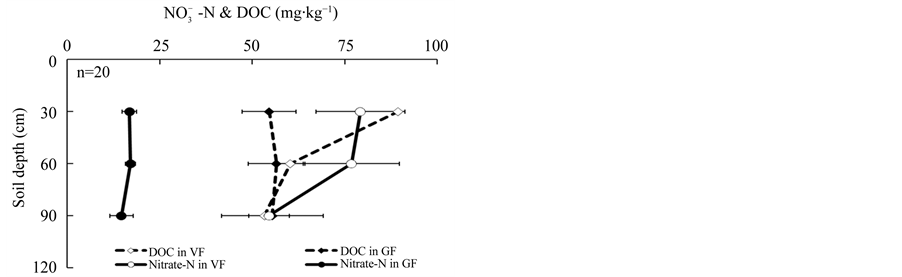
Figure 2. Comparison of nitrate-N ( -N) (mg N kg−1), dissolved organic carbon (DOC) (mg C kg−1) and dissolved organic nitrogen (DON) (mg N kg−1) between vegetable fields (VF) and grain fields (GF) in soil profiles. The soil profile is divided into three layers: 0 - 30 cm, 30 - 60 cm and 60 - 90 cm. The bars represent standard error (n = 20).
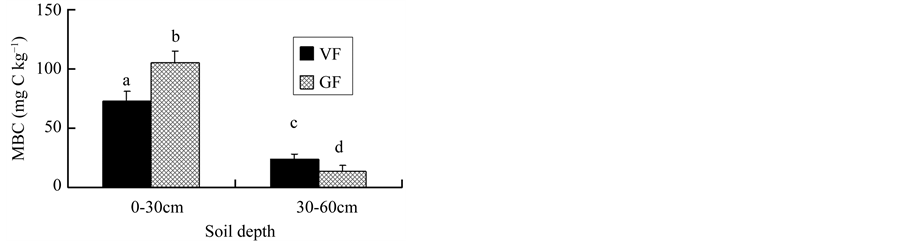
Figure 3. Changes in soil microbial biomass carbon (MBC, mg C kg−1) following conversion of grain fields to vegetable fields. Different superscript letters above the columns represent significant differences at p < 0.05 level.
3.5. Effects of C:N Ratio on Soil Carbon and Nitrogen Stocks
It was found that the C:N ratio and the pH value in the VF were significantly lower than that of the GF across the soil depth gradient (Figure 4). The results suggest that carbon in the VF was in an unstable state. A lower C:N ratio is expected to shift microbial community composition from fungal to bacterial dominance [30] , which will lead to faster organic matter decomposition [31] - [33] . Theoretically, the C:N ratio dominantly controls organic matter decomposition [34] . With low C:N ratios, the top soil of the VF still retained more carbon than that of the GF because of the continuous addition of carbon from manure. Additionally, low pH in the VF also could inhibited the decomposition of SOM which might facilitate the C accumulation in the VF surface soils.
The observed decline in the C:N ratio is a signal of SOC shifting from steady-state to non-steady state. The relationship between soil C:N and its CO2-C loss provides an easy-to-use measure for predicting soil carbon loss potentials on a larger scale [35] . Therefore, in order to prevent the declining trend in agricultural soil C:N ratio, measures to improve this ratio need to be taken into consideration. A conceptual model was designed to increase soil C:N ratio through three pathways (Figure 5): (1) increase C input (+C), (2) decrease N input (−N) or (3) decrease N input and increase C input (+C & −N).
The amount of C or N amendments that is needed to change a soil C:N ratio of
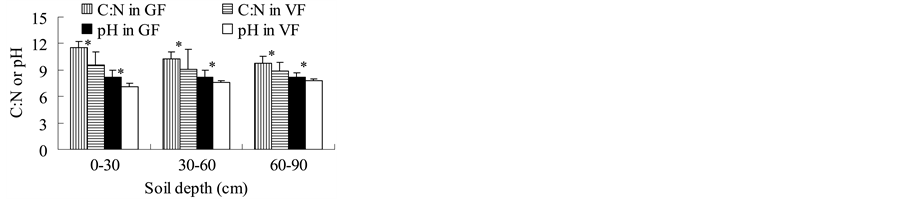
Figure 4. Effects of management changes on soil pH and carbon to nitrogen ratio (C:N) of the grain fields (GF) and the vegetable fields (VF). The bars above the columns represent standard error (n = 20). Asterisks above the columns represent significant differences at p < 0.05 level.
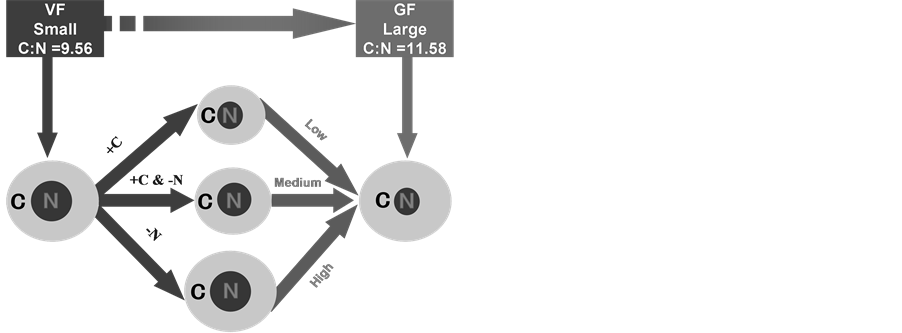
Figure 5. Three pathways of conversion of low C:N in the vegetable fields (VF) to high C:N in the grain fields (GF). −N: reduce soil nitrogen stock; +N: increase soil nitrogen stock; +C: increase soil carbon stock levels; Low: low level soil carbon or nitrogen stocks; Medium: middle level soil carbon or nitrogen stocks; High: high level soil carbon or nitrogen stocks. The yellow areas represent soil carbon stocks, and the red circles represent soil nitrogen stocks.
mg C ha−1; in the second scenario, the nitrogen input is decreased by 0.96 mg N ha−1 and in the third scenario the increase in carbon input is 5.55 mg C ha−1 and the decrease in nitrogen input is 0.48 mg N ha−1. In all three scenarios, the objective of increasing soil C:N ratio was achieved, either by increasing soil carbon content, decreasing soil nitrogen content, or by increasing soil carbon and decreasing soil nitrogen content simultaneously. Among the three scenarios, reducing soil nitrogen storage appropriately is the most feasible approach considering the current soil carbon and nitrogen situation. This will not only help reduce nitrogen pollution, but also minimize the risk of declining carbon stability in the soil caused by the overuse of nitrogen fertilizers. Driven by a need to both produce more food and lessen the environmental impact of agriculture, we are working out how to push crop yields close to their biophysical limits. We believe that optimal nitrogen input is able to obtain the greatest yields at the lowest economic and environmental costs, and this is also the common wish of farmers across the country.
4. Conclusion
The management change from grain fields to vegetable fields increased surface soil C stock and reduced the deep soil layer C stock with the increased application of manure in vegetable fields as a common agricultural practice. The C:N ratio and pH value were lower in the vegetable fields compared with the grain fields. These environmental changes due to nitrogen fertilizer overuse affect carbon stability in soil profiles. Reducing the nitrogen addition to the soil is a feasible solution considering the current soil carbon and nitrogen situation. This will not only help reduce nitrogen pollution, but also minimize the risk of declining soil carbon stability. Our results will facilitate efficient management of soil carbon and nitrogen stocks in intensive agricultural systems, which will help maintain a relatively sustainable soil system.
Acknowledgements
This work was financially supported by the National Natural Science Foundation of China (31160413, 31260503, 31101605), the Major Science and Technology Program for Water Pollution Control and Treatment (2014ZX07105-001) and the Program for Ministry of Agriculture, PRC (contract No. 201003014-6).
References
- Lal, R. (2004) Soil Carbon Sequestration Impacts on Global Climate Change and Food Security. Science, 304, 1623- 1627. http://dx.doi.org/10.1126/science.1097396
- Tilman, D. and Lehman, C. (2001) Human-Caused Environmental Change: Impacts on Plant Diversity and Evolution. Proceedings of the National Academy of Sciences of USA, 98, 5433-5440. http://dx.doi.org/10.1073/pnas.091093198
- Schmidt, M.W.I., Torn, M.S., Abiven, S., Dittmar, T., Guggenberger, G., Janssens, I.A., Kleber, M., Kögel-Knabner, I., Lehmann, J., Manning, D.A.C., Nannipieri, P., Rasse, D.P., Weiner, S. and Trumbore, S.E. (2011) Persistence of Soil Organic Matter as an Ecosystem Property. Nature, 478, 49-54. http://dx.doi.org/10.1038/nature10386
- Power, J.F. and Schepers, J.S. (1989) Nitrate Contamination of Groundwater in North America. Agriculture, Ecosystems and Environment, 26, 165-187. http://dx.doi.org/10.1016/0167-8809(89)90012-1
- Guo, J.H., Liu, X.J., Zhang, Y., Shen, J.L., Han, W.X., Zhang, W.F., Christie, P., Goulding, K.W.T., Vitousek, P.M. and Zhang, F.S. (2010) Significant Acidification in Major Chinese Croplands. Science, 327, 1008-1010. http://dx.doi.org/10.1126/science.1182570
- Cao, Z.H., Huang, J.F., Zhang, C.S. and Li, A.F. (2004) Soil Quality Evolution after Land Use Change from Paddy Soil to Vegetable Land. Environmental Geochemistry and Health, 26, 97-103. http://dx.doi.org/10.1023/B:EGAH.0000039572.11564.27
- Chen, M.Y. (1990) The Accumulation and Harmful Effect of Salt in Greenhouse Soils and Countermeasures. Soil Fertilization, 1, 1-7. (In Chinese)
- Li, W.Q., Du, B.H., Luo, H.Y. and Ding, F.J. (1996) The Influences of Greenhouse Cultivation on Soil Microflora. Soils Fertilization, 2, 31-33. (In Chinese)
- Lin, X.G., Yin, R., Zhang, H.Y., Huang, J.F., Chen, R.R. and Cao, Z.H. (2004) Changes of Soil Microbiological Properties Caused by Land Use Changing from Rice-Wheat Rotation to Vegetable Cultivation. Environmental Geochemistry and Health, 26, 119-128. http://dx.doi.org/10.1023/B:EGAH.0000039574.99651.65
- Shi, W.M., Yao, J. and Yan, F. (2009) Vegetable Cultivation under Greenhouse Conditions Leads to Rapid Accumulation of Nutrients, Acidification and Salinity of Soils and Groundwater Contamination in South-Eastern China. Nutrient Cycling in Agroecosystems, 83, 73-84. http://dx.doi.org/10.1007/s10705-008-9201-3
- Rumpel, C. and Kögel-Knabner, I. (2011) Deep Soil Organic Matter―A Key but Poorly Understood Component of Terrestrial C Cycle. Plant and Soil, 338, 143-158. http://dx.doi.org/10.1007/s11104-010-0391-5
- Salome, C., Nunan, N., Pouteau, V., Lerch, T.Z. and Chenu, C. (2010) Carbon Dynamics in Top Soil and in Subsoil May Be Controlled by Different Regulatory Mechanisms. Global Change Biology, 16, 416-426. http://dx.doi.org/10.1111/j.1365-2486.2009.01884.x
- Batjes, N.H. (1996) Total Carbon and Nitrogen in the Soils of the World. European Journal of Soil Science, 47, 151- 163. http://dx.doi.org/10.1111/j.1365-2389.1996.tb01386.x
- Fontaine, S., Barot, S., Barré, P., Bdioui, N., Mary, B. and Rumpel, C. (2007) Stability of Organic Carbon in Deep Soil Layers Controlled by Fresh Carbon Supply. Nature, 450, 277-280. http://dx.doi.org/10.1038/nature06275
- Mack, M.C., Schuur, E.A.G., Bret-Harte, M.S., Shaver, G.R. and Chapin III, F.S. (2004) Ecosystem Carbon Storage in Arctic Tundra Reduced by Long-Term Nutrient Fertilization. Nature, 431, 440-443. http://dx.doi.org/10.1038/nature02887
- Jones, D.L. and Willett, V.B. (2006) Experimental Evaluation of Methods to Quantify Dissolved Organic Nitrogen (DON) and Dissolved Organic Carbon (DOC) in Soil. Soil Biology and Biochemistry, 38, 991-999. http://dx.doi.org/10.1016/j.soilbio.2005.08.012
- Dang, Y.A., Li, S.Q. and Wang, G.D. (2007) Distribution Characteristics of Soil Total Nitrogen and Soil Microbial Biomass Nitrogen for the Typical Types of Soils on the Loess Plateau. Plant Nutrition and Fertilizer Science, 13, 1020 -1027.
- Bolinder, M.A., Janzen, H.H. and Gregorich, E.G. (2007) An Approach for Estimating Net Primary Productivity and Annual Carbon Inputs to Soil for Common Agricultural Crops in Canada. Agriculture, Ecosystems and Environment, 118, 29-42. http://dx.doi.org/10.1016/j.agee.2006.05.013
- Chaves, B., Neve, S. and Hofman, G. (2004) Nitrogen Mineralization of Vegetable Root Residues and Green Manures as Related to Their (Bio) Chemical Composition. European Journal of Agronomy, 21, 161-170. http://dx.doi.org/10.1016/j.eja.2003.07.001
- He, F.F. (2006) Nitrogen Management and Environmental Effect Greenhouse Tomato Production System. PhD Dissertation of China Agricultural University, Beijing, 61-72.
- Liu, X.J., Zhang, Y., Han, W.X., Tang, A.H. and Shen, J.L. (2013) Enhanced Nitrogen Deposition over China. Nature, 494, 459-462. http://dx.doi.org/10.1038/nature11917
- Fan, M.S. (2005) Integrated Plant Nutrient Management for Rice-Upland Crop Rotation System. PhD. Dissertation of China Agricultural University, Beijing, 81-93.
- Bragazza, L., Freeman, C., Jones, T., Rydin, H., Limpens, J., Fenner, N., Ellis, T., Gerdol, R., Hájek, M., Hájek, T., Lacumin, P., Kutnar, L., Tahvanainen, T. and Toberman, H. (2006) Atmospheric Nitrogen Deposition Promotes Carbon Loss from Peat Bogs. Proceedings of the National Academy of Sciences of USA, 103, 19386-19389. http://dx.doi.org/10.1073/pnas.0606629104
- Cleveland, C.C. and Townsend, A.R. (2006) Nutrient Additions to a Tropical Rain Forest Drive Substantial Soil Carbon Dioxide Losses to the Atmosphere. Proceedings of the National Academy of Sciences of USA, 103, 10316-10321. http://dx.doi.org/10.1073/pnas.0600989103
- Kramer, S.B., Reganold, J.P., Glover, J.D., Bohannan, B.J.M. and Mooney, H.A. (2006) Reduced Nitrate Leaching and Enhanced Denitrifier Activity and Efficiency in Organically Fertilized Soils. Proceedings of the National Academy of Sciences of USA, 103, 4522-4527. http://dx.doi.org/10.1073/pnas.0600359103
- Reay, D.S., Dentener, F., Smith, P., Grace, J. and Feely, R.A. (2008) Global Nitrogen Deposition and Carbon Sinks. Nature Geoscience, 1, 430-437. http://dx.doi.org/10.1038/ngeo230
- Janssens, I.A., Dieleman, W., Luyssaert, S., Subke, J.A., Reichstein, M., Ceulemans, R., Ciais, P., Dolman, A.J., Grace, J., Matteucci, G., Papale, D., Piao, S.L., Schulze, E.D., Tang, J. and Law, B.E. (2010) Reduction of Forest Soil Respiration in Response to Nitrogen Deposition. Nature Geoscience, 3, 315-322. http://dx.doi.org/10.1038/ngeo844
- Xu, C., Liang, C., Wullschleger, S., Wilson, C. and McDowell, N. (2011) Importance of Feedback Loops between Soil Inorganic Nitrogen and Microbial Communities in the Heterotrophic Soil Respiration Response to Global Warming. Nature Reviews Microbiology, 9, 222-223. http://dx.doi.org/10.1038/nrmicro2439-c1
- Well, R., Höper, H., Mehranfar, O. and Meyer, K. (2005) Denitrification in the Saturated Zone of Hydromorphic Soils―Laboratory Measurement, Regulating Factors and Stochastic Modeling. Soil Biology and Biochemistry, 37, 1822-1836. http://dx.doi.org/10.1016/j.soilbio.2005.02.014
- Lauber, C.L., Strickland, M.S., Bradford, M.A. and Fierer, N. (2008) The Influence of Soil Properties on the Structure of Bacterial and fungal Communities across Land-Use Types. Soil Biology and Biochemistry, 40, 2407-2415. http://dx.doi.org/10.1016/j.soilbio.2008.05.021
- Fierer, N., Bradford, M.A. and Jackson, R.B. (2007) Toward an Ecological Classification of Soil Bacteria. Ecology, 88, 1354-1364. http://dx.doi.org/10.1890/05-1839
- Moore, J.C. (2003) Top-Down Is Bottom-Up: Does Predation in the Rhizosphere Regulate Aboveground Dynamics? Ecology, 84, 846-857. http://dx.doi.org/10.1890/0012-9658(2003)084[0846:TIBDPI]2.0.CO;2
- Ramirez, K.S., Lauber, C.L., Knight, R., Bradford, M.A. and Fierer, N. (2010) Consistent Effects of Nitrogen Fertilization on Soil Bacterial Communities in Contrasting Systems. Ecology, 91, 3463-3470. http://dx.doi.org/10.1890/10-0426.1
- Parton, W., Silver, W.L., Burke, I.C., Grassens, L., Harmon, M.E., Currie, W.S., King, J.Y., Adair, E.C., Brandt, L.A., Hart, S.C. and Fasth, B. (2007) Global-Scale Similarities in Nitrogen Release Patterns during Long-Term Decomposition. Science, 315, 361-364. http://dx.doi.org/10.1126/science.1134853
- Thomsen, I.K., Petersen, B.M., Bruun, S., Jensen, L.S. and Christensen, B.T. (2008) Estimating Soil C Loss Potentials from the C to N Ratio. Soil Biology and Biochemistry, 40, 849-852. http://dx.doi.org/10.1016/j.soilbio.2007.10.002
NOTES

*Corresponding author.