Agricultural Sciences
Vol.4 No.12A(2013), Article ID:41227,11 pages DOI:10.4236/as.2013.412A004
Phosphorus and potassium fertilization in no till southern Brazilian soils
![]()
1Department of Soil, Federal University of Rondônia, Rolim de Moura, Brazil; *Corresponding Author: jairojas.estagio@yahoo.com.br
2EMBRAPA—National Research Center of Fisheries, Aquaculture and Agricultural Systems, Palmas, Brazil
3Department of Soil Science, Federal University of Rio Grande do Sul, Porto Alegre, Brazil
Copyright © 2013 Jairo André Schlindwein et al. This is an open access article distributed under the Creative Commons Attribution License, which permits unrestricted use, distribution, and reproduction in any medium, provided the original work is properly cited.
Received 9 October 2013; revised 13 November 2013; accepted 24 November 2013
Keywords: P2O5; K2O; Sample Depth; Soil Analysis Methods
ABSTRACT
Phosphorus (P) and potassium (K) levels in southern Brazilian (Rio Grande do Sul, RS) soils are largely below the critical concentrations more than four decades after implementation of the officially recommended system. This study aims to evaluate the increase in P and K levels in 0 - 10 and 0 - 20 cm deep samples from no-till soils using the Mehlich-1 (M1) and Mehlich-3 (M3) extractants as well as resin methods and to estimate the amount of P2O5 and K2O fertilizers necessary to increase the P and K soil levels by 1 mg·kg−1. The study was conducted in fields cultivated using a no-till system (direct planting) to grow soybeans, wheat, maize, pasture, and cover crops and fertilized with P2O5 and K2O. Soil samples were collected from the 0 - 10 and 0 - 20 cm soil layers and analyzed by the M1, M3, and resin methods. The results demonstrated that the P and K levels increased in the 0 - 10 and 0 - 20 cm layers. However, the amount of these levels increased depending on the source of phosphate fertilization and on the P and K extraction methods used. The amount of P2O5 fertilization needed to raise the P level by 1 mg·kg−1 was greater in the 0 - 20 cm layer than in the 0 - 10 cm layer, and the amount of K2O fertilization needed to raise the K level by 1 mg·kg−1 was higher in the 0 - 10 cm layer than in the 0 - 20 cm layer.
1. INTRODUCTION
Soybean, wheat and maize are the most commonly grown crops in the oxidized soil with low fertility of Rio Grande do Sul (RS), Brazil; their cultivation occupies an area of approximately 5 million hectares, and this amount of cultivated land has not changed greatly over the years [1]. Agricultural expansion in RS has been mainly due to the utilization of amendments and fertilizers during the 1950s and 1960s; however, the conventional soil cultivation system that has been completely replaced by no-till farming methods since the 1990s.
The average yields for crops grown in RS are lower than the average yields in some other Brazilian regions and other countries; in 2009/10, the soybean, wheat, and maize yields were 2570, 2100, and 4860 kg·ha−1, respectively [1]. These yields are partially due to low soil fertility [2-5]. However, when the supply of nutrients and other production factors are sufficient during the crop growth cycle, these yields are higher, reaching up to 3000, 3000, and 10,000 kg·ha−1 for soybeans, wheat, and maize, respectively [6-8].
In the most recent soil fertility survey performed by [5], after more than four decades of agricultural expansion and the use of amendments and fertilizers in RS, approximately 80% and 40% of the soil analyses conducted between 1998 and 2000 showed P and K levels below the minimum required for satisfactory yields, respectively. Thus, 424,000 tons of potassium in the form of K2O and 299 tons of phosphate fertilizers in the form of P2O5 were needed annually [5], representing large investments in the industrial, transport, and agriculture sectors. Fertilizer costs are approximately 20% of the total crop investment in RS for soybeans, wheat, and maize grown under a no-till system [9]. Therefore, fertilizer levels must be reasonable and based on calibration field studies to determine the specific nutrient amounts needed for maximizing economic efficiency, which is achieved when the soil fertility is raised to near the critical level [10].
Among the possible reasons for the low productivity and low fertility of RS soil, even after four decades of following fertilizer recommendations, are the high cost of fertilizers and the high demand for P in weathered soils (especially oxisols). The amount of P currently applied is below the level required to maximize soil production potential [6]. This deficiency has occurred because the fertilizer recommendations were based on calibration field studies performed in the 1960s and 1970s when conventional tillage were used; few P and K calibration studies have been conducted using no-till systems. Currently, crops have a greater genetic production potential and are cultivated using no-till systems and other new techniques that may require higher fertilizer doses.
The recommended doses of P2O5 and K2O fertilizers to correct the fertility of the soil in the state of Rio Grande do Sul are 120, 60, and 30 kg·ha−1 to increase the fertility of soil with very low, low, and average levels to the critical nutrient level, respectively [11]. In addition, the clay level is used to determine the critical level of P in the soil. If the soil has a clay level higher than 600 g·kg−1, the critical level for P extracted using the Mehlich-1 (M1) method is 6.0 mg·kg−1 and the P levels used are the following: very low (0 - 2.0 mg·kg−1), low (2.1 - 4.0 mg·kg−1), and average (4.1 - 6.0 mg·kg−1). Therefore, 120, 60, and 30 kg·ha−1 of P2O5 are needed to elevate the P concentrations to the critical level; dividing the difference between 6 mg·kg−1 and the intermediate values of each fertility level shows that 24, 20, and 30 kg·ha−1 of P2O5, respectively, are needed to increase the P soil level by 1 mg·kg−1. The same reasoning can be used to estimate the quantity of P2O5 needed to increase the soil P levels by 1 mg·kg−1 in other clay level classes, such as those with 400 - 600, 200 - 400, or <200 g·kg−1, where the P critical levels determined by the M1 method are 9, 12, and 21 mg·kg−1, respectively. The fertilization recommendations to correct the soil fertility in the Brazilian savannah (Cerrado biome), where oxisols similar to RS soils predominate, are much higher than those for the RS: 280, 140, and 70 kg·ha−1 for very low, low, and average fertility levels, respectively [12]. The authors state that the amount of P2O5 necessary to elevate the soil P level by 1 mg·kg−1 is approximately 50 kg·ha−1, much higher than that in RS, but the recommendations for savannahs are based on the clay level. The P and K fertilization recommendations to correct fertility for both the savannah biome and RS can be performed in a single application or with higher than standard doses over the course of 2 - 3 years. The needed fertilization doses for soybeans and maize in the savannah biome are also higher than the doses recommended for RS.
The cultivation systems used in RS have significantly changed over the years. The following alterations are underscored: most of the fields are cultivated using a no-till system, which has a nutrient availability dynamic different from those using the conventional system; in a no-till system, the soil sample depth is measured in the layer with the highest nutrient concentration levels (0 - 10 cm); the average yield of the major crops has increased over time, with a consequent increase of nutrient usage; and finally, the current M1 soil analysis method is not appropriate for measuring P in soils that receive natural phosphates when efficient, inexpensive, and practical alternative methods are available. The aims of this study were to measure the P and K levels as extracted by the M1, Mehlich-3 (M3) and resin methods in soil samples from the 0 - 10 and 0 - 20 cm deep layers of soil cultivated using a no-till system and to estimate the P2O5 and K2O doses necessary to elevate the P and K levels in the soil by 1 mg·kg−1.
2. MATERIALS AND METHODS
The experiments used in this study were conducted by several educational, research, and co-op institutions in RS, Brazil (Figure 1), and in some soil types that are representative of the major agricultural areas for soybeans, wheat, and maize in the state.
The experiments included different cultivation periods, growth times, experimental designs, treatments, and institutional goals. In the experiments selected, soil samples were obtained from treatments with increasing doses of P and K cultivated under a no-till system. Table 1 shows the applied doses of P2O5 and K2O, institutions conducting the experiments, locations, soils, crop years,
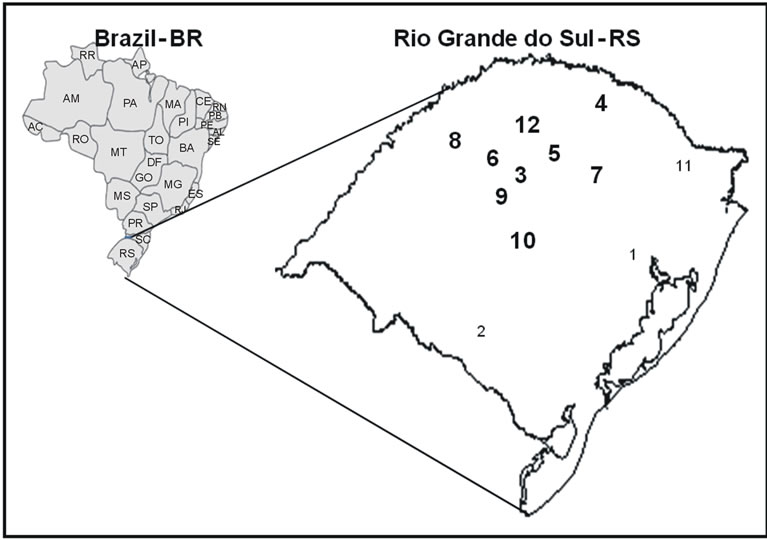
Figure 1. Schematic map of Brazil and Rio Grande do Sul with experimental areas shown: 1: Eldorado do Sul, 2: Bajé, 3: Tapera and Não-me-Toque, 4: Erechim, 5: Palmeira das Missões, 6: Ijuí, Condor and Ajuricaba, 7: Passo Fundo, Marau, 8: Santo Ângelo, 9: Cruz Alta, Ibirubá, 10: Santa Maria, 11: São Francisco, 12: Coronel Bicaco, Redentora, Santo Augusto, São Valério. Areas in bold traditionally produce soybeans, wheat, and maize; the other areas traditionally produce cattle pasture and other crops, such as maize and rice.
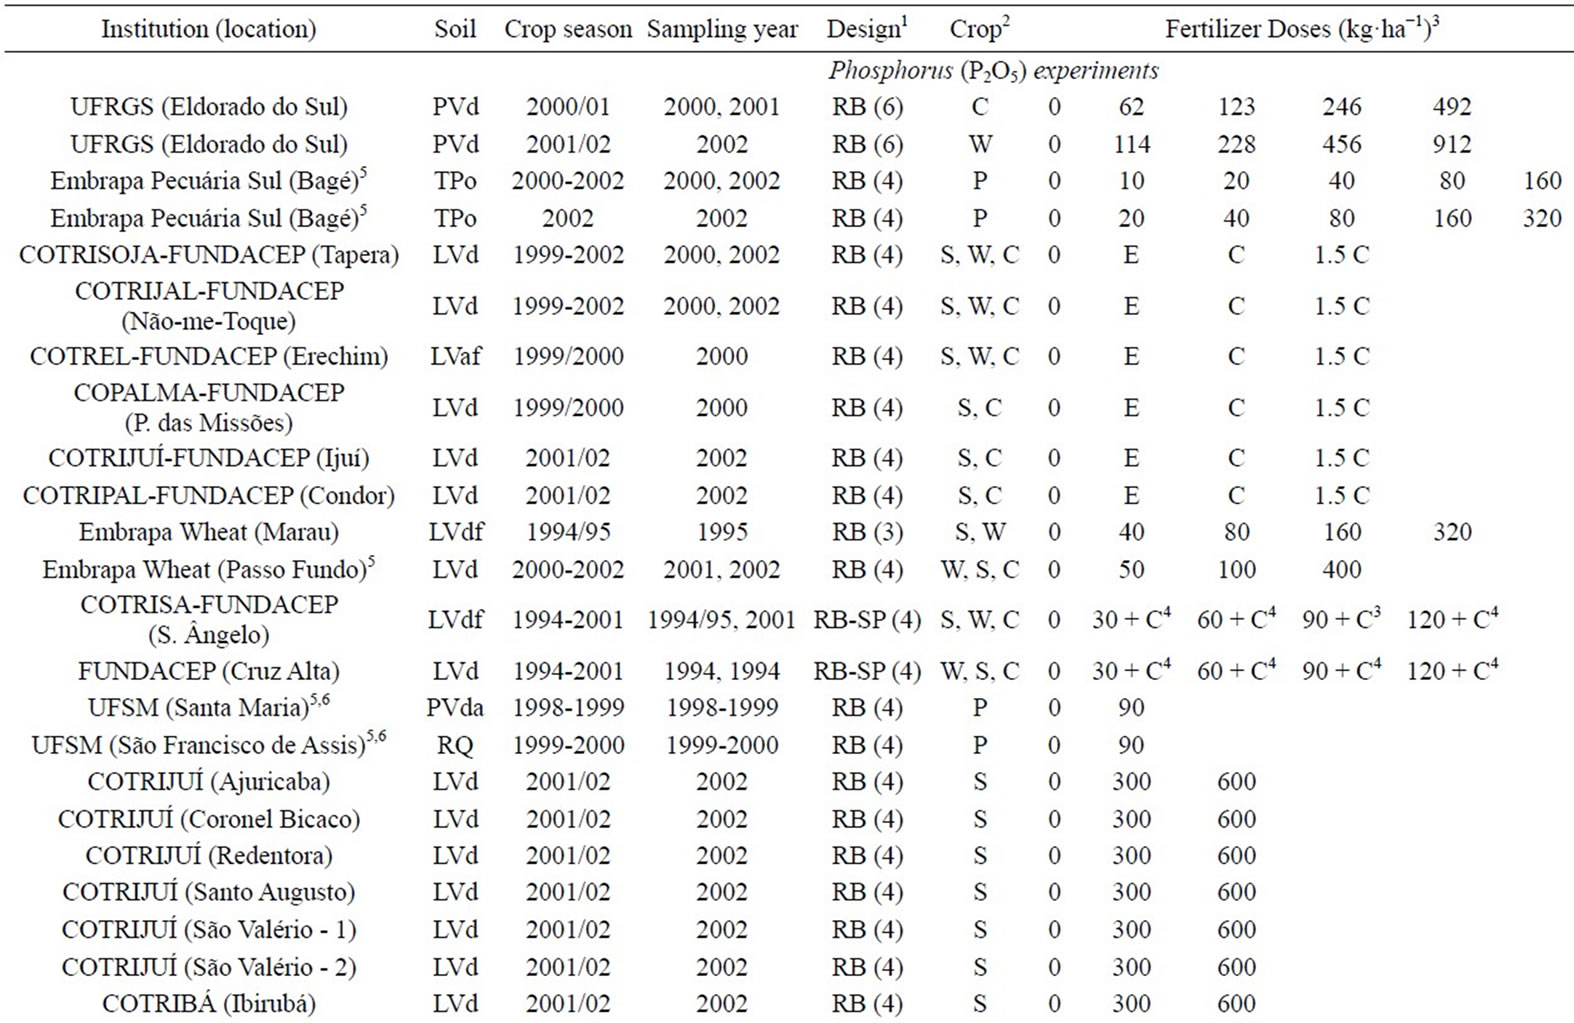
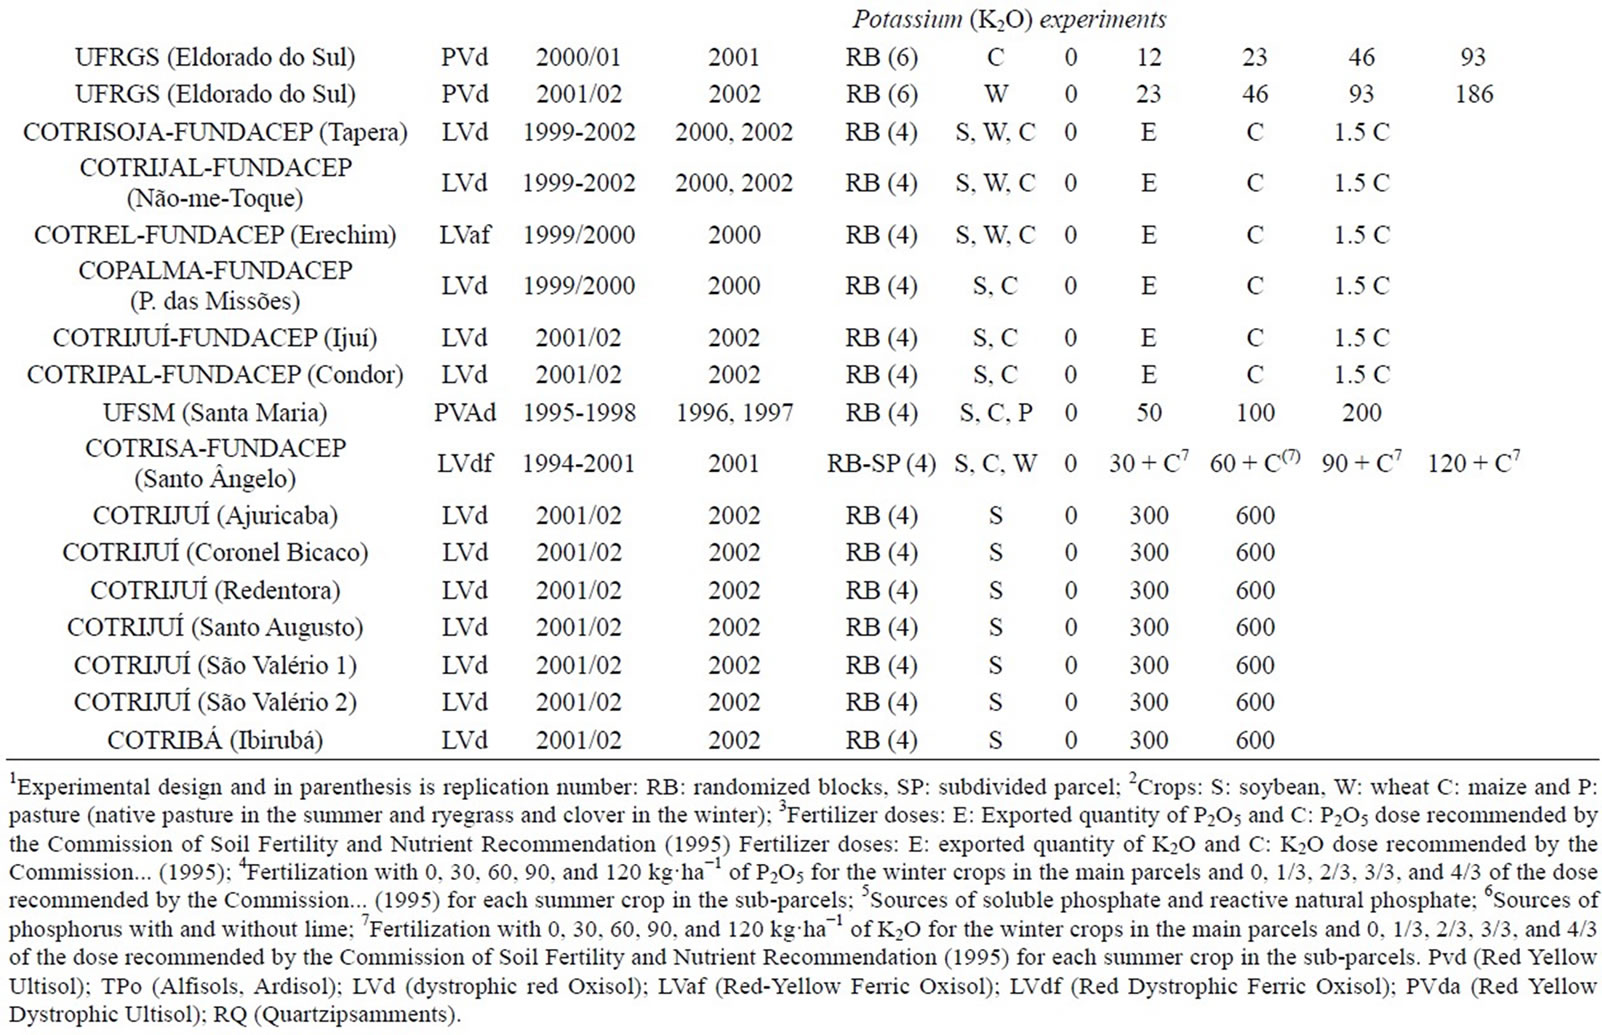
Table 1. Doses of P2O5 and K2O applied in the experiments at different institutions, areas, soils, and years of cultivation along with the soil sampling, experimental design and crops grown.
soil sampling, experimental design, and crop types. More details on the experiments can be found in [6] and in [8]. The soil samples from each plot contained a minimum of four subsamples and soils were sampled using a shovel from layers 0 - 10 and 0 - 20 cm deep over an area 10/5 cm wide/thick. The soil samples from the 0 - 20 cm layer were taken because this layer was the standard for the conventional cultivation system (soil layer that was moved to add the fertilizer) and during the no-till implementation period.
Use samples from 0 - 10 cm soil layer is recommended for areas that have been under no-till for more than five years [11] for several reasons: (1) there is likely only a superficial concentration of P and K levels; (2) fertilizer is applied to this layer; and (3) most of the plants roots develop in and absorb nutrients from this layer. In addition, studies have demonstrated that the fertility in this layer is highly correlated with nutrient absorption in plants and with grain yield [13]. For the experiments conducted in Bagé municipality, the plots were 8 m2 and were later divided into two plots of 4 m2. The other experiments had a minimum plot of 28.8 m2. The soil samples were dried at 40˚C - 45˚C in a forced-air circulation oven, ground in a hammer mill and sieved (2 mm). The P and K concentrations in the soil samples were measured using the M1 and resin methods according to the procedures described in [14] and by the M3 method according to the procedures described in [15]. All of the laboratory protocols were performed in duplicate, and the average of the two results is shown.
The regression analyses for the P2O5 and K2O doses applied to the soil and the soil P and K levels were calculated using the SIGMAPLOT and SIGMASTAT software through the first and second-degree polynomial equations that provided the best fit of the data. In the regression analyses of experiments where several crops were grown with a single fertilizer application, the same doses were used for all samples. For the experiments that had more than one application of fertilizer, the sum of the applied doses was applied until the soil sample was collected. The estimate for the amount of P2O5 needed to increase the soil P content by 1 mg·kg−1 was obtained for each function by dividing by 1 the values of the coefficient “b” of the functions of the increases in P level in the soil according to the doses of P2O5. The estimate of the amount of K2O needed to increase the K levels in the soil by 1 mg·kg−1 was obtained the same way, but using the data from experiments with potassium fertilization.
3. RESULTS AND DISCUSSION
3.1. Phosphorus and Potassium Extracted in Soils
The P (Tables 2 and 3) and K (Table 4) levels estimated by the polynomial functions (coefficient “b”) and extracted by the M1, M3, and resin methods had increased values in all of the assessments as P2O5 and K2O, respectively, were added. The vast majority of these increases were statistically significant. This result was expected and was independent of the soil type, sample depth, phosphorus source, and P and K extraction methods. Second-degree (quadratic) polynomial functions had more occurrences than first-degree (linear) functions for P and K (Tables 2 and 4). The equations with the highest coefficients of determination (r2) were selected. Linear equations predominated in experiments with natural phosphate doses (Table 3). [16], in a P calibration study performed on soils in Paraguay, only used linear equations to estimate the P level increase when they added doses of soluble P2O5.
The average P levels extracted by M1 from parcels that did not receive phosphate fertilizer and estimated by the polynomial functions (coefficient “a” of the functions) were always lower than the levels estimated by the M3 and resin methods (Tables 2 and 3). [6] and [7] also found that lower levels of P were extracted by M1 compared to M3 and resin in soils from RS. The lower P extraction using M1 and the higher extraction by the M3 and resin methods is linked to the extraction principles.
The M1 method extracts less phosphorus in clay soils than in sandy soils [17] due, in part, to a partial neutralization of the extraction buffer and a readsorption of solubilized phosphorus [18,19]. However, when natural phosphate is used, soil phosphate determination is uncertain, as the M1 method extracts more phosphorus than what is really available to the plants, overestimating its level and underestimating the amount of fertilizer that should be used on the crops [15,20,21]. In addition, the M1 method can also be less accurate, partially due to the limitations of the method, facilities, personnel, equipment, and temperature changes during extraction.
The resin method is recommended for measuring P levels in the soils of RS and Santa Catarina (SC) states [11]. This method extracts P from the soil solution, and, therefore, more phosphorus ions from the solid phase go into the soil solution to maintain the chemical equilibrium, partially simulating the nutrient supply to the plants. Thus, soils with more P buffer have a higher extraction level than indicated by the M1 method [17].
The M3 method contains dilute and buffered weak acids that preferentially dissolve phosphorus bound to aluminum, iron, and, to a lesser extent, calcium. Therefore, this method does not overestimate the amount of phosphorus available to the plants when natural phosphate fertilizers are used [15]. The method is also fast, easy to perform and economical because it simultaneously extracts macronutrients (P, K, Ca, Mg, and Na) and micronutrients (Fe, Cu, Zn, and Mn). Therefore, it is efficient
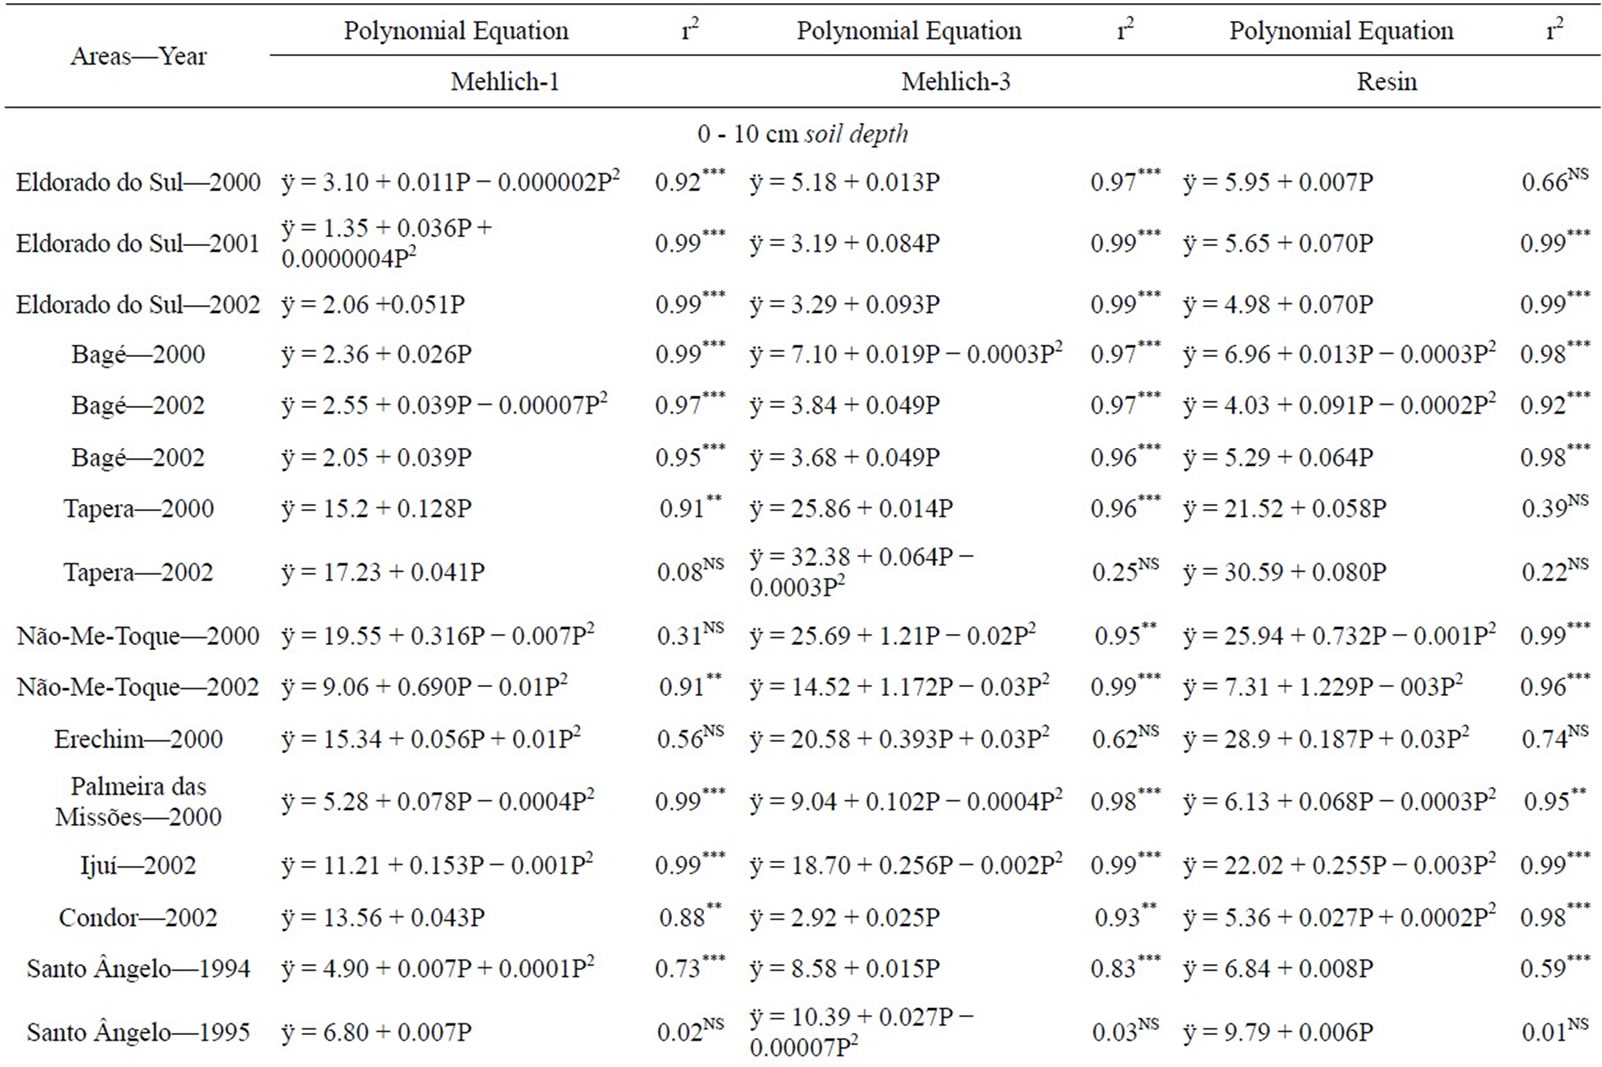
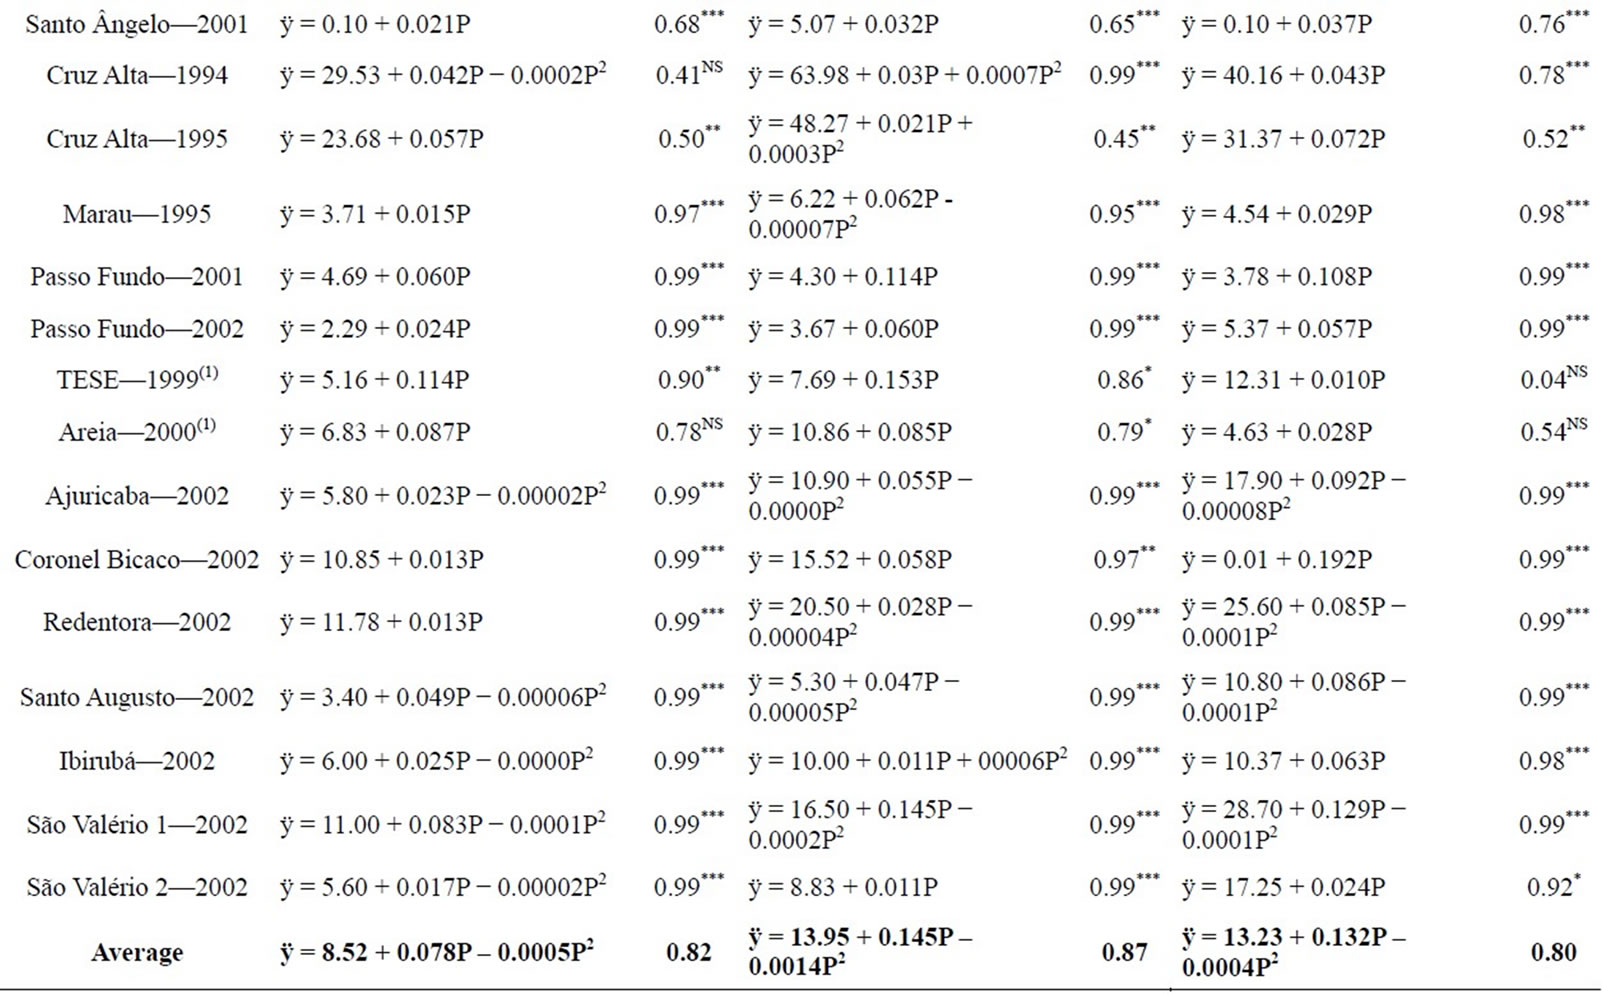
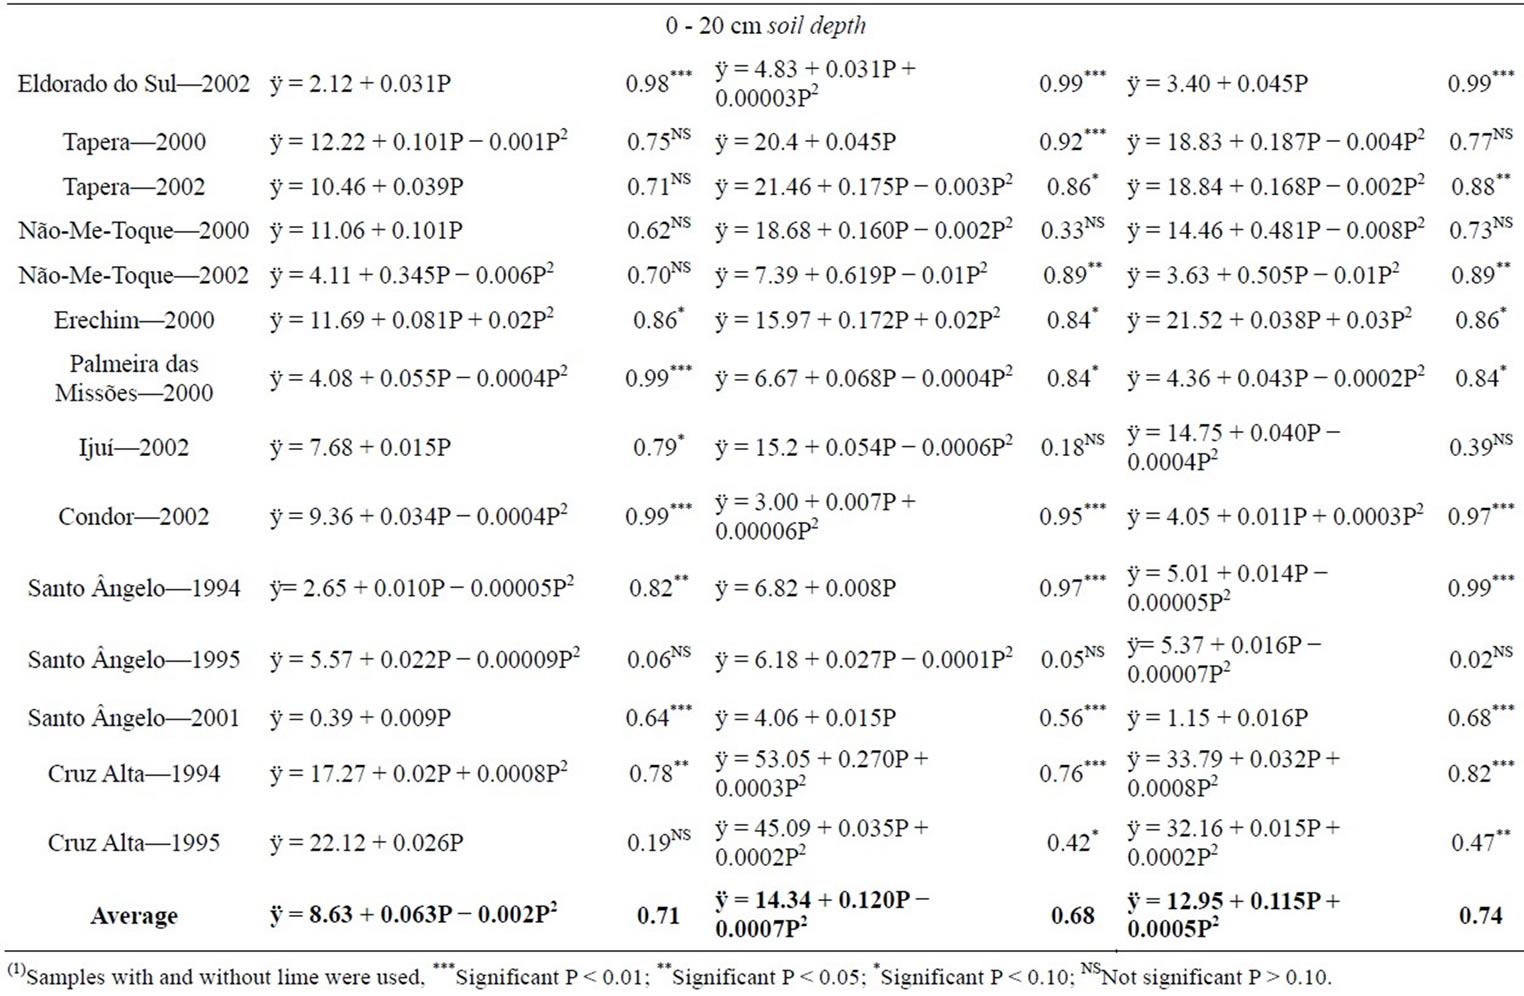
Table 2. Polynomial equations and coefficients of determination for topsoil samples (0 - 10 and 0 - 20 cm depth) in experiments on soils under no-till across locations with phosphorus doses determined by different soil test methods.
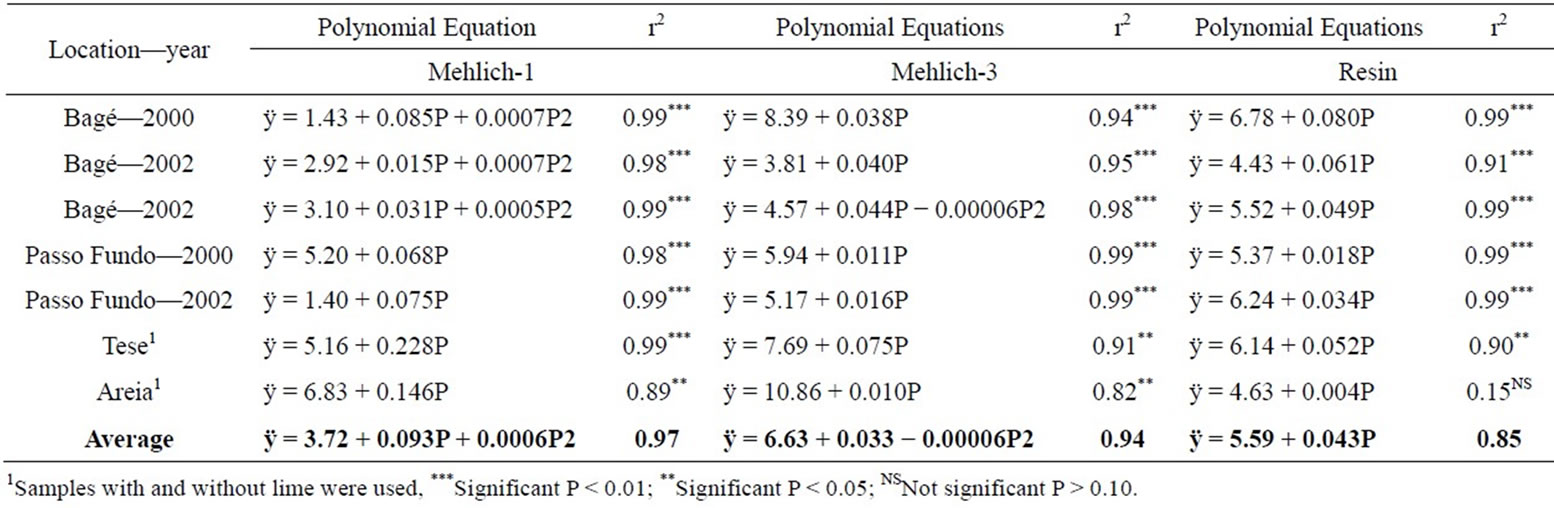
Table 3. Polynomial equations and coefficients of determination for samples from the 0 - 10 cm deep soil layer in experiments performed on soils cultivated using a no-till system in various areas with various doses of natural phosphate, as determined by different analysis methods.
for routine lab use [22] and for use on the soils found in southern Brazil [7].
3.2. Increase of Phosphorus and Potassium in Soils
The coefficients of determination (r2) of the polynomial functions were significant for most of the functions that explain the increase in P (Tables 2 and 3) and K (Table 4) levels when P2O5 and K2O, respectively, were added to the soil. The average coefficients of determination for the P levels measured using the M1, M3, and resin methods were always higher in the 0 - 10 cm deep layer soil samples (Table 2) compared to the 0 - 20 cm deep samples (Table 2). The average coefficients of determination were also always higher in the 0 - 10 cm deep samples in which the soil had been fertilized with natural phosphates (Table 3) compared to soils fertilized with soluble phosphates (Table 2).
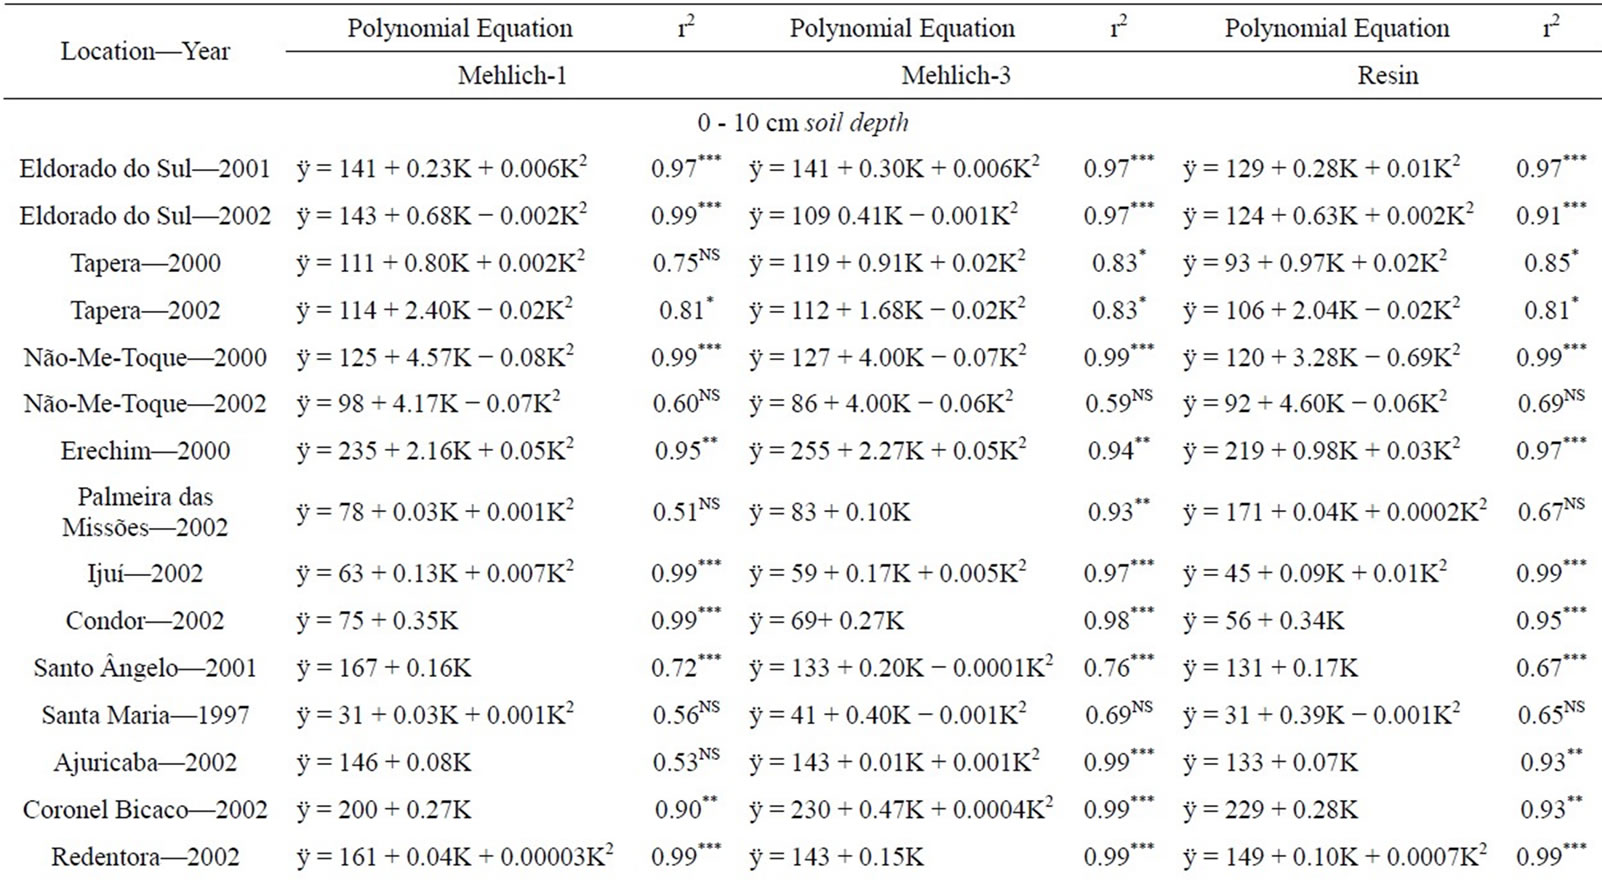
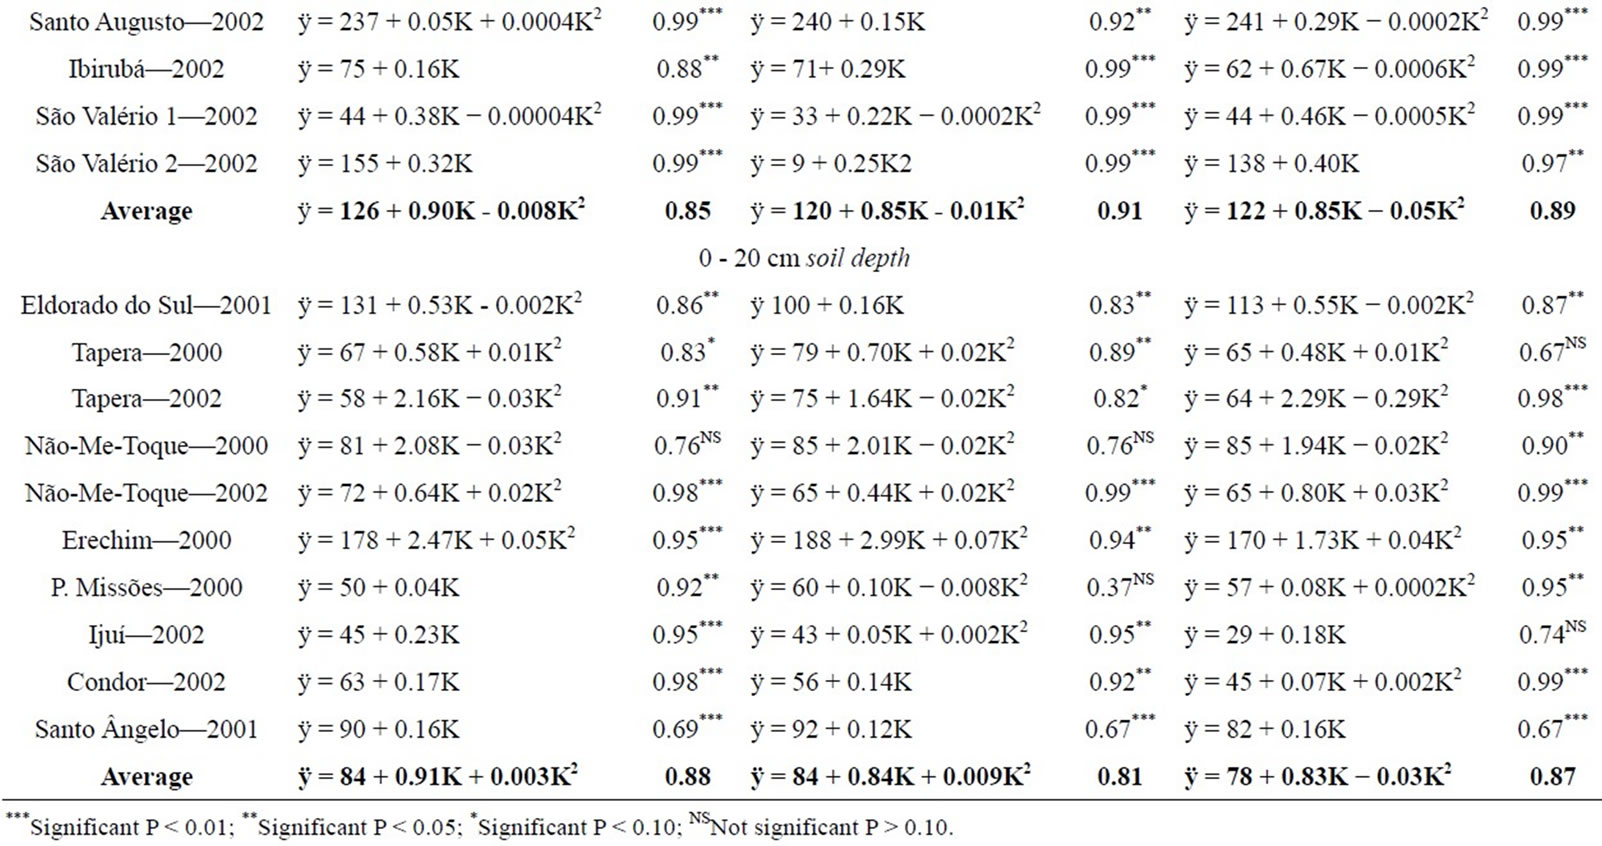
Table 4. Polynomial equations and coefficients of determination for samples from the 0 - 10 cm and 0 - 20 cm deep soil layer from experiments performed on soils cultivated using a no-till system in several areas with various doses of potassium, as determined by different analysis methods.
The average coefficients of determination that estimate the increase in K levels as increasing doses of K2O were added to the soil were higher in the 0 - 10 cm deep than in the 0 - 20 cm deep samples (Table 4) when K was extracted using the M3 and resin methods. However, when K was extracted by M1, the highest average coefficients of determination were in the 0 - 20 cm deep samples. This pattern was expected because the same dose of potassium fertilizer, which is less reactive and more mobile in the soil, is twice as diluted in the 0 - 20 cm samples as in the 0 - 10 cm samples. In addition, a large part of the K absorbed by the plants remains in the plant residues and returns to the soil after cultivation, as shown by [23] in several cover crops grown using a no-till system. The authors showed that, independent of the species grown, approximately 75% of the accumulated K returns to the soil 30 days after harvest. This behavior favors K accumulation in the superficial soil layers. [24] found K levels 30% higher in the 0 - 10 cm layer than in the 0 - 20 cm layer in long-term crop studies using a no-till system.
3.3. Fertilization with Phosphorus and Potassium to Increase Their Concentration in Soils
The average amounts of P2O5 needed to increase the P levels in the soil by 1 mg·kg−1 were much higher than the average amounts of K2O needed to increase K levels in the soil by 1 mg·kg−1, independent of the sample depth and the P and K extraction method (Table 5). The average amount of P2O5 required to increase the P level by 1 mg·kg−1 when soluble phosphate sources were used was always higher in the 0 - 20 cm deep layer compared to the 0 - 10 cm deep layer, independent of the extraction method. The same quantity of P is diluted in a larger volume of soil in the 0 - 20 cm layer, increasing the probability of P absorption by iron (Fe) and aluminum (Al) oxides, compared with the 0 - 10 cm layer.
The average amount of P2O5 required to increase the P levels by 1 mg·kg−1 when sources of natural phosphates were used was lower when P was extracted by M1 than when P was extracted by M3 and resin. M1 is an acidic extraction buffer that, when it reacts with natural phosphate (basic reaction), extracts a large portion of the phosphorus that is not available in natural soil conditions; this leads to an overestimation of P availability to the plants [20,21]. When P was extracted by the M3 and resin methods, the average amount of P2O5 applied in the form of natural phosphate needed to increase P levels in the soil by 1 mg·kg−1 was higher than the average amount of soluble phosphate sources needed to increase P levels in the soil by 1 mg·kg−1 in the 0 - 10 cm deep layer soil samples. This greater necessity of P2O5 from natural phosphates is likely due to their lower solubility in the soil and because the M3 and resin extractors do not overestimate P extraction, as M1 does [15,20,21]. To increase P by 1 mg·kg−1, as measured by M1, 39.9 and 38.1 kg·ha−1 of P2O5 were required in the 0 - 20 and 0 - 10 layers, respectively (Table 5). These amounts were higher than the 24, 20, and 30 kg·ha−1 estimated in the fertilization guidelines for clay soils in RS in the very low, low, and average fertility ranges [11], respectively, and lower than the 50 kg·ha−1 reported by [12]. [16] found lower P2O5 requirements for increasing soil P by 1 mg·kg−1 when extracted by M1 from the 0-10 cm deep soil layer with an average of 25.7 kg·ha−1 or of 18.2 and 35.3 kg·ha−1 for soils with a history of adequate and limited fertilization, respectively. [16] study evaluated only
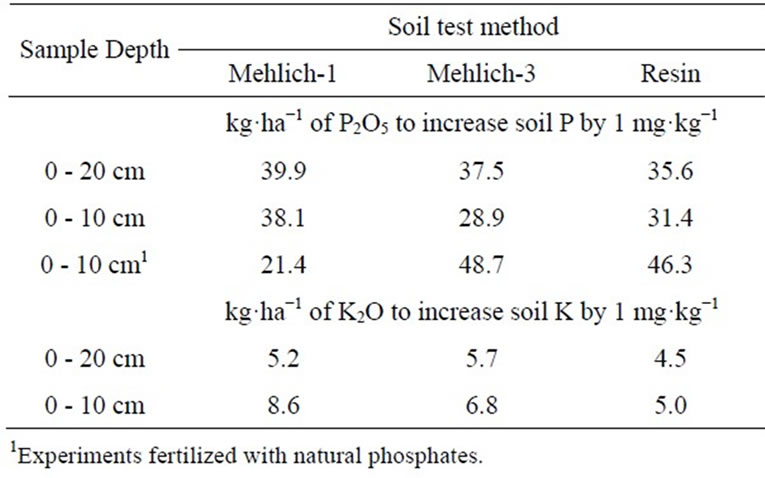
Table 5. Average amounts of P2O5 and K2O needed to increase the P and K levels by 1 mg·kg−1 in soils cultivated using a no-till system and sampled at different depths.
three soils with a history of limited fertilization, and the amounts of P2O5 required to increase the P level extracted by M1 by 1 mg·kg−1 were 46.9, 31.9, and 27.0 kg·ha−1 P2O5, respectively. In this study, 31 soil samples from the 0 - 10 cm deep layer were tested in 21 experiments (Table 2). [6] used the method proposed by [25] and also found that lower amounts of P2O5 were required to increase the P levels in the soil by 1 mg·kg−1 using the M1, M3, and resin methods for extraction from the 0 - 10 and 0 - 20 cm deep layers. The M1 method showed P2O5 requirements of 31.1 and 17.2 kg·ha−1 for the 0 - 20 and 0 - 10 cm layers, respectively.
The average amount of K2O required to increase K levels in the soil by 1 mg·kg−1, as extracted by the M1, M3 and resin methods, was always higher in the 0 - 10 cm layer than in the 0 - 20 cm layer (Table 5). This finding contrasted with the results found for P. The higher K requirements in the 0 - 10 cm layer compared with the 0 - 20 cm layer are likely due to the higher concentration of organic matter near the soil surface, which occurs in no-till cultivation systems. Organic matter in heavily weathered soils in tropical regions is responsible for 70 to 90% of the cation-exchange capacity (CEC) [26].
There is a superficial concentration of some fertility traits, such as P, K [24], Ca, and Mg concentrations [27,28] as well as CEC and organic matter, in soils cultivated using no-till systems. Increases in organic matter increases the soil’s CEC; thus, K may suffer from greater competition for the negative charges on the organic material and on the clay particle surfaces [11], requiring a higher K2O dose to increase the extractable (exchangeable) soil K levels by 1 mg·kg−1.
3.4. Impact on Phosphorus and Potassium Recommendations to Crops
The crop fertilizer recommendations based on calibration studies from various recommendation programs rely on fertility levels that are, in turn, dependent on the clay levels in the soil. Clay levels influence the volumetric humidity of the soil and the diffusion of nutrients towards the root surface. In clay soils, the critical levels of P, measured by the M1 method in RS state, are lower than those in sandy soils [11]. The critical levels are 6, 9, 12, and 21 mg·kg−1 of P for soils with clay levels of >600, 600 - 410, 400 - 210, and <210 g·kg−1 of soil, respectively.
The critical level is lower in clay soils than in sandy soils because the nutrient supply available to the plants is higher in clay soils; in addition, P extraction by the M1 method is lower due to the decreased acidification power of the extraction buffer, thus decreasing phosphorus dissolution and resulting in readsorption and a lower final extraction. These characteristics are validated by strong correlations between the soil P extraction and crop yields [16,17].
The doses of P in the fertilization recommendation for RS are lower in sandy soils than clay soils because the losses to adsorption by iron and aluminum oxides are lower, improving the efficiency of the use of this nutrient [11]. Studies on the adsorption of P show that the adsorption is greater in soils with more clay (higher Fe and Al oxide concentrations) and lower in sandy soils. Thus, more P2O5 should be needed to increase the soil P by 1 mg·kg−1 in clay soils than in sandy soils. [17] confirms that the amount of P2O5 required to increase soil P levels, as extracted by M1 from the 0 - 20 cm deep layer, by 1 mg·kg−1 is higher in clay soils than sandy soils. For soils with clay levels of >550, 550 - 410, 400 - 260, 250 - 100, and <100 g·kg−1, the amounts of P2O5 needed to raise the soil P level by 1 mg·kg−1 were 30, 20, 15, 10, and 7.5 kg·ha−1, respectively. When using the M3 method for measurement, significantly higher P2O5 requirements for increasing soil P levels by 1 mg·kg−1 in soils with higher clay contents were found only for the 0 - 10 cm deep soil layer fertilized with soluble phosphate and natural phosphate. When using the resin method for measurement, significantly higher P2O5 requirements for increasing soil P levels by 1 mg·kg−1 in soils with higher clay contents were found only for the 0 - 10 cm deep layer fertilized with natural phosphate (Table 6).
In the other experiments, there was only a tendency towards increased P requirements as the soil clay levels increased. These significant correlations concur with the buffering capacity reported by [6,12,17], in which the soils with the most clay needed higher doses of P2O5 to increase their P levels.
A slight negative trend was found in the P2O5 quantity needed to increase soil P levels by 1 mg·kg−1 as the soil P level increased (Table 6). Based on the Langmuir (type L) isothermic adsorption model for P, it was expected that as P soil levels increase, there should be a decrease in the
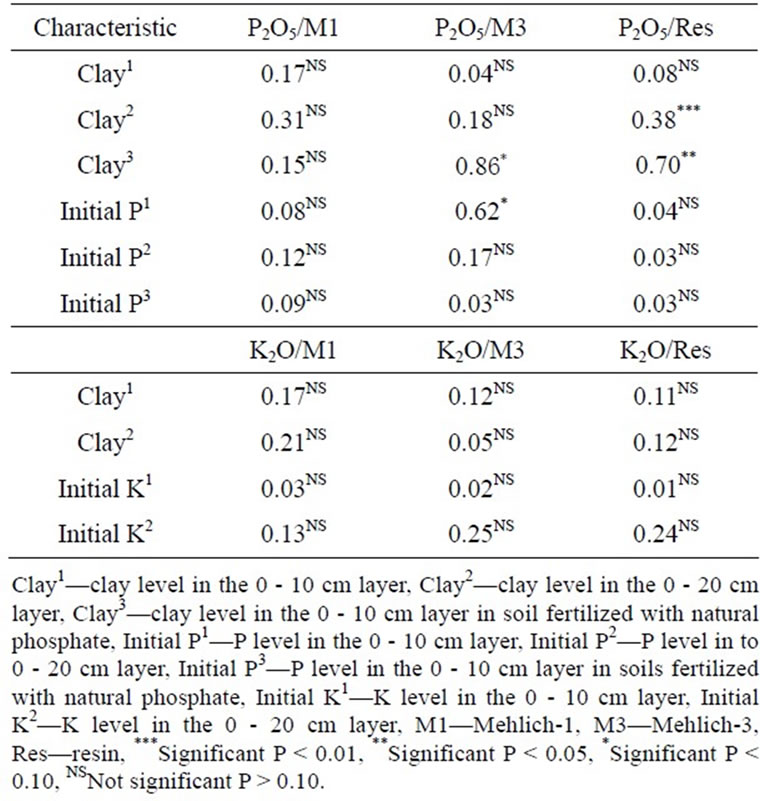
Table 6. Correlation coefficients (r) between soil characteristics (Table 1) and the doses of P2O5 and K2O necessary to increase the soil P and K levels by 1 mg·kg−1 (Tables 2 and 4), as measured by Mehlich-1, Mehlich-3 and resin.
amount of P2O5 needed to increase the soil P levels by 1 mg·kg−1. When soil P levels are higher, one would expect that the majority of Fe and Al would have already adsorbed P, and, thus, new applications of P should result in less adsorption. The fertilization recommendation manuals for RS [11] and for the Brazilian savannah region [12] show this tendency towards decreasing P2O5 doses needed to elevate P by 1 mg·kg−1.
No significant correlations were found between the K2O doses necessary to elevate the K levels in the soil by 1 mg·kg−1 and clay levels or initial K levels, independent of the sample depths and the methods for measuring K (Table 6). The same tendencies were found for K as for P: higher doses were needed as the clay levels increased, and lower doses were needed as the initial K levels increased.
The soils in RS vary widely in their mineral, chemical and physical features. They can be fertilized with products that have different reactivity levels, such as natural phosphates that solubilize when they contact the Mehlich-1 acidic solution, overestimating the availability of P to the plants [15,20,21]. Thus, the soil analysis methods can differentially estimate the nutrient quantities necessary for the plants and for increasing soil fertility. Choosing the soil analysis method that best fits the soil type and management applied is fundamental. In reality, plants absorb the soil nutrients, and various profile depths and measurement methods only attempt to correlate the measured levels with crop yield. When the nutrients P and K occur at less than the critical levels, as measured by calibration at a particular depth, the data in Table 5 can be used to increase the levels of these nutrients to the desired values.
4. CONCLUSION
Phosphorus and potassium levels increased in the 0 - 10 and 0 - 20 cm deep soil layers, but the amount they increased depended on the phosphate fertilizer source added and on the P and K extraction method used. The amount of fertilization with P2O5, which needed to increase P levels by 1 mg·kg−1, was higher for the 0 - 20 cm layer than the 0 - 10 cm deep layer of the soil, and the amount of fertilization with K2O, which needed to increase K levels by 1 mg·kg−1, was higher in the 0 - 10 cm layer than in the 0 - 20 cm deep layer. Highly weathered soils such as tropical soils cultivated under no-till might require more P and K amounts to obtain considerable crop yields.
5. ACKNOWLEDGEMENTS
Authors are thankfully to all Universities and agricultural extensions programs from Rio Grande do Sul State that kindly support this work allowing access in their experiments to collect information and to support us with crop yield and crop biomass data.
REFERENCES
- CONAB—Companhia Nacional De Abastecimento (2010) Acompanhamento da Safra Brasileira de grãos. http://www.conab.gov.br/
- Anghinoni, I. and Bohnen, H. (1975) Soil fertility survey in Santa Rosa region. Agronomia Sulriograndense, 11, 289-301. (in Portuguese)
- Tedesco, M.J., Goepfert, C.F. and Lanzer, E. (1984) Soil fertility evaluation in soils of Rio Grande do Sul state. Agronomia Sulriograndense, 20, 179-184. (in Portuguese)
- Drescher, M., Bissani, C.A. and Giasson, E. (1995) Soil fertility evaluation of Soils from Rio Grande do Sul State and lime and fertilizers demand. UFRGS Soils Department, Porto Alegre, 24p. (in Portuguese)
- Rheinheimer, D.S., Gatiboni, L.C. and Kaminski, J. (2001) Soil fertility status in soils from Rio Grande do Sul state. Technical Report, Federal University of Santa Maria, Santa Maria, 41p. (in Portuguese)
- Schlindwein, J.A. and Gianello, C. (2008) Calibration of phosphorus extraction methods in soils cultivated under no-tillage. Revista Brasileira de Ciência do Solo, 32, 2037-2049. (in Portuguese) http://dx.doi.org/10.1590/S0100-06832008000500025
- Bortolon, L., Schlindwein, J.A. and Gianello, C. (2009) Soil phosphorus and potassium extractant in soils under no till. Ciência Rural, 39, 2400-2407. (in Portuguese) http://dx.doi.org/10.1590/S0103-84782009005000173
- Schlindwein, J.A., Bortolon, L. and Gianello, C. (2011) Calibration of potassium soil test methods in soils under no tillage system. Revista Brasileira de Ciência do Solo, 34, 1669-1678. (in Portuguese) http://dx.doi.org/10.1590/S0100-06832011000500021
- FecoAgro/RS (2004) Crop production costs in soils under no till in Southern Brazil. FecoAgro/RS, Porto Alegre, 35p. (in Portuguese)
- Cate, R.B. and Nelson, L.A. (1973) Discontinuous models for rapid correlation, interpretation and utilization of soil analysis and fertilizer response data. International Soil Fertility Evaluation and Improvement Program [S.l.], Technical Bulletin, 7, North Carolina. 77p.
- Comissao de Fertilidade do Solo—RS/SC (2004) Fertilizers and lime recommendations to crops in the Rio Grande do Sul and Santa Catarina States. 10th Edition, SBCS—Núcleo Regional Sul: UFRGS, Porto Alegre, 400p. (in Portuguese)
- Souza, D.M.G. and Lobato, E. (2002) Cerrado: Soil correction and fertilization. Embrapa Cerrados, Planaltina de Goiás, 416p. (in Portuguese)
- Costa, S.E.V.G.A., Souza, E.D., Anghinoni, I., Flores, J.C.P., Cao, E.G. and Holzschuh, M.J. (2009) Phosphorus and root distribution and corn growth as related to longterm tillage systems and fertilizer placement. Revista Brasileira de Ciência do Solo, 33, 1237-1247 (in Portuguese). http://dx.doi.org/10.1590/S0100-06832009000500017
- Tedesco, M.J., Gianello, C. and Bissani, C.A. (1995) Analysis of soils, plants and others materials. Soil Science Department of University of Rio Grande do Sul State, São Francisco de Paula, 147p. (in Portuguese).
- Mehlich, A. (1984) Mehlich-3 soil test extractant: A modification of Mehlich 2 extractant. Communications in Soil Science and Plant Analysis, 15, 1409-1416. http://dx.doi.org/10.1080/00103628409367568
- Cubilla, M.M., Amado, T.J.C., Wendling, A., Eltz, F.L.F. and Mielniczuk, J. (2007) Calibration of phosphorus fertilization rates for main grain crops under no-till in Paraguay. Revista Brasileira de Ciência do Solo, 31, 1463- 1474. (in Portuguese) http://dx.doi.org/10.1590/S0100-06832007000600023
- Schlindwein, J.A. and Gianello, C. (2008) Level of sufficiency and equivalence index between phosphorus determined for methods ionic resin exchange and Mehlich-1. Revista Brasileira de Agrociencia, 14, 299-306. (in Portuguese)
- Kamprath, E.J. and Watson, M.E. (1980) Conventional soil and tissue test for assessing the phosphorus status of soil. In: Khasawneh, F.E., Sample, E.C. and Kamprath, E.J., Eds., The role of Phosphorus in Agriculture, America Society of Agronomy, Madison, 433-469.
- Novais, R.F. and Smyth, T.J. (1999) Phosphorus in plant and soil under tropical conditions. UFV, Viçosa, 399p.
- Perrot, K. and Kear, M. (2004) Influence of cation exchange on extraction of soil phosphate. Communications in Soil Science and Plant Analysis, 35, 461-470. http://dx.doi.org/10.1081/CSS-120029725
- Schlindwein, J.A., Bortolon, L. and Gianello, C. (2011) Soil phosphorus available for crops and grasses extracted with three soil-test methods in Southern Brazilian soils amended with phosphate rock. Communications in Soil Science and Plant Analysis, 42, 283-292. http://dx.doi.org/10.1080/00103624.2011.538881
- Van Raij, B. (1994) New diagnostics techniques, universal soil extractants. Communications in Soil Science and Plant Analysis, 25, 799-816. http://dx.doi.org/10.1080/00103629409369081
- Giacomini, S.J., Aita, C., Hübner, A.P., Lunkes, A., Guidini, E. and Amaral, E.B. (2003) Phosphorus and potassium release during decomposition of crops residues in no-tillage system. Pesquisa Agropecuária Brasileira, 38, 1097-1104. (in Portuguese) http://dx.doi.org/10.1590/S0100-204X2003000900011
- Schlindwein, J.A. and Anghinoni, I. (2000) Vertical variability of available phosphorus and potassium and depth of soil sampling in no tillage system. Ciência Rural, 30, 611-617. (in Portuguese) http://dx.doi.org/10.1590/S0103-84782000000400009
- Kussow, W.R., Corum, K.R. and Dallacqua, F.M. (1976) Inperpretation of agro-economic of fertilizers plots. Embrapa, Sobral, 49p. (in Portuguese)
- Pavan, M.A. (1985) Chemical and mineralogical characteristics of selected acid soils of the state of Paraná. Turrialba, 35, 131-139.
- Nolla, A. and Anghinoni, I. (2006) Liming criteria for soybean in established no-tillage system. Revista Brasileira de Ciencia do Solo, 30, 475-483. (in Portuguese) http://dx.doi.org/10.1590/S0100-06832006000300009
- Nicolodi, M., Anghinoni, I. and Gianello, C. (2008) Soil acidity indicators for liming in no-tillage systems. Revista Brasileira de Ciência do Solo, 32, 237-247. (in Portuguese). doi10.1590/S0100-06832008000100023