Agricultural Sciences
Vol.4 No.7(2013), Article ID:33861,5 pages DOI:10.4236/as.2013.47047
Application of cross-validation technique for zoning of groundwater levels in Shahrekord plain
![]()
1Karoon Watershed Management Office (KWMO), Organization of Natural Resources, Shahrekord, Iran; *Corresponding Author: feldmanc@mail.montclair.edu
2Range and Watershed Management, Faculty of Agriculture and Natural Resources, University of Hormozgan, Iran
3Range and Watershed Management, Faculty of Agriculture and Natural Resources, University of Shahrekord, Shahrekord, Iran
Copyright © 2013 Mostafa Moradi Dashtpagerdi et al. This is an open access article distributed under the Creative Commons Attribution License, which permits unrestricted use, distribution, and reproduction in any medium, provided the original work is properly cited.
Received 23 May 2013; revised 15 June 2013; accepted 25 June 2013
Keywords: Disgunctive Kriging; Groundwater Levels; Radial Basis Function; Shehrekord Plain
ABSTRACT
Water is one of the essential natural resources for the development of life on the earth. In this study we apply Disjunctive Kriging (DK) and Radial Basis Functions (RBF) for zoning of groundwater levels. In study area the groundwater levels data have high skewness. Due to samples unsuitable distribution, data was normalized using logarithmic and QQPlot methods. Also geostatistical different methods were evaluated using cross-validation technique. Results showed that Disjunctive Kriging (DK) compared to Radial Basis Function (RBF) has the higher accuracy and the best model of Semivariogramis Exponential model. Also the groundwater levels decreases from north to south of the Shahrekord plain, Iran. Finally, Disjunctive Kriging was selected as the most appropriate method of investigation for the groundwater levels zoning Sahrekord plain.
1. INTRODUCTION
Water is one of the essential natural resources for the development of life on the earth. The demand for water has increased over the years, and has led to a water scarcity. Ground waters are the major resources to meet out the entire requirements [1]. According to geographical and climatic conditions, a large part of Iran situate in arid and semiarid areas that in many areas, only through the underground water resources is possible water supply needs of various parts. In the recent decade, population growth, rising demand for food and the deficiency of surface water for agricultural crops have increased the surface area of irrigation lands in Iran and this has led to change in the exploitation policy of water resources and soil. Also, this has resulted in the excavation of many wells in most regions in Iran. Therefore, excessive use of groundwater aquifers is growing [2]. The increased exploitation of groundwater resources can decrease regional water quality as a whole [3]. Moustafa et al. (2011) examined that which spatial structure measure, the semivariogram or the covariance variogram, is appropriate for inference of the spatial structure and performing interpolation of soil-water properties from sample data sets. The results showed that the covariance variogram reveals the character of spatial structure and that it is more appropriate for interpolation than the semi-variogram [4]. Yi Ju et al. (2004) applied Kriging and Cokriging methods to estimate the spatial distribution of soil properties from available large-scale survey data in Taiwan. The results suggested that by Kriging and Cokriging, the existing sampling density could be decreased under the large-scale sampling interval by nearly half and that sufficient spatial information about the soil properties could still be retained [5]. Kumar et al. (2006) applied the spatial statistical technique, Kriging, for the spatial analysis of groundwater levels. The data set consists of groundwater levels measured at about 60 points in an area of 2100 sq km in India [6].
Application of geostatistic method to interpolatewater table altitudes was studied by Dunlap and Spinazola (1984) [7]. Also method of Kriging to spatially analyze the groundwater levels was presented by Gundogdu and Guney (2007) [8]. The study was aimed at finding out the best semi-variogram with a linear trend that resulted in acceptable results in predicting the water table values based on the monthly observation data for 2002 [8].
2. MATERIALS AND METHODS
The study plain is part of Northern Karoon watershed (Shahrekord plain) in Southwest of Iran. It is located at 50˚41'17" to 51˚01'27" east longitudes and 32˚07'02" to 32˚35'6" north latitudes with about 58,461 hectare and Geology of the Cretaceous limestone formation located on alluvial deposits and include old, new and old terrace deposits is related to the Quaternary. In this study the 204 wells groundwater level data of Shahrekord plain are used as statistics references.
After preparing reference maps like geology and topography map in 1:50,000 scales, spatial variety of groundwater levels investigate with different methods of interpolation. Point data extend to area data with Disjunctive Kriging (DK) and RBF1 Methods and ArcGIS 9.3 Software. Then different methods evaluate with cross-validation technique and MAE2 and MBE3 Criteria. And finally groundwater levels were produced.
2.1. Kriging
Presentation errors map and variance reduction in weighting for estimating is the benefits of Kriging against others interpolation methods. Errors in this method are independenency from variable and dependent to spatial location and it cause to predict the best location sampling is possible. Variogram relationship based on the measured points is as follows:
 (1)
(1)
 : is the variogram for a distance (lag) h between observations
  and
and .
.
 : is the number of pairs of observations which are at distance h.
 : the observed variable.
 : the observed variable is the h distance from
  and variogram
 . Variogram is similar to variance in classic statistic but against variance that is around average, variogram show two samples differences.
The main purpose of variogram calculating is investigating variability of variable ratio distance of place or time. For this reason, it is necessary to draw a graph with summary of mean square differences of pair points that located at h as x axis. Variogram indexes are (Figure 1).
Nugget: theoretically, at zero sepration distance (i.e.lag = 0), the semivariation value should be zero. However, at an infinitesimally small separation distance, the difference between measurements often does not tend to zero. This is called the nugget effect.
The nugget effect can be attributed to measurement errors or spatial source of variation at variation at distance smaller than the sampling interval (or both): Measurement error occurs because of the error inherent in measuring devices.
Range: in model of a semivariogram, a certain distance that model level out. The distance where the model first flattens out is known as the range are spatially autocorrelated.
Sill: the value that semivariogram model attains at the range (the value on the y-axis) is called the sill. The partial sill is the sill minus the nugget.
2.2. Radial Basis Function (RBF)
Radial Basis Functions (RBF) are moderately quick deterministic interpolators that are exact. The method provides prediction surfaces that are comparable to the exact form of Kriging [9].
2.3. Validation
Validation helps us for determination the best model. Cross-validation uses all of the data to estimate the trend and autocorrelation models. It removes each data loca-
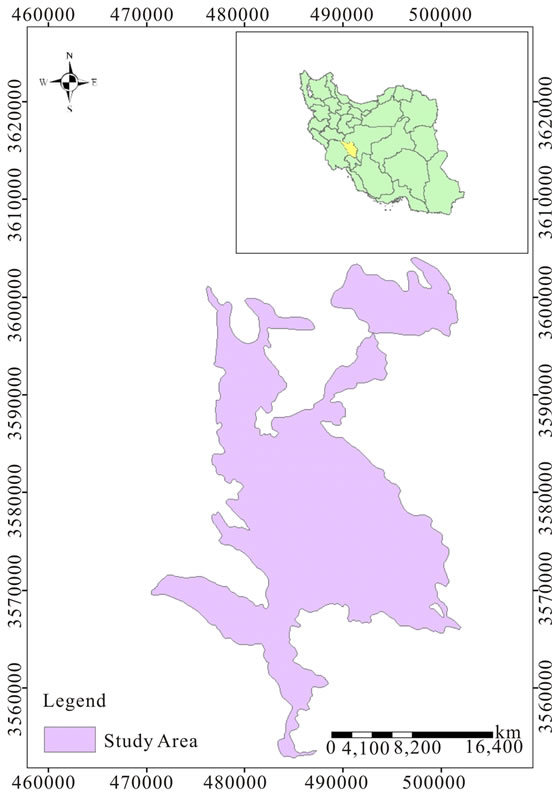
Figure 1. Study area and its position in Iran country.
tion, one at a time, and predicts the associated data value. The predicted and actual values at the location of the omitted point are compared. This procedure is repeated for a second point, and so on. For all points, cross-validation compares the measured and predicted values [9]. In this research MAE and MBE are used to evaluate predicted value with DK and RBF that are calculated with below functions:
 (2)
(2)
 (3)
(3)
where  = predicted value in xi point and
  = actual value in xi point and n = number of observations.
With the least quantity of two indexes, accuracy increase.
3. RESULTS AND DISCUSSION
Nowadays a lot of researchs have been carried out about using Geostatistical methods in different issues related to water and soil sciences [10]. Considering that studies of most researchers show that Ordinary Kriging Geostatistical methods have an acceptable precision [11- 14]. Therefore these methods have been used to preparing Groundwater levels and alluvial quality maps in this research. The condition to use Kriging method is normality of data. With exploring two methods, data histogram and QQPlot, was determined that data don’t follow a normal distribution. So, the data was transferred to the logarithmic data. Through this, data obey the normal distribution. Histogram and QQPlot diagrams of thickness and salinity logarithmic data have been shown in Figures 2 and 3 respectively.
As Histogram of logarithmic data in Figure 4 shows, Mean and Median of Groundwater levels data are very close (Median = 6.32 and Mean = 6.31). Therefore, according to low difference between Median and Mean, data have been changed to normal distribution by converting to logarithm and thereby the condition of normality for distribution of data to use the geostatistical methods was provided [15]. In Kriging method, different models such as Exponential, spherical, exponential, Gaussian and so on being used. Therefore with the use of ArcGIS 9.3 software, different kind of models were checked and finally Exponential model was selected because of the least errors indicated by the model (Figure 5). According to Table 1 Nugget = 1.48 and partial sill = 4.3Semivariogram model error (![]() ) is 40.5 percent.
) is 40.5 percent.
The results of evaluation of different approach of interpolation are shown in Table 2. Comparing these methods show that Disgunctive Kriging has best accuracy (MAE = 8.66) and least standard deviation (MBE = 0.48).
Finally, groundwater levels maps of study area by using DK and RBF produced (Figures 6 and 7).
4. CONCLUSION
Demand for the world’s increasingly scarce water supply, is rising rapidly, challenging its availability for food production and putting global food security at risk, even as demand for water by all users grows, groundwater is being depleted [16]. On the other hand, groundwater balance in Shahrekord plain is negative. This study aimed to evaluate the Disjunctive Kriging (DK) and Radial Basis Function (RBF) methods for Groundwater Levels zoning Shahrekord plain. The geostatistical analyst extension module of ArcGIS was used for exploratory data analysis, Semivariogram, and Cross-Validation of groundwater levels. MAE and MBE statistical criteria applied for different methods of evaluating geostatistical lower MAE and MBE (MBE = 0.48 and MAE = 8.66). According to the groundwater levels distribution map using DK (Figure7), the north of the Shahrekord plain has the high
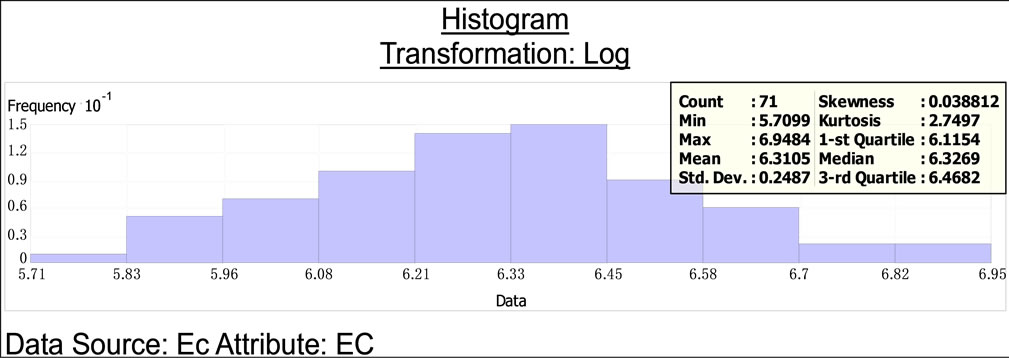
Figure 2. Histogram of logarithmic salinity data.
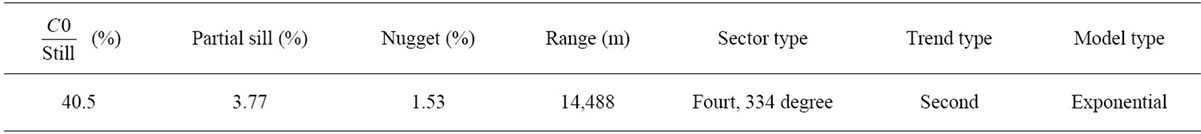
Table 1. The properties of exponential model of groundwater levels semivariogram.
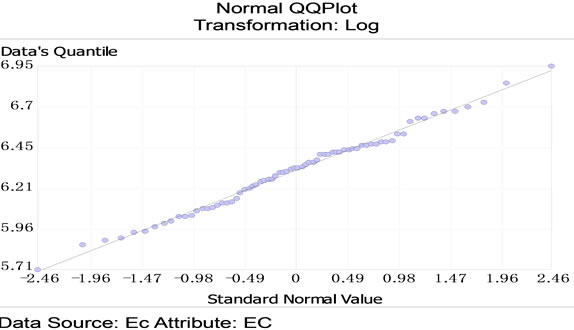
Figure 3. QQPlot of logarithmic groundwater level data.
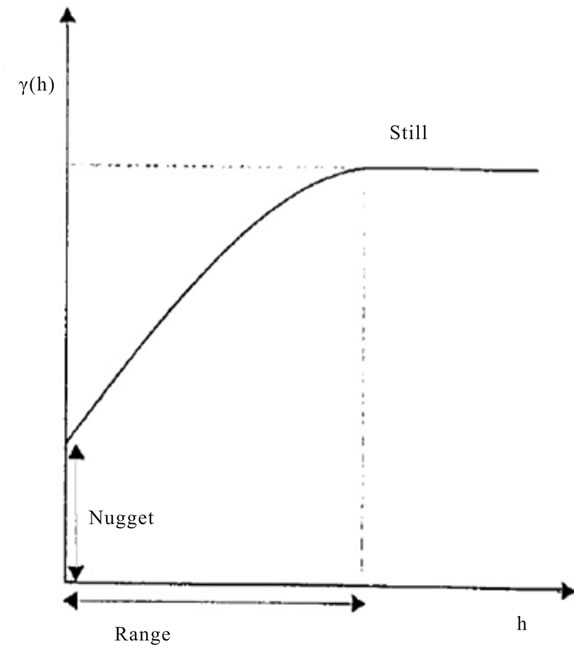
Figure 4. Components of variogram.
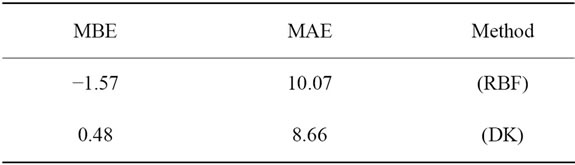
Table 2. Results of various geostatistic methods.
groundwater levels (2327 meter) and, in general, the groundwater levels decreases from north to south of the
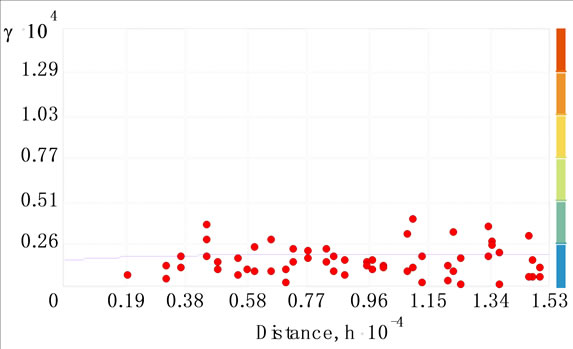
Figure 5. Semivariogram of groundwater levels using DK.
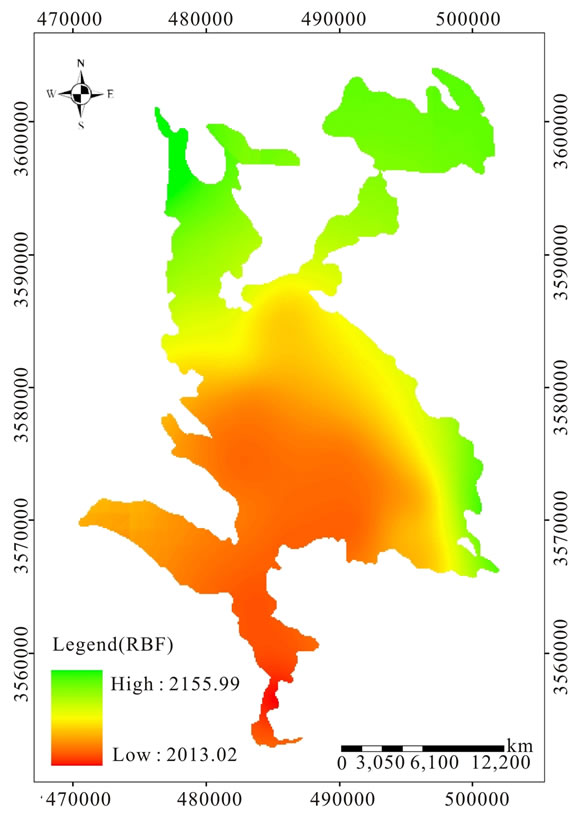
Figure 6. Grounwater levels map in Shahrekord plain using RBF model.
Shahrekord plain. On the other hand, southeast of the Shahrekord plain due to having a high-density residential and mainly agricultural, it has the lowest groundwater
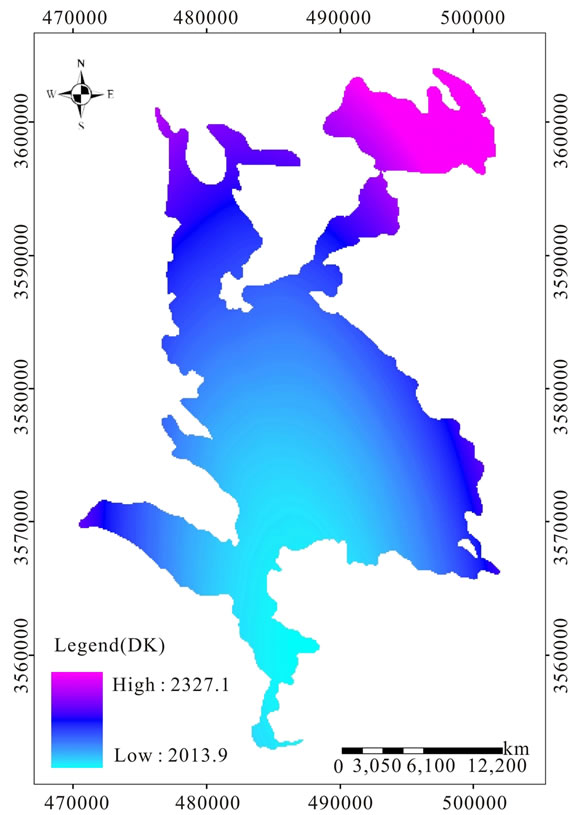
Figure 7. Grounwater levels map in Shahrekord plain using DK model.
levels (2014 meter). It can be said that due to increase of wells number and excessive water extraction in the agricultural part from north to south of Shahrekord plain groundwater levels is the lowest.
![]()
![]()
REFERENCES
- Prabaharan1, S., Manonmani, R., Ramalingam, M. and Subramani, T. (2011) Geo statistical modelling for groundwater pollution in SALEM, TAMILNADU-A GIS based approach. International Journal of Engineering Science and Technology (IJEST), 1273-1278.
- Hooshmand, A., Delghandi, M., Izadi, A. and Ahmad, K. (2011) Application of kriging and cokriging in spatial estimation of groundwater quality parameters. African Journal of Agricultural Research, 6, 3402-3408.
- Kardovani, P. (2007) The problems of waters in Iran: Salin water, Tehran, waters in Iran. University Press, Tehran, 237.
- Johnston, K., Hoef, J.M.V., Krivoruchko, K. and Lucas N. (2001) Using ArcGIS geostatistical analyst. ESRI, Redlands.
- Yu, J., Cheng, Q. and Huang, H. (2004) Analysis of the weighting exponent in the FCM. IEEE Transactions on Systems, Man, and Cybernetics, 34, 634-649.
- Ramadevi, K.V. (2006) Kriging of groundwater levels, case study. Journal of Spatial Hydrology, 6, 81-94.
- Dunlap, L.E. and Spinazola, J.M. (1984) Interpolating watertable altitudes in west-central Kansas using kriging techniques. USGS Water-Supply Paper 2238, United States Government Printing Office, Washington DC.
- Gundogdu, K.S. and Guney, I. (2007) Spatial analyses of groundwater levels using universal kriging. Journal of Earth System Science, 116, 49-55. doi:10.1007/s12040-007-0006-6
- Hooshmand, A., Delghandi, M., Izadi, A. and Ahmad, K. (2011) Application of kriging and cokriging in spatial estimation of groundwater quality parameters. African Journal of Agricultural Research, 6, 3402-3408.
- Goovaerts, P. (2000) Geostatistical approaches for incorporating elevation into the spatial interpolation of rainfall. Journal of hydrology, 228, 113-129. doi:10.1016/S0022-1694(00)00144-X
- Barcae, E. and Passarella, G. (2008) Spatial evaluation of the risk of groundwater quality degradation: Acomparison between disjunctive kriging and geostatistical simulation. Journal of Environmental Monitoring and Assessment, 133, 261-273.
- Costa, A., Durao, R., Soares, A. and Pereira, M.J. (2008) A geostatistical exploratory analysis of precipitation extremes in southern Portugahl. Statistical Journal, 6, 21- 32.
- Fetouani, S., Sbaa, M., Vanclooster, M. and Bendra, B. (2008) Assessing groundwater quality in the irrigated plain of Triffa (Nnorth-East Morocco). Journal of Agricultural Water Management, 95, 133-142. doi:10.1016/j.agwat.2007.09.009
- Phillips, D.L., Dolph, J. and Marks, D. (1992) A comparison of geostatistical procedure for spatial analysis of precipitation in mountainous terrain. Agricultural and Forest Meteorology, 58, 119-141.
- Moradi, M., Vagharfard, H., Khorani, A. and Mahmoodinejad, V. (2011) Interpolation method sin evaluation of ground water salinity zonation using cross-validation technique case study: Lowl and Shahrekord. Iranian Remote Sensing & GIS Journal, 3, 34-44.
- Rosegrant, M.W., Cai, X. and Cline, S.A. (2002) Global water outlook to 2025, averting an impending crisis. International Water Management Institute (IWMI).
NOTES
1Radial Basis Function.
2Mean Absolute Error.
3Mean Bias Error.