International Journal of Geosciences
Vol.4 No.10(2013), Article ID:41167,7 pages DOI:10.4236/ijg.2013.410130
Air-Water Carbon Dioxide Exchange in the Littoral Zone of Lake Baikal (Ice-Free Period)
1Siberian Branch of Russian Academy of Sciences, Limnological Institute, Irkutsk, Russia
2Siberian Branch of Russian Academy of Sciences, V.E. Zuev Institute of Atmospheric Optics, Tomsk, Russia
Email: pmv@iao.ru, hydrochem@lin.irk.ru
Copyright © 2013 Valentina M. Domysheva et al. This is an open access article distributed under the Creative Commons Attribution License, which permits unrestricted use, distribution, and reproduction in any medium, provided the original work is properly cited. In accordance of the Creative Commons Attribution License all Copyrights © 2013 are reserved for SCIRP and the owner of the intellectual property Valentina M. Domysheva et al. All Copyright © 2013 are guarded by law and by SCIRP as a guardian.
Received October 21, 2013; revised November 21, 2013; accepted December 15, 2013
Keywords: Gas Exchange; Carbon Dioxide Flux; Dissolved Gases; Nutrients
ABSTRACT
Lake Baikal is one of the most unique natural environments in Siberia, and it affects to a large extent the natural state in this region. Processes of gas exchange in the air-water system have been studied in Lake Baikal since 2002. Measurements have been carried out in the littoral area on the western shore of Southern Baikal (51˚51'N, 105˚04'E). The method of accumulative chambers was prioritized for measuring carbon dioxide fluxes in the air-water system. Chemical analysis of the water samples collected every three hours at the chamber locations was carried out in the on-land laboratory. We measured pH, content of dissolved oxygen, bicarbonate, nitrate and phosphate. The CO2 content in the water was measured from pH values and the bicarbonate concentration. The total sink of CO2 on the water surface is increasing in the littoral area of Lake Baikal from 20 mg∙CO2∙m−2∙day−1 in June to 110 mg∙CO2∙m−2∙day−1 in August. The decrease in the flux rate usually begins in September from 95 mg∙CO2∙m−2∙day−1 to the zero balance in late October - early November. The maximal rate of mean diurnal CO2 emissions is recorded in December in the pre-ice period (110 mg∙CO2∙m−2∙day−1). Based on the long-term measurements during all seasons, the sink of atmospheric CO2 in the littoral zones of Lake Baikal was estimated to be 3 - 5 g∙CO2∙m−2.
1. Introduction
One of the most debated problems in the study of climate change is the cause of the carbon dioxide concentration increase in the atmosphere and its effect on global warming. Consequently, much attention has been paid to regional processes and to the search for undocumented natural and anthropogenic sources and sinks that cause gas exchange in the atmosphere-underlying surface system [1]. For hydrosphere, the majority of investigations have focused on gas exchange between the atmosphere and the World Ocean, whereas information on these processes occurring in the atmosphere-freshwater system is rather limited [2-4].
Lake Baikal is one of the most unique natural environments in Siberia, and it affects to a large extent the natural state in this region [5]. The choice of Lake Baikal allows the study of this natural object not only at the regional level but also at a wider scope because the lake, to our knowledge, is the only natural laboratory in which the majority of processes occurring in the lake can be studied separately.
It is practically impossible to choose any standard among natural objects that would preserve their intrinsic properties for a long time, as all of them experience elevated anthropogenic loads and climatic changes. In this respect, the water of Lake Baikal is likely to be an exception. Long-term studies of the chemical composition of Baikal water have shown that real fluctuations in concentrations of major ions (bicarbonate, sulfate, calcium, magnesium, sodium) are within 5%, and therefore, Baikal water may be regarded as a natural standard of pure water that has a constant chemical composition, which will not change in the next few decades [5]. Hence, it is possible to properly separate physical, chemical and biological constituents in the complex process of gas exchange in the air-water system.
2. Materials and Methods
2.1. Study Site
Processes of gas exchange in the air-water system have been studied in Lake Baikal since 2002 [6-8]. Measurements have been carried out in the littoral area on the western shore of Southern Baikal (51˚51'N, 105˚04'E) within the territory of the scientific station belonging to the Limnological Institute of the Siberian Branch of the Russian Academy of Sciences.
The orography surrounding this station represents the southwestern part of the Pribaikal depression, where ridges and inter-ridge hollows extend from southwest to northeast. The sampling and measuring sites are located at the exit from the mountain valley. The station is surrounded by mountains of up to 500 m above the lake level from the northeast and west, forming an extensive bay and thus influencing the solar radiation. The sun rises here later and sets earlier than at nearby open lakes or the plain. The bottom of the lake is sandy with few stones and is covered with random vegetation, primarily with the alga Ulotrix and different species of sponges. An underwater slope with an abrupt increase of depth (up to 45 degrees) is located 100 m off the shore. Due to its enormous mass of water, the lake significantly affects the temperature regime of the adjacent territories. The air temperature above the lake is 6˚C - 8˚C lower in summer, whereas in late autumn and early winter, it is 5˚C - 10˚C higher than that in the coastal area on the mountain slopes [9].
2.2. Gas Analysis Station
The method of accumulative chambers was prioritized for measuring carbon dioxide fluxes in the air-water system [10]. The turbulent exchange above the cold water surface is significantly lower than that above land. Therefore, special demands are required to ensure the precision of the measuring equipment using the so-called micrometeorological methods [11-13]. These methods are widely used at present, and they allow measurements of gas exchange at a distance of several kilometers. Therefore, a study object should be a homogeneous ecosystem such as a woodland, bog or vast water area.
In our case, the main goal was to investigate gas exchange processes in the littoral area of the lake, i.e., in the vicinity of the interface of land-water with various surfaces. A chamber method was chosen as the most appropriate for this research because it allows a certain area of a studied surface to be studied separately. Another important advantage of the chamber method for regime monitoring is that the analytical equipment can be installed in comfortable conditions protected from external weather effects.
The shortcomings of the chamber method in our case were the effect of the equipment on the object of study and the environment in which it was located, including distortion of temperature, light, and wind fields and other factors capable of affecting gas exchange. At the same time, this method allowed us to examine the gas exchange process with a high time resolution, taking into account the introduced distortions and the appropriate correction of the results obtained. The data of the measurements carried out by means of the chamber and micrometeorological methods are in good agreement. The partial pressure of CO2 in the water was measured with an equilibrator designed by analogy with Guide [14].
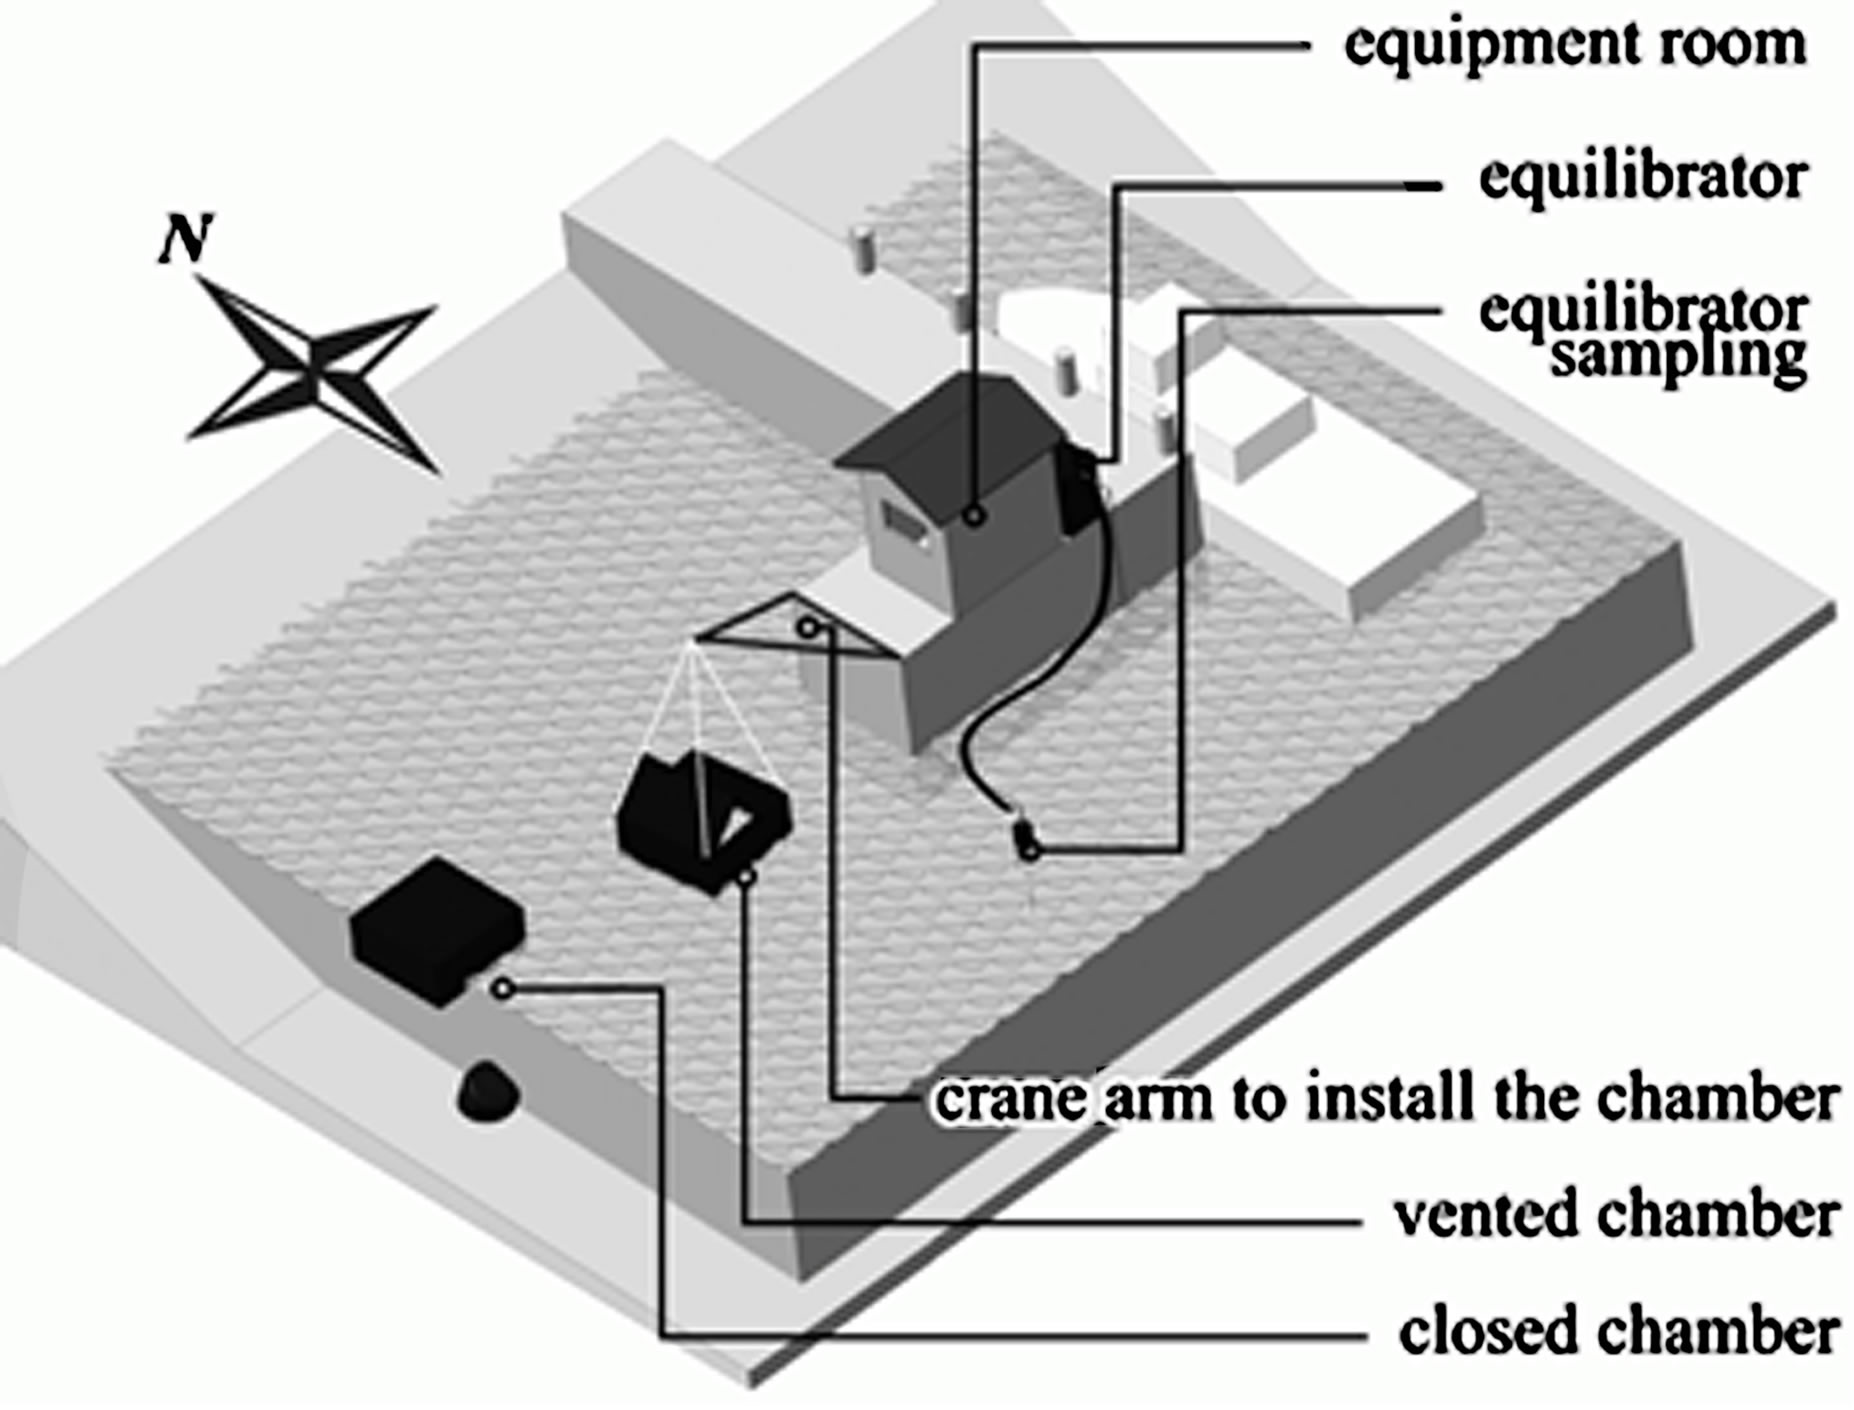
The observatory with the control and information sampling systems, the gas analysis equipment and the equilibrator was located at the end of a pier at a distance of 30 m off the shore. The depth here was 2.5 m. A pyranometer, precipitation sensor and meteorological mast were installed on the roof of the observatory. Two floating submerged chambers (Figure 1) were placed on the water surface. One chamber was continuously closed (Vcham = 0.34 m3, Scham = 1.6 m2), while another chamber was equipped with a device for automatic ventilation (Vcham = 0.32 m3, Scham = 0.81 m2). The chambers and measure-
 (a)
(a)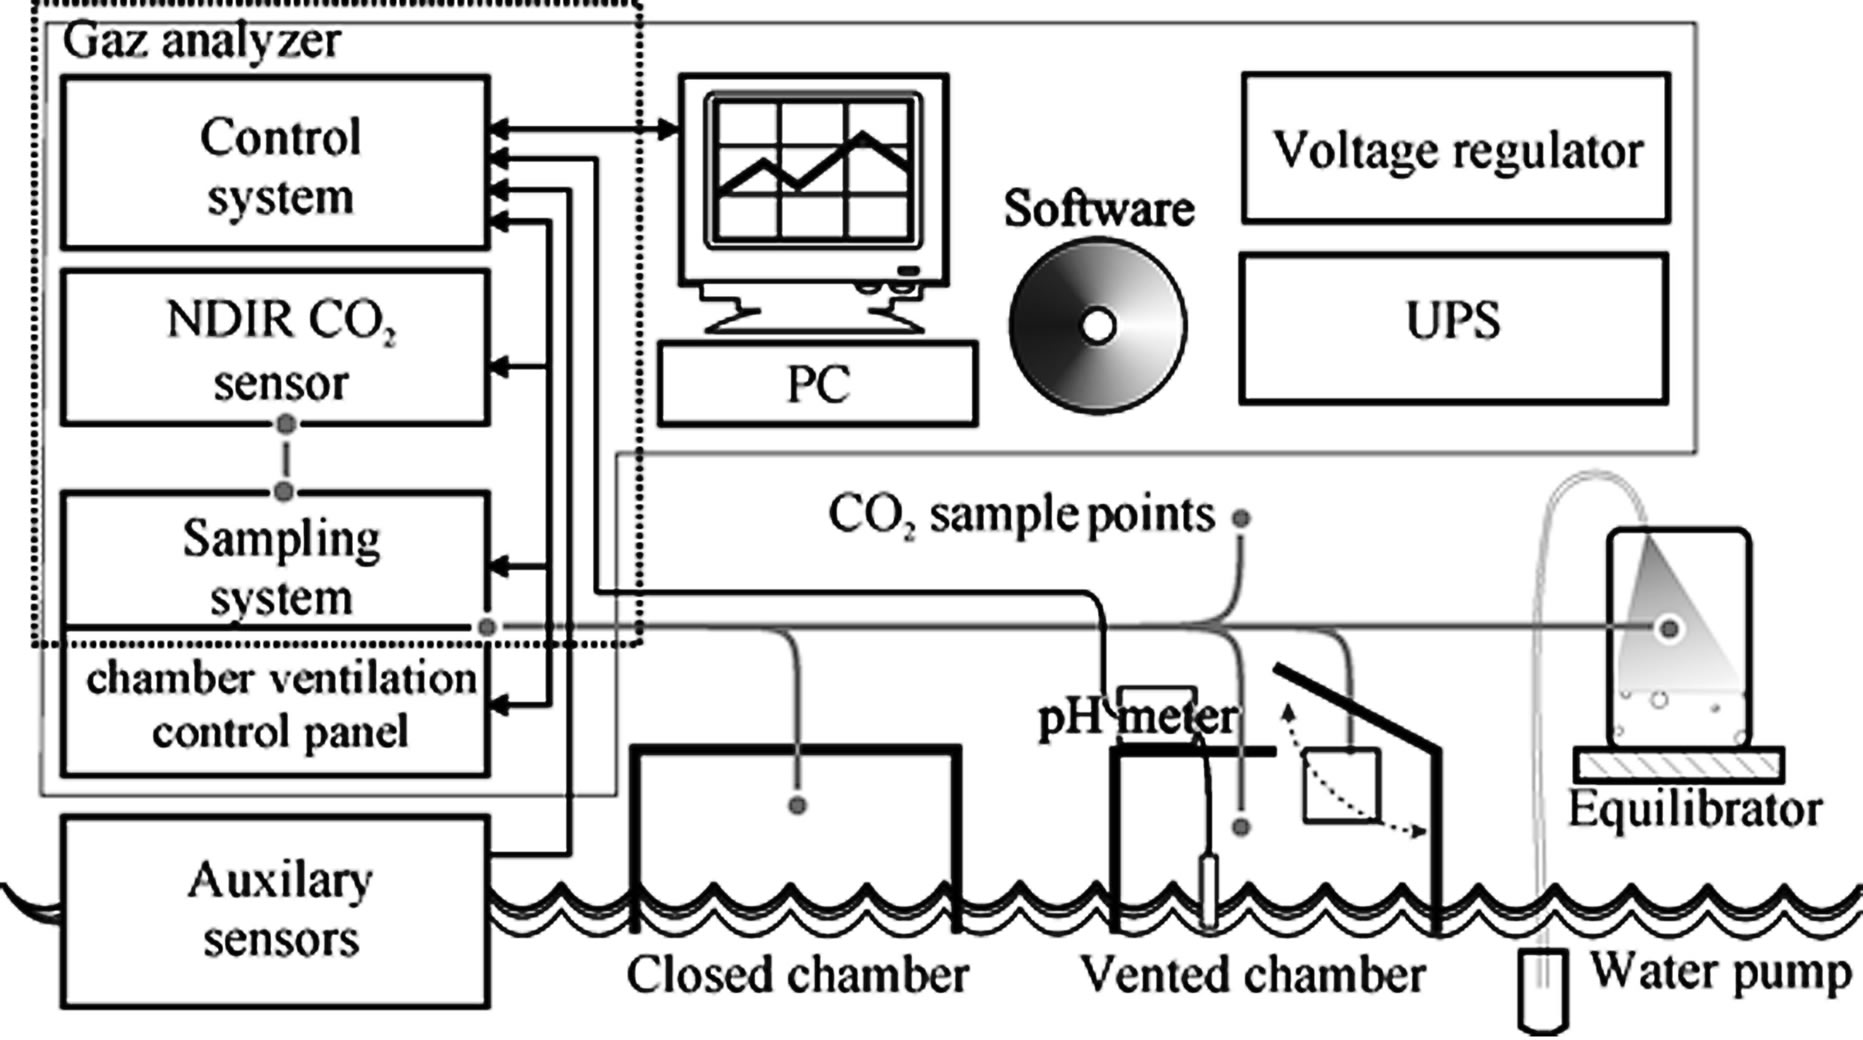 (b)
(b)
Figure 1. External view of the gas analysis station (a), blockdiagram of the instrumentation and software complex (b).
ment equipment were installed on the western side of the pier. The distance to the nearest vented chamber from the pier was 3 m. The two chambers were located approximately 30 m off the shore, and the distance between them was approximately 5 m. The pump pumped the water into the equilibrator at a distance of 2 m from the pier.
The carbon dioxide concentrations were measured in the layer of air at the water surface, the chambers and the equilibrator using a gas analyzer LiCOR-840. The sampling system consisted of 4 electronic valves controlled by the central computer. Gas was sampled every hour at four points and was pumped via pipes into the gas analyzer. Air was directly sampled from the atmosphere (1 m above the water surface) and transferred via the first channel then via the other two channels from measuring chambers and from the equilibrator via the fourth channel.
The measurements were divided into the following stages:
1) Measurements of CO2 concentrations in the layer of air at the water surface - 10 min;
2) Measurements of CO2 in the Vented chamber during ventilation - 10 min;
3) Measurements of CO2 in the Closed chamber - 10 min;
4) Measurements of CO2 in the equilibrator - 10 min;
5) Measurements of CO2 in the Vented chamber - 20 min.
Carbon dioxide flux was calculated from the increase or decrease in CO2 concentrations in the Vented chamber for the period between the end of ventilation and the fifth measuring stage, i.e., for 40 min.
Knowing the volume V and area S of the chamber, as well as the value of gas content variation in the chamber ΔC for a certain time period Δt, it was possible to calculate a flux:
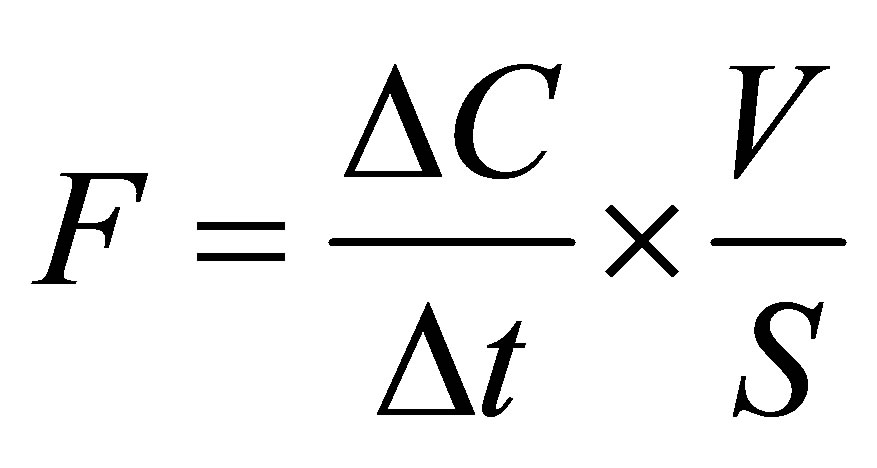 (1)
(1)
Another continuously closed chamber had an auxiliary function providing a record of the general gas exchange process.
2.3. Measurements of Chemical Parameters
Obviously, to understand the annual course of CO2 fluxes in the air-water system, it was necessary to control the main chemical components of the water participating in the photosynthesis of the aquatic biota. Chemical analysis of the water samples collected every three hours at the chamber locations was carried out in the on-land laboratory. We measured pH, content of dissolved oxygen, bicarbonate, nitrate and phosphate [15]. The CO2 content in the water was measured from pH values and the bicarbonate concentration [16]. We performed measurements almost every month from 2002 to 2010. Based on the results of our studies [17], we determined the regime of observations to be 15 - 25 days. The alteration of some synoptic cycles was recorded for this period, whereas the temperature regime of the water and the state of the aquatic biota did not exhibit significant changes. This approach, which entailed minimal costs, allowed us to obtain representative data for a concrete season.
3. Results
3.1. Seasonal Variations of Concentrations of Dissolved Gases and Nutrients in the Surface Water
Figure 2 shows seasonal mean monthly changes of CO2, O2,  and
and  concentrations in the surface water of the littoral area of Lake Baikal (ice-free period).
Considerable variations in concentrations of the chemical components were recorded in the surface water from mid-May to June. The average diurnal concentrations of carbon dioxide were 1.07 mg∙L−1 in May and gradually decreased in August (in June - 1.05 mg∙L−1, July - 0.71 mg∙L−1 and in August - 0.62 mg∙L−1). A significant gradual decrease of the average concentration of nitrates was also observed in this period (May - 0.25 mg∙L−1, June - 0.22 mg∙L−1, July - 0.20 mg∙L−1, and August - 0.06 mg∙L−1). A similar decrease was recorded in the concentrations of phosphates. The maximal content of oxygen was registered in the surface water in May, and then it decreased in August (May - 12.75 mg∙L−1, June - 12.33 mg∙L−1 and July - 12.08 mg∙L−1, and August - 9.93 mg∙L−1).
Minimal concentrations of CO2 and nutrients were recorded in the surface water of the lake in August and September (Figure 2). The decrease of photosynthetic activity and the magnification of organic matter destruc-
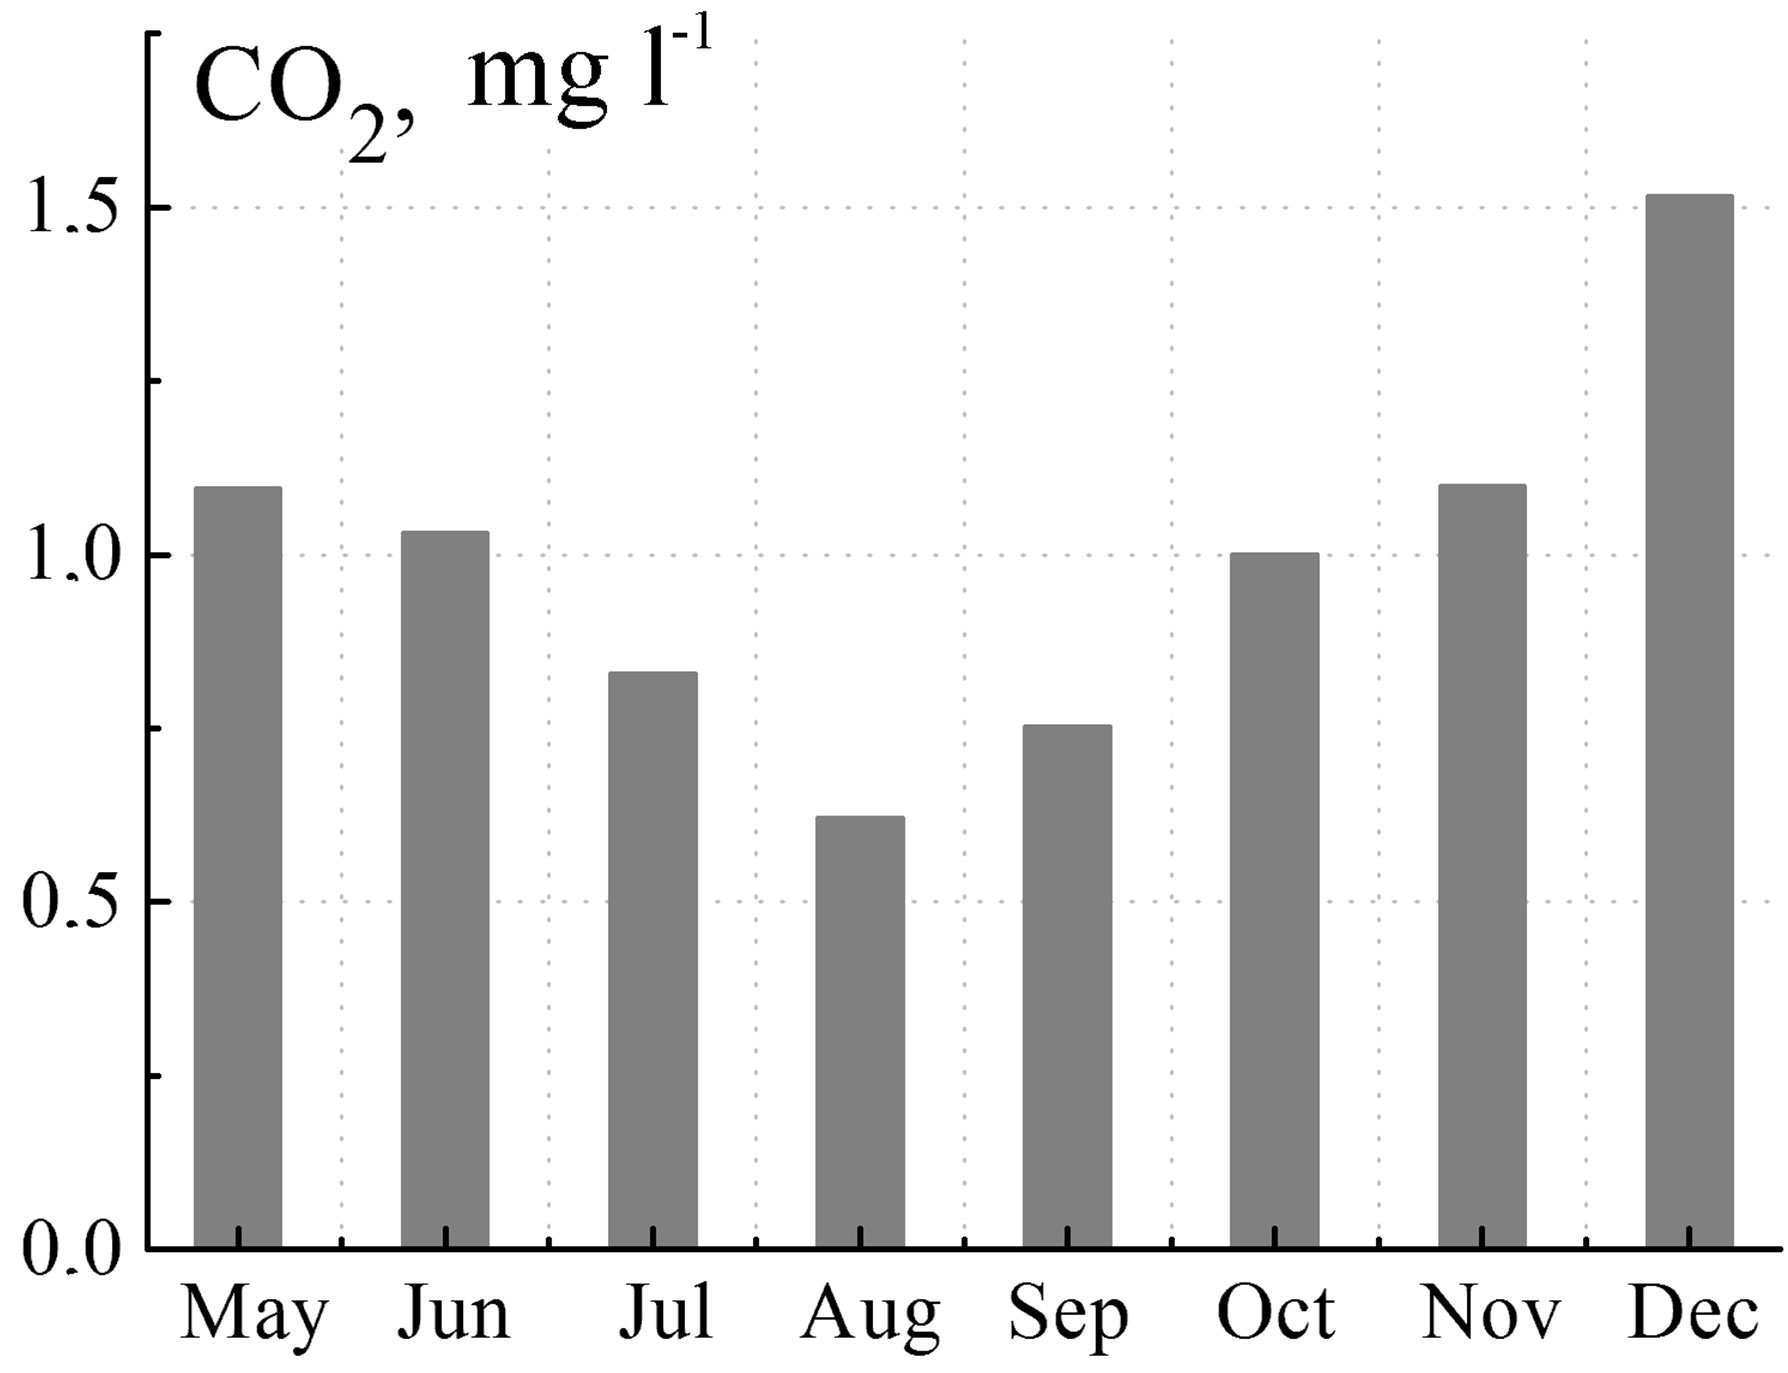
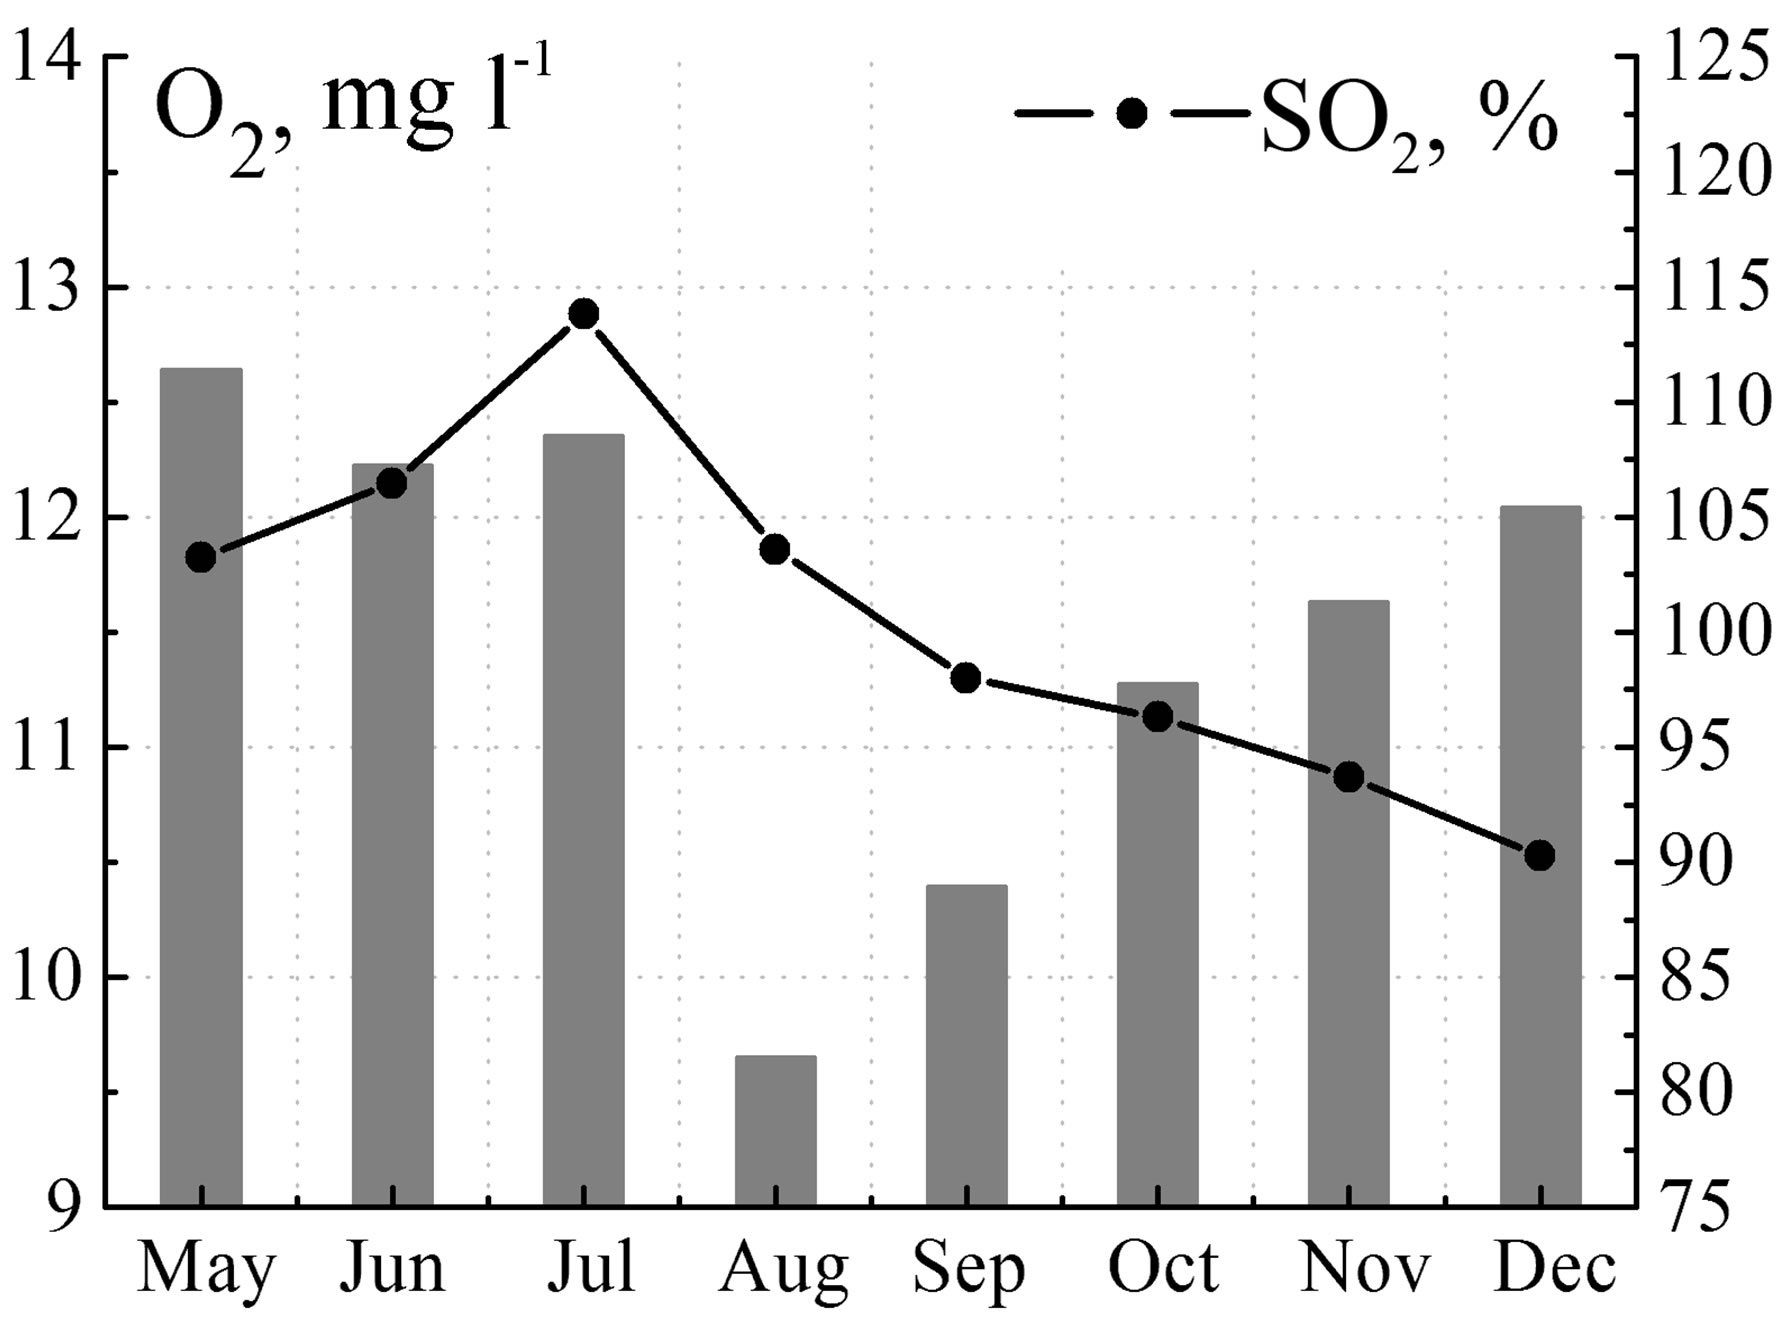


Figure 2. Seasonal variations of CO2, O2,  and
and  concentrations in the surface water of the littoral area of Lake Baikal.
tion occurring during the autumn season caused the rise of the concentrations of carbon dioxide and nutrients up to the beginning of the lake freezing. For example, from September to December, the average monthly concentrations of CO2 increased up to 1.58 mg∙L−1, nitrates - 0.38 mg∙L−1, phosphates - 0.038 mg∙L−1, and oxygen - 12.06 mg∙L−1.
3.2. Air-Water Carbon Dioxide Flux
Based on the results obtained previously [16,17] and our analysis, the variations in the concentration of CO2 in the layer of air at the water surface and in the water were more noticeable in the diurnal cycle. Figure 3 represents the long-term diurnal variation of carbon dioxide fluxes in the littoral zone of Lake Baikal from June to December. Diurnal variation was pronounced for each month during the ice-free period. Carbon dioxide emission was observed from the water surface into the atmosphere at night. At sunrise, this flux decreased and changed direction, and its maximal flux to the water surface was recorded at 3 - 4 p.m. Even in December (before freezing), when the flux was directed into the atmosphere during the day, its value decreased significantly before sunset.
3.3. Budget of Carbon Dioxide Fluxes
We obtained preliminary estimates of the balance of carbon dioxide fluxes in the littoral zone of Lake Baikal during the ice-free period based on the representative measurement data of 2004-2010.
Having integrated the daily variations of fluxes, we received a summary of budget CO2 fluxes inherent in the given measuring cycle. Interannual distinctions of both diurnal variation and mean monthly diurnal values of CO2 fluxes were, as a rule, expressed less clearly than the seasonal variations of these values (Figure 3). There are some examples for the most typical months in each hydrological season. In June of 2008, the total flux of car-
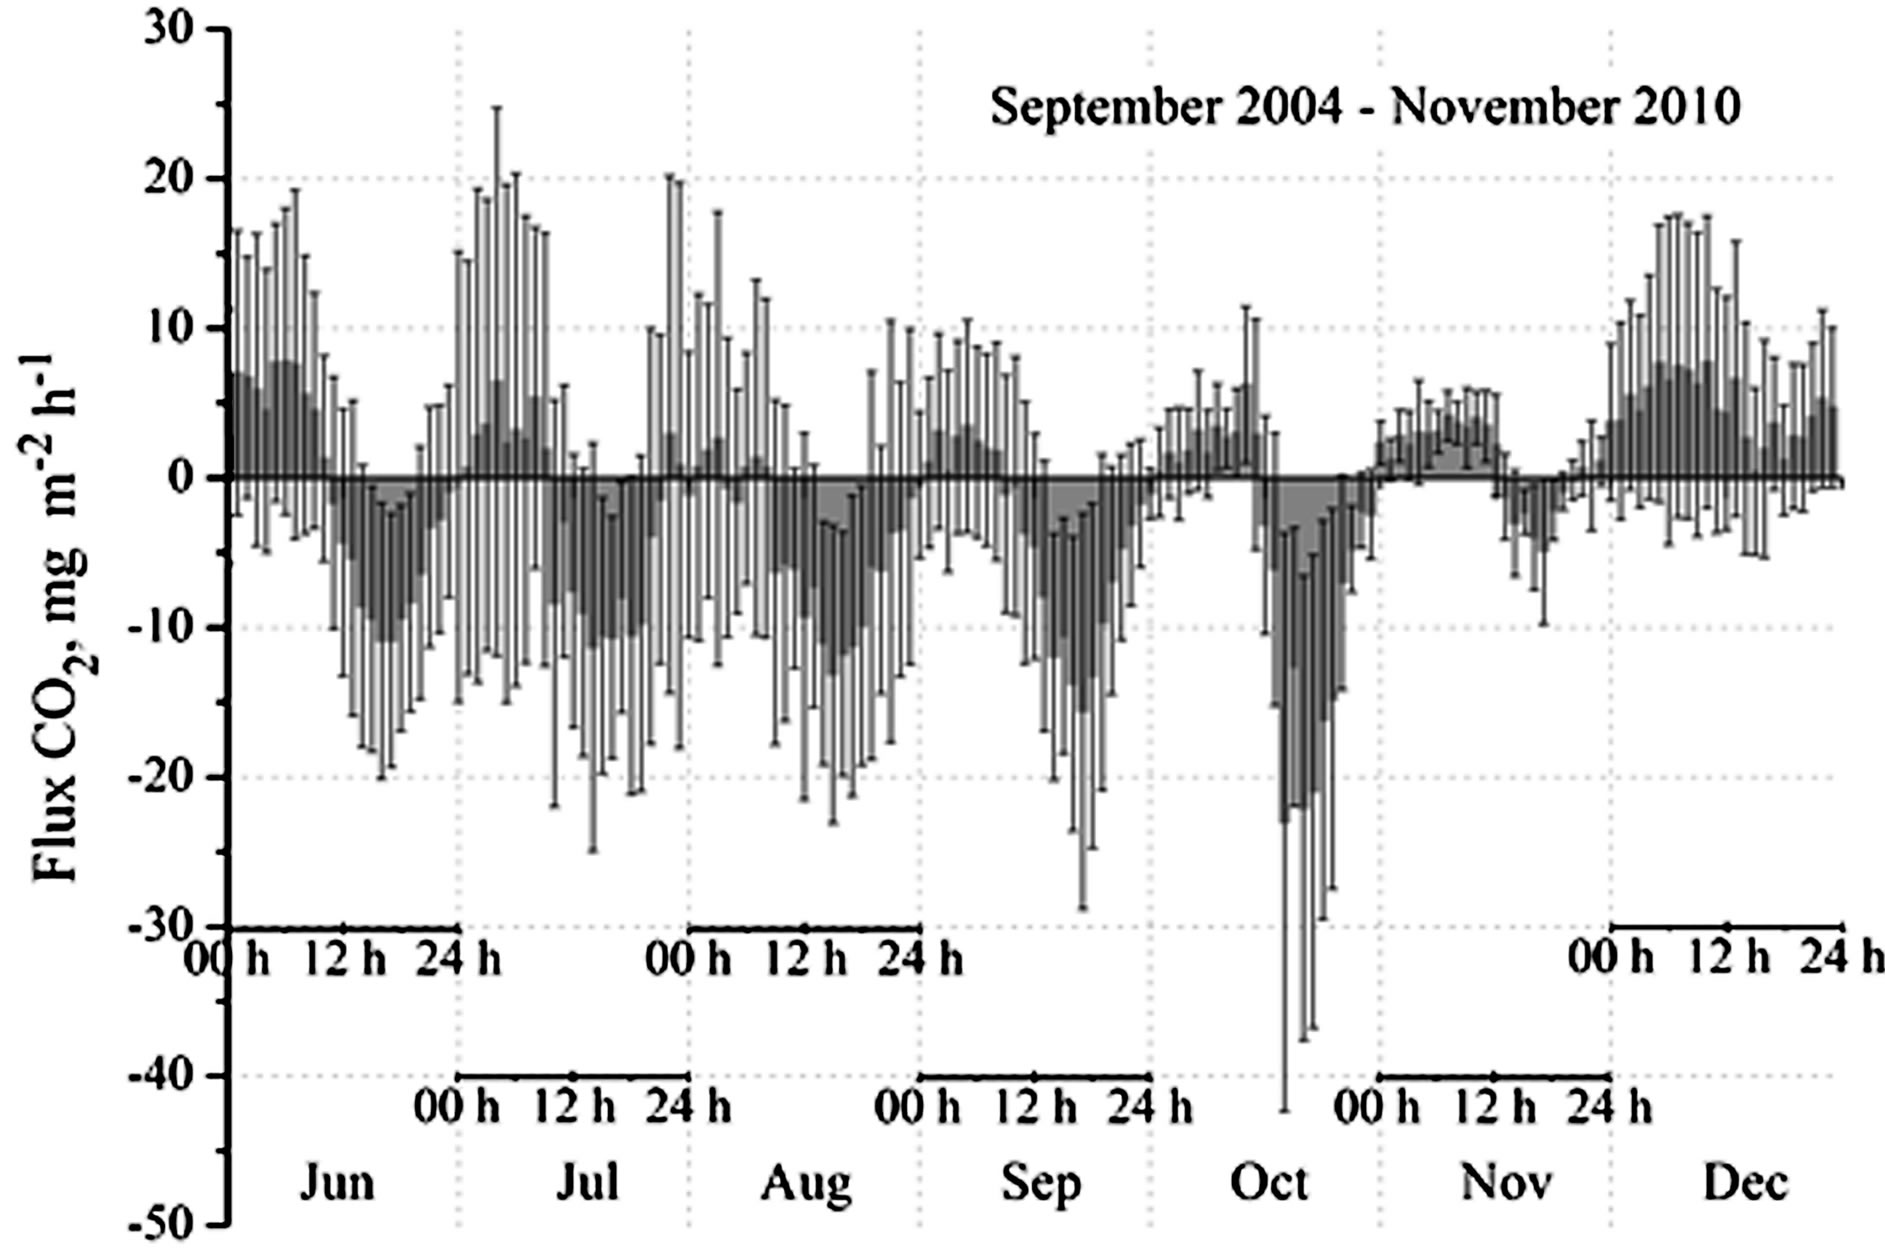
Figure 3. Average diurnal variation of carbon dioxide flux in the littoral zone of Lake Baikal during the ice-free period (averaged for 2004-2010, N = 5547).
bon dioxide from the atmosphere was 11 mg∙CO2∙m−2∙day−1, whereas in June of 2009, it was estimated to be 27 mg CO2 m−2∙day−1. The mean flux (2007- 2009) to the water surface was 22 mg∙CO2 m−2∙day−1 during the spring period. The summer values were as follows: in August of 2005 minus 120 mg∙CO2∙m−2∙day−1 and in August-September of 2008 minus 95 mg∙CO2∙m−2∙day−1. In September of 2004, the mean diurnal flux was minus 88 mg∙CO2∙m−2∙day−1. The average rate of flux was minus 100 mg∙CO2∙m−2∙day−1 in the littoral area of Southern Baikal in August-September.
In the pre-ice period, unlike the spring and summer periods, the continuous emission of carbon dioxide from the water was recorded during a 24-hour period in December. As in other seasons, the maximal CO2 values were registered at dawn and the minimal values before sunset. For example, the mean rate of carbon dioxide emission was 1, 50, 223, and 128 mg∙CO2∙m−2∙day−1 in December of 2005, 2006, 2008, and 2009, respectively. According to the results of the December measurement cycles in 2005-2009, the mean rate of carbon dioxide emission into the atmosphere from the lake surface amounted to 110 mg CO2 m−2∙day−1 in the littoral area of Southern Baikal.
Figure 4 shows the mean average monthly diurnal net ofthe total diurnal carbon dioxide flux during the ice-free period.
The consumption of CO2 on the water surface increased in the littoral area of Lake Baikal from 20 mg∙CO2∙m−2∙day−1 in June to 110 mg∙CO2∙m−2∙day−1 in August (Figure 4). The reduction in the flux rate started in September from 95 mg∙CO2∙m−2∙day−1 to the zero balance in late October - early November. The maximal rate of mean diurnal CO2 emissions was recorded in the preice period (110 mg∙CO2∙m−2∙day−1).
Based on the long-term measurements during all seasons, we estimated the annual gas exchange budget in the air-water system in the littoral zone of Lake Baikal dur-
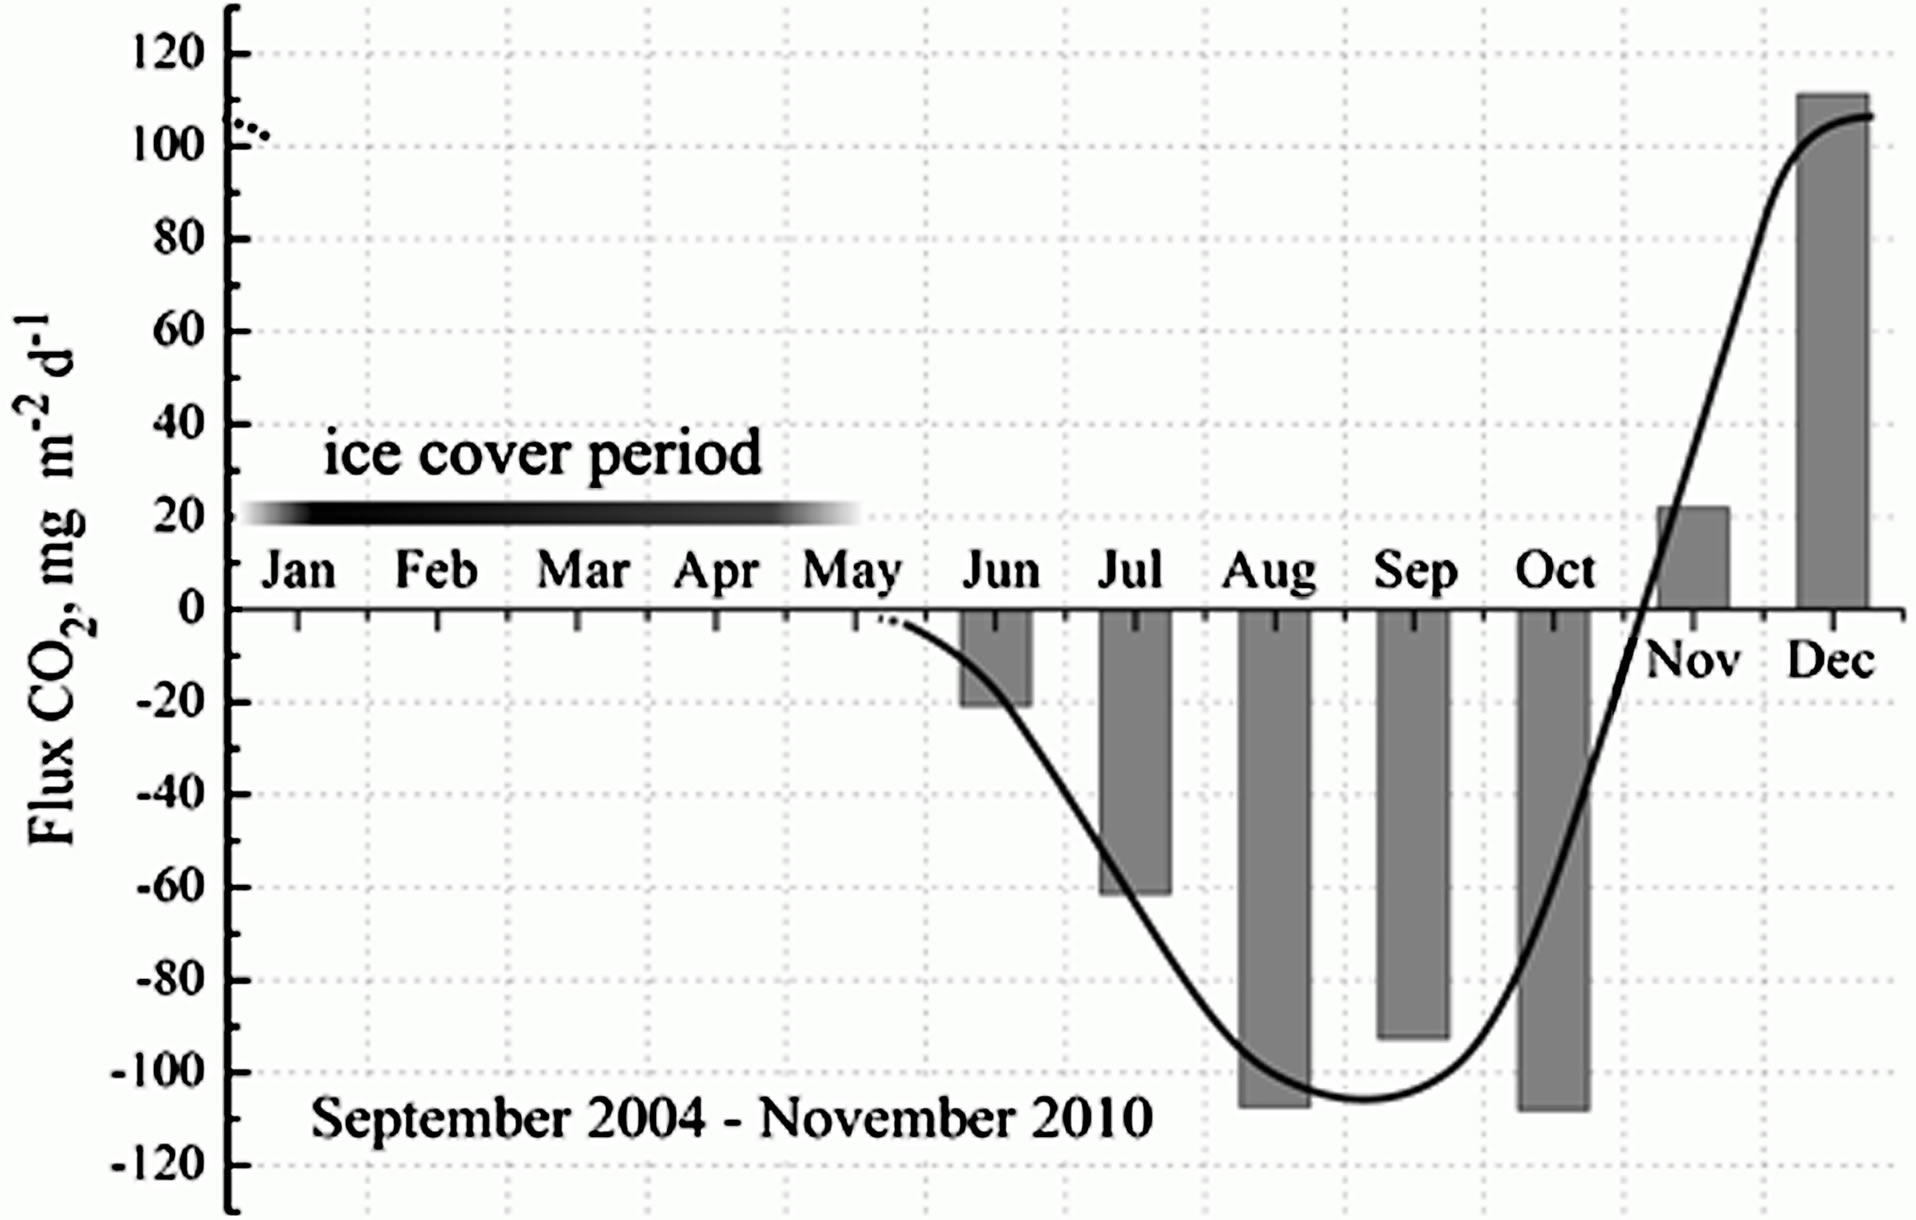
Figure 4. Average monthly diurnal net of carbon dioxide flux in the littoral area of Lake Baikal during the ice-free periods of 2004-2010.
ing the ice-free period. By integrating all the time-series flux data curves in Figure 4, the sink of atmospheric CO2 in the littoral zones of Lake Baikal was estimated to be 3 - 5 g∙CO2∙m2.
4. Discussion
Photosynthesis and the destruction of organic matter as well as the respiration of hydrobionts are the main factors causing diurnal fluctuations and seasonal variations in concentrations of dissolved gases and nutrients. The diurnal cycle of aquatic plant activity depends on light duration and, consequently, affects the maximal and minimal diurnal concentrations of the studied components.
Gas exchange processes in the air-water system are also affected by other factors (e.g., water temperature, wind speed, state of water surface), resulting in another time scale of variability. Therefore, the diurnal variation of chemical components concentrations in the water forms as a result of overlapping of changes of external hydrometeorological conditions with biological rhythms of the production and destruction of organic substances. The intensity of the physical and chemical processes of gas transfer through the water surface affects the diurnal variation of dissolved gases. Namely, the diurnal variation in the concentrations of chemical components, which participate in or accompany a cycle of gas exchange СО2 may provide more detailed information on the seasonal variability of the researched process in the littoral area of the lake compared with the measurements, which are performed during a limited period of the day (e.g., at daylight).
Seasonal variations are regulated by the following main processes. The period of spring warming, which starts after ice thawing in May and continues up to mid-July, coincides with the time of the annual maximum of solar radiation, which rapidly warms the surface waters. It is obvious that variations in the mean concentrations of chemical components from May to July are attributed to a biotic factor [18]. In May-June, the vegetation of the under-ice algal community is completing (the maximum is observed in April). The photosynthetic activity of some algae causes the decrease in the carbon dioxide concentrations in the water during March-April. High water enrichment (103%) with oxygen is attributed both to this process and to low water temperature. In late June and July, a new assemblage of planktonic and benthic algae develops. Production dominates over the destruction of organic matter [19], causing a further decrease in the concentrations of carbon dioxide and nitrates, an insignificant rise in the average O2 content and, due to the temperature rise, a high enrichment of water by oxygen (106% - 111%). In spring, the hydrological characteristics and plankton concentrations rapidly change and affect the dynamics of all constituents of the CO2 exchange process in the air-water system.
Summer, as a rule, starts in the littoral zone of Southern Baikal in late July-early August and lasts until midSeptember. The growth of summer algal vegetation begins in the same period as soon as the water becomes warmer. In August, another maximum of photosynthesis starts after the ice maximum [19]. The intense development of phytoplankton and picoplankton results in minimal concentrations of carbon dioxide and nutrients in the surface water. It should be noted that the water temperature rise causes the decrease in carbon dioxide solubility and, consequently, an increase in the partial pressure of CO2 in the surface water if the CO2 concentrations are constant. However, the active photosynthesis of aquatic biota in summer decreases the CO2 concentrations, and the partial pressure becomes lower than the atmospheric pressure during the whole day. Correspondingly, the duration and intensity of carbon dioxide flux increases from the atmosphere onto the water surface. Therefore, the most powerful flux of carbon dioxide from the atmosphere is observed in summer in the littoral zone of Lake Baikal.
As the water becomes cooler and the biomass of the summer planktonic community decreases in the autumn, the concentrations of carbon dioxide and nutrients increase in the water. The photosynthesis of the aquatic biota and the increase in CO2 solubility caused by the decrease of water temperature promote the preservation of a primary carbon dioxide flux from the atmosphere on a surface of lake until October (Figures 3 and 4).
In November, the upwelling of deep waters enriched with carbon dioxide, is embedded in the littoral zone in conditions of active wind mixing, the destruction of organic matter, and the continuous decrease in both the abundance and activity of plankton change the direction of the total diurnal flux. The insignificant flux of carbon dioxide onto the water surface that is observed in the diurnal course from 1 to 7 p.m. (Figure 3) does not compensate for the intensifying of its emission into the atmosphere during the rest of the day (Figure 4). In December, these processes cause the continuous emission of carbon dioxide from the water for 24 hours.
It is necessary to consider the following methodological aspects to estimate the annual budget of carbon dioxide fluxes in the littoral area of Lake Baikal during icefree periods. The chamber method used here for measuring carbon dioxide fluxes from the water surface has some obvious disadvantages. Because the wind regime is continuously maintained inside the submerged chamber (approximately 2 - 3 m∙sec−1), the flux values are higher during complete calm on the lake and lower in the presence of strong wind. Strong waves and the considerable tilt of this chamber can cause sporadic ventilation of the chamber. However, it is possible to correct some errors caused by random ventilation by comparing these results with the data obtained from another non-ventilated Closed chamber (Figure 1(b)).
To our knowledge, the problems associated with these shortcomings of the chamber method underestimate the flux to the water surface as a constituent of the diurnal net. The reasons are as follows:
1) The diurnal variation in breeze air circulation is clearly expressed in the littoral zone of Lake Baikal. After the morning calm, the wind starts blowing at 10 - 11 a.m. from the open part of the lake, and the maximal velocity is reached in the afternoon. At the same time, the most powerful carbon dioxide flux is observed from the atmosphere. Therefore, according to [20], we may assume that we underestimate the component of the flux onto the water surface under real (not chamber) conditions.
2) Wind intensity also induces waves, which may cause the random input of atmospheric air into the chamber, thus decreasing the flux value measured in the daytime.
3) At daytime, the possible increase in the surface water temperature inside the chamber increases the partial pressure of the carbon dioxide in the water, thus reducing the flux rate onto the water surface.
4) At night, the wind speed from the shore is significantly lower than that at daytime, as the temperature contrast between the cooling shoreline and the cold Baikal water is not high; therefore, the limited wind exchange inside the chamber affects the total CO2 emission insignificantly.
Hence, possible errors in applying the chamber method to estimate the diurnal net of carbon dioxide flux in the air-water system in the littoral zone of Lake Baikal may lead only to a decrease in the total flux onto the water surface.
We compared long-term data on the mean monthly diurnal net of carbon dioxide flux in the littoral zone of Lake Baikal during the ice-free period with the results obtained based on the chemical analysis of water in 2010 (Figure 4). The carbon dioxide concentrations in the water were calculated for each month of 2010 from the pH values and the bicarbonate content in the water samples collected every three hours at the sites of the chamber locations. The partial pressure of carbon dioxide was estimated by taking into account the water temperature of the lake. Then, the partial pressure of CO2 in the atmosphere (1 m above the water surface) at the sampling sites was subtracted from the partial pressure of CO2 in the water. Figure 5 presents the mean monthly diurnal difference of carbon dioxide partial pressure between the water and the atmosphere.
The course of difference in the partial pressure for the different months is practically identical to the course of the mean monthly diurnal balance of carbon dioxide flux
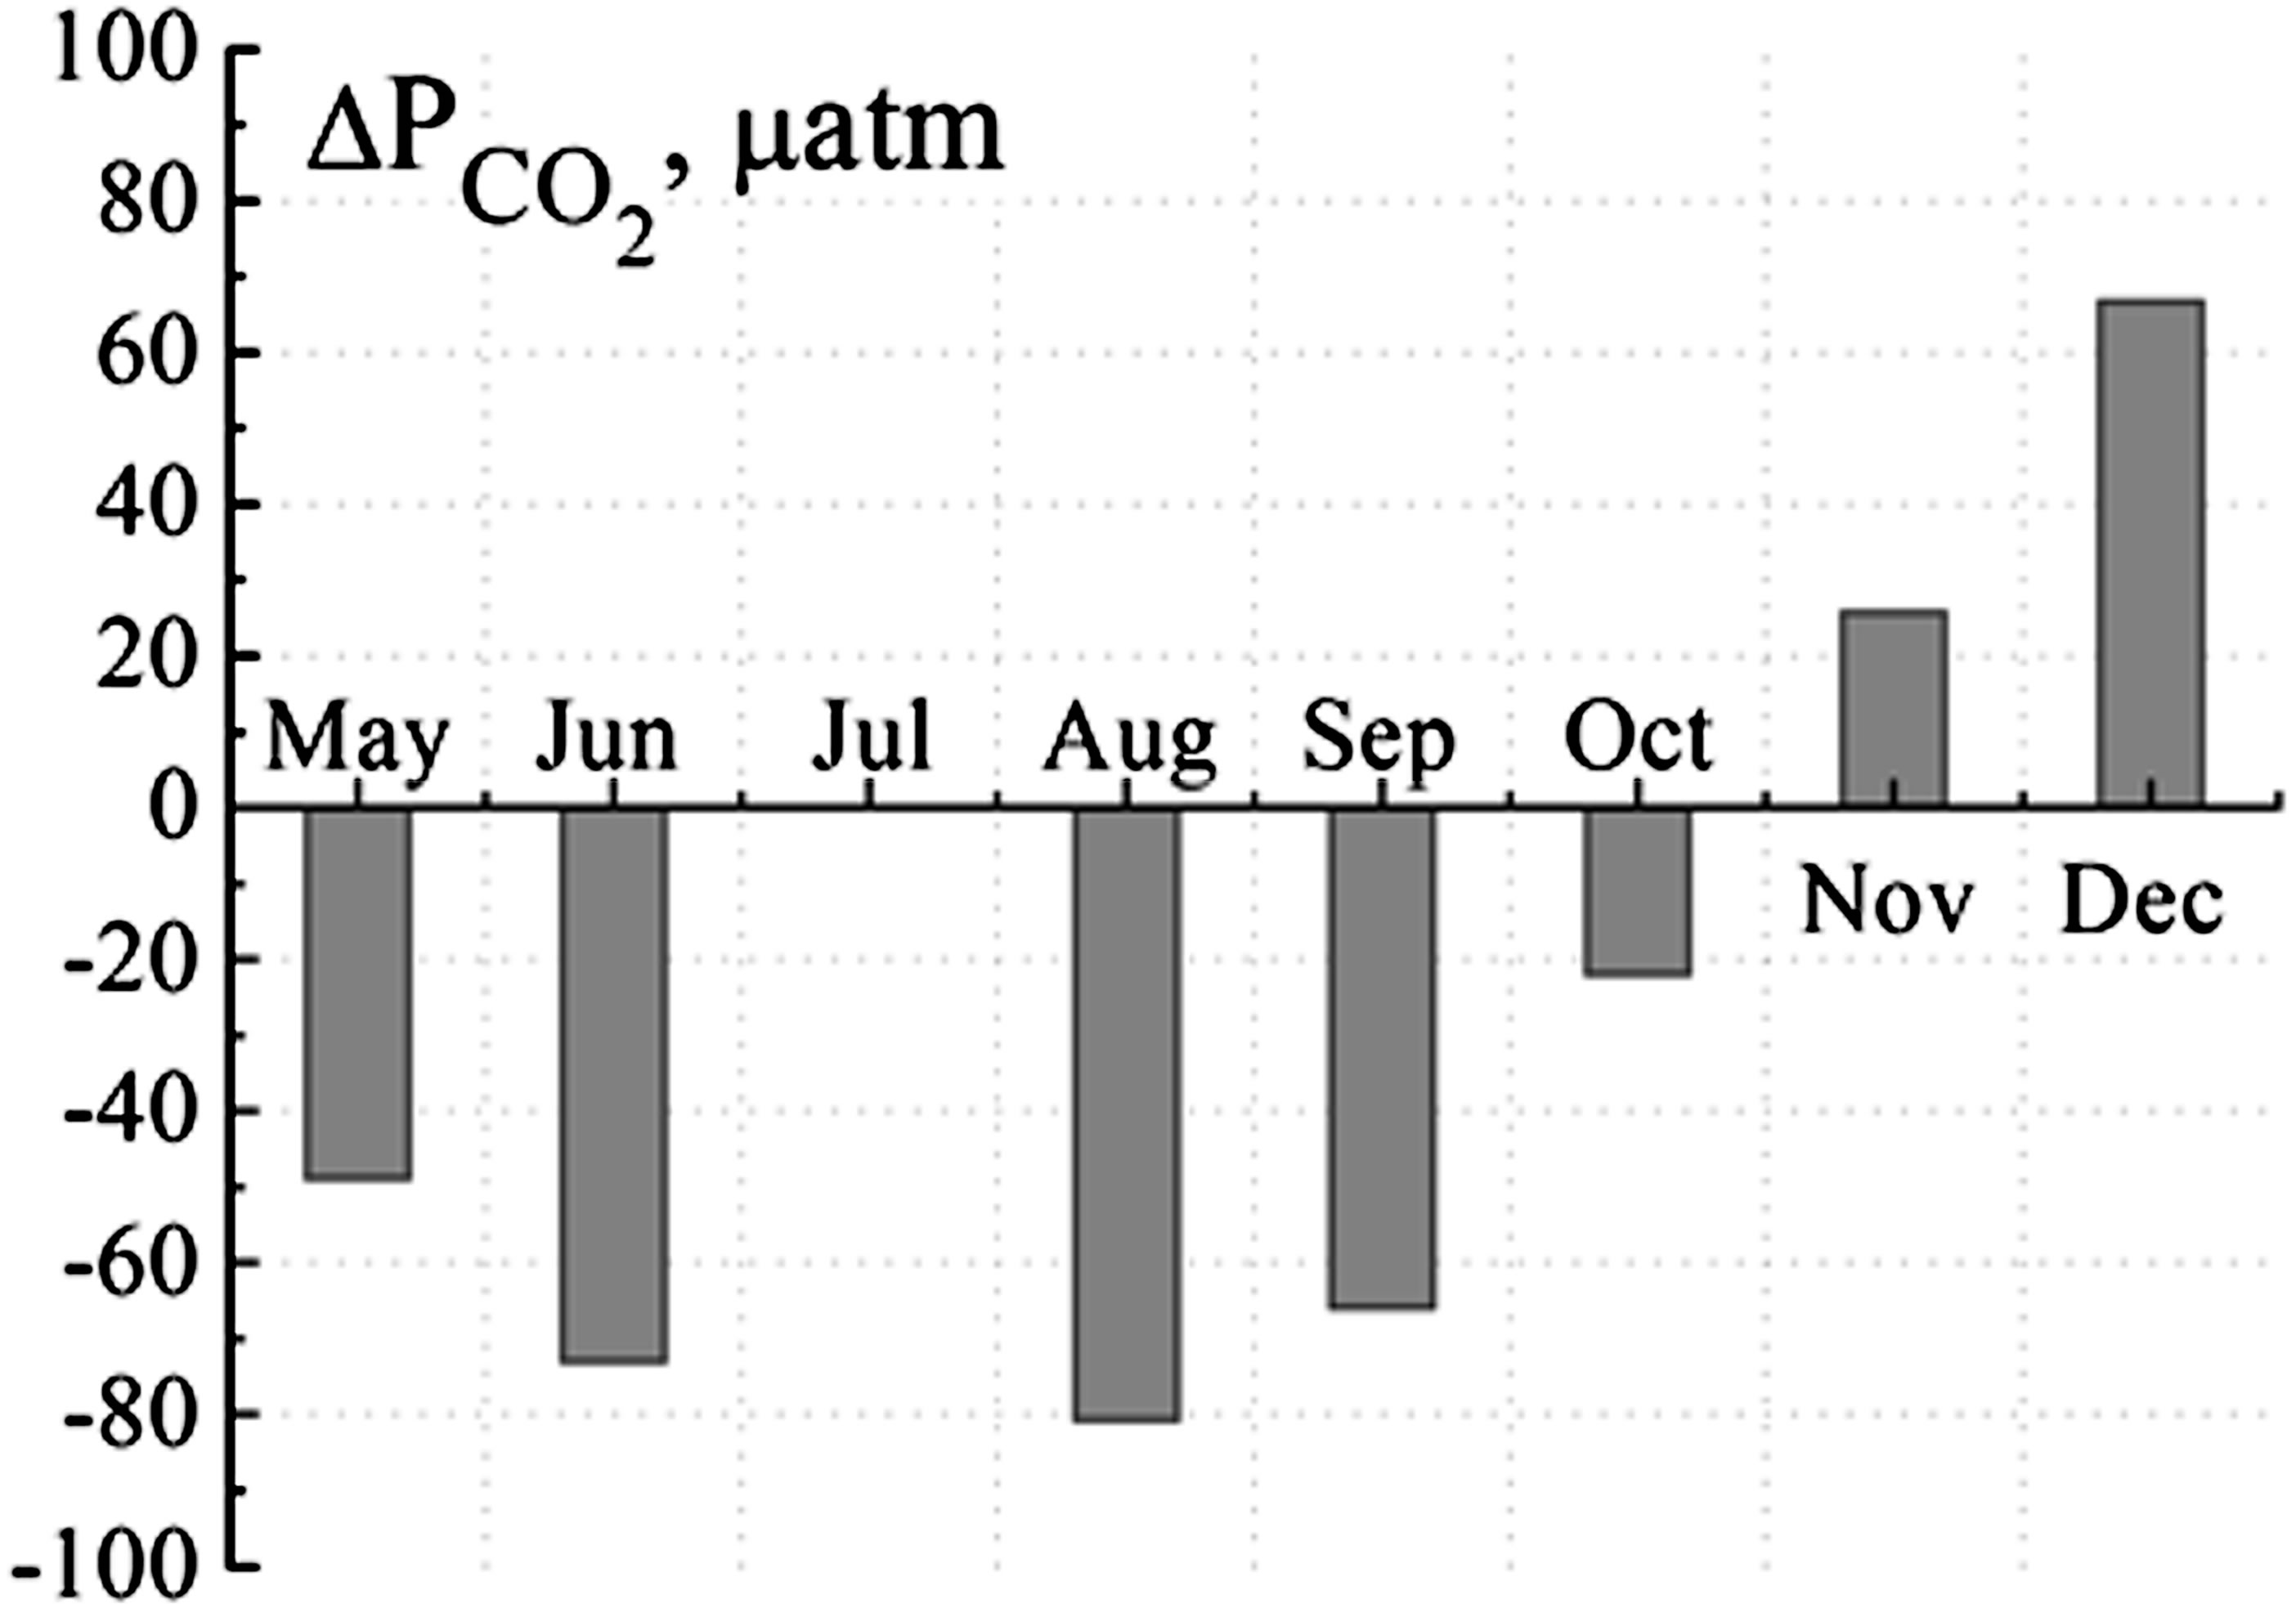
Figure 5. Average monthly diurnal difference of carbon dioxide partial pressure between the water and the atmosphere in the littoral zone of Lake Baikal during the ice-free period (2010).
in the littoral zone of Lake Baikal during the ice-free period (Figure 4). Knowing that the mean wind speed (our long-term data) differs each month by 1 - 1.5 m∙sec−1 at the measurement point, it is possible to conclude that the balance calculated from any of the formulae [20,21] will show that the carbon dioxide flux from the atmosphere onto the surface water will prevail. Taking into account the shortcomings of the chamber method, the value of 3 - 5 g∙CO2∙m−2 of the carbon dioxide flux from atmosphere into the littoral zone of Lake Baikal during the ice-free period may be regarded as a minimal value.
5. Acknowledgements
This work was supported by a grant from the Russian Foundation for Basic Research (Project 08-05-00258), the Program of Basic Research of the Department of Earth Sciences of Russian of Academy of Sciences (№ 10.1) and expedition grants of Siberian Branch of Russian Academy of Sciences. M. A. Grachev is acknowledged for his comments that helped to improve the manuscript.
REFERENCES
- J. F. B. Mitchell, C. A. Senior and W. J. Ingram, “CO2 and Climate: A Missing Feedback?” Nature, Vol. 341, 1989, pp. 132-143. http://dx.doi.org/10.1038/341132a0
- R. Portielje and L. Lijklema, “Carbon Dioxide Fluxes the Air-Water Interface and Its Impact on Carbon Availability in Aquatic Systems,” Limnology and Oceanography, Vol. 40, No. 4, 1995, pp. 690-699. http://dx.doi.org/10.4319/lo.1995.40.4.0690
- R. Wanninkhof and R. M. Knox, “Chemical Enhancement of CO2 Exchange in Natural Waters,” Limnology and Oceanography, Vol. 41, No. 4, 1996, pp. 689-697. http://dx.doi.org/10.4319/lo.1996.41.4.0689
- R. Zhu, Y. Liu, H. Xu, T. Huang, J. Sun, E. Ma and L. Sun, “Carbon Dioxide and Methane Fluxes in the Littoral Zones of Two Lakes, East Antarctica,” Atmospheric Environment, Vol. 44, No. 3, 2010, pp. 304-311. http://dx.doi.org/10.1016/j.atmosenv.2009.10.038
- M. A. Grachev, V. M. Domysheva and T. V. Khodzher, “Abyssal Water of Lake Baikal-Natural Standard of Fresh Water,” Chemistry for Sustainable Development, Vol. 12, 2004, pp. 417-429.
- V. M. Domysheva, M. V. Panchenko, D. A. Pestunov and M. V. Sakirko, “Influence of Atmospheric Precipitation on the CO2 Exchange with the Water Surface of Lake Baikal,” Doklady Earth Sciences, Vol. 415, No. 1, 2007, pp. 740-743. http://dx.doi.org/10.1134/S1028334X07050182
- V. V. Zavoruev, M. V. Panchenko, V. M. Domysheva, M. V. Sakirko, O. I. Belykh and G. I. Popovskaya, “Daily Variation of CO2 Exchange and Photosynthesis Intensity in Surface Water of Lake Baikal,” Doklady Earth Sciences, Vol. 413, No. 2, 2007, pp. 402-405. http://dx.doi.org/10.1134/S1028334X0703018X
- V. M. Domysheva, M. V. Sakirko, D. A. Pestunov and M. V. Panchenko, “Experimental Assessment of the Carbon Dioxide Flow in the Atmosphere-Water System of the Littoral and Pelagic Zones of Lake Baikal during Hydrological Summer,” Doklady Earth Sciences, Vol. 431, No. 2, 2010, pp. 541-545. http://dx.doi.org/10.1134/S1028334X10040276
- V. I. Verbolov, V. M. Sokolnikov and M. N. Shimaraev, “A Hydrometeorological Mode and Thermal Balance of Lake Baikal,” Science, Novosibirsk, 1965.
- D. A. Pestunov, M. V. Panchenko and V. P. Shmargunov, “A Device for Measuring the Content of CO2 Dissolved in Water,” Instruments and Experimental Techniques, Vol. 51, No. 5, 2008, pp. 773-774. http://dx.doi.org/10.1134/S0020441208050229
- G. N. Panin, “Warmly—and Mass Exchange between a Reservoir and Atmosphere—in Natural Conditions,” Science, Moscow, 1985.
- T. Ishida, T. Nagano, Y. Kitaya and S. Suzuki, “Gas Flux Measurement Using the Relaxed Eddy Accumulation Method with Conditional Sampling,” Environmental Control in Biology, Vol. 33, No. 2, 1995, pp. 79-82. http://dx.doi.org/10.2525/ecb1963.33.79
- M. L. Goulden, J. W. Munger, S. M. Fan, B. C. Daube and S. C. Wofsy, “Measurements of Carbon Storage by Long Term Eddy Correlation: Methods and a Critical Evaluation of Accuracy,” Global Change Biology, Vol. 2, No. 3, 1996, pp. 169-182. http://dx.doi.org/10.1111/j.1365-2486.1996.tb00070.x
- A. G. Dickson, C. L. Sabine and J. R. Cristian, “Guide to Best Practices for Ocean CO2 Measurements,” In: A. G. Dickson, C. L. Sabine and J. R. Cristian, Eds., PICES Special Publication 3, IOCCP Report No. 8, North Pacific Marine Science Organization, Sidney, 2007.
- R. G. Wetzel and G. E. Likens, “Limnological Analyses,” Springer-Verlag, New York, 1991. http://dx.doi.org/10.1007/978-1-4757-4098-1
- V. M. Domysheva, M. V. Sakirko, M. V. Panchenko and D. A. Pestunov, “The Interaction of CO2 between the Atmosphere and Surface Waters of Lake Baikal and the Influence of Water Composition,” In: S. Lombardi, L. K. Altunina and S. E. Beaubien, Eds., Advances in the Geological Storage of Carbon Dioxide, NATO Science Series, IV, Earth and Environmental Sciences, Springer, Dordrecht, 2006, pp. 35-45.
- M. V. Sakirko, M. V. Panchenko, V. M. Domysheva and D. A. Pestunov, “Diurnal Rhythms of Carbon Dioxide Concentration in the Sea-Level Air Layer and in the Surface Water of Lake Baikal in Different Hydrological Seasons,” Russian Meteorology and Hydrology, Vol. 33, No. 2, 2008, pp. 112-116. http://dx.doi.org/10.3103/S1068373908020088
- R. C. Back, D. W. Bolgrin, N. E. Guselnikova and N. A. Bondarenko, “Phytoplankton Photosynthesis in Southern Lake Baikal,” Journal of Great Lakes Research, Vol. 17, No. 2, 1991, pp. 194-202. http://dx.doi.org/10.1016/S0380-1330(91)71356-7
- T. Nagata, K. Takai, K. Kawanobe, D. Kim, R. Nakazato, N. Guselnikova and N. Bondarenko, “Autotrophic Picoplankton in Southern Lake Baikal: Abundance, Growth and Grazing Mortality during Summer,” Journal of Plankton Research, Vol. 16, No. 8, 1994, pp. 945-959. http://dx.doi.org/10.1093/plankt/16.8.945
- R. Wanninkhof, “Relationship between Wind Speed and Gas Exchange over the Ocean,” Journal of Geophysical Research, Vol. 97, No. C5, 1992, pp. 7373-7382. http://dx.doi.org/10.1029/92JC00188
- R. Wanninkhof and W. R. McGillis, “A Cubic Relationship between Air-Sea CO2 Exchange and Wind Speed,” Geophysical Research Letters, Vol. 26, No. 13, 1999, pp. 1889-1892. http://dx.doi.org/10.1029/1999GL900363