International Journal of Geosciences
Vol.4 No.8(2013), Article ID:38171,6 pages DOI:10.4236/ijg.2013.48108
foF2 Diurnal Variability at African Equatorial Stations: Dip Equator Secular Displacement Effect
1Laboratoire d’Enseignement et de Recherche en Sciences Expérimentales et Mathématiques, Ecole Normale Supérieure de l’Université de Koudougou, Koudougou, Burkina Faso
2Laboratoire des Matériaux et Environnement, Université de Ouagadougou, Ouagadougou, Burkina Faso
3Institut de Recherches en Sciences Appliquées et Technologies/Centre National de la Recherche Scientifique et Technologique, Ouagadougou, Burkina Faso
Email: *fojals@yahoo.fr
Copyright © 2013 Doua A. Gnabahou et al. This is an open access article distributed under the Creative Commons Attribution License, which permits unrestricted use, distribution, and reproduction in any medium, provided the original work is properly cited.
Received August 5, 2013; revised September 6, 2013; accepted September 29, 2013
Keywords: dip angle; foF2; diurnal variability; solar cycle phase
ABSTRACT
The paper goal is to analyze the variability of foF2 at African equatorial stations and the effect of dip angle on this variability. The gap between the dip angle of Dakar and Ouagadougou is superior to that between Djibouti and Ouagadougou. The trend of the dip angle at Ouagadougou and Dakar decreases while that of Djibouti increases. The relative position of the station with respect to the equator and the trend sign explains the difference observed in foF2 variability at Dakar station and at the two other stations. At Djibouti and Ouagadougou, foF2 exhibits noon bite out profile during all solar cycle phases while at Dakar observed profile is dome or plateau during the maximum and the predominance afternoon peak for the other solar cycle phases.
1. Introduction
Equatorial ionosphere particularly that of African stations has been intensively investigated during the last decade (e.g. [1] Rishbeth and Mendillo; [2] Pancheva et al.; [3] Lei et al.; [4] Ataç et al.; [5] Ouattara et al.; [6] Obrou et al.; [7] Özgüç et al.; [8] Pham et al.; [9] Ouattara and Zerbo; [10] Ouattara and Amory Mazaudier; [11] Gnabahou et al.; [12] Ouattara). The investigation goals are: 1) to see the effect of geomagnetic storm (e.g. [13] Jones; [14] Jones and Risbeth; [15] Lal; [16] AraujoPradere; [17] Lal; [18] Obrou et al.; [19] Le Huy et al.; [20] Zhang et al.; [21] Ouattara and Fleury); 2) to analyze ionosphere variability ([22] Huang and Cheng; [23] Bilitza; [24] Özgüç et al.; [25] Ouattara et al.; [26] Thiam et al.); [27] Gnabahou and Ouattara; [28] Ksouri et al.; [29] Sambou et al.); 3) to model ionosphere parameters (e.g. [30] Adeniyi and Adimula, [31] Souza et al.; [ 32] Zou et al.; [33] Batista et al.; [34] Bilitza et al.; [35] Fotiadis et al.; [36] Batista and Abdu; [37] Ouattara et al.).
foF2 variability at Ouagadougou and Dakar ([37] Ouattara et al.) shows the difference between these two stations foF2 diurnal variations. The difference has been attributed to the longitudinal variation of foF2. The analysis of foF2 diurnal variation at Djibouti station ([27] Gnabahou and Ouattara) and that at Ouagadougou station ([10] Ouattara and Amory Mazaudier) show some similitude, and this induces that the foF2 variations at this African sector are not only due to longitude effect. As these African equatorial stations (Ouagadougou, Dakar and Djibouti), do not have the same dip angle, the topic of the present study is to analyze the effect of the dip equator secular displacement on foF2 variability at these African equatorial stations. This study appears as the first one which investigates such effect at this sector in foF2 variability. It can be noted that the dip equator secular displacement effect in foF2 long term variations of this sector has been investigated recently by [11] Gnabahou et al.. [37] Ouattara et al. study also points out that foF2 shows the phase-to-phase variability of the solar-activity due to solar ultraviolet radiation variability. For this reason the present work takes into account the effect of solar cycle phases.
After Section 2 where we present the data used in the present study and our methodology, we present and discuss our results in Section 3. Section 4 concerns the conclusion of the paper.
2. Material and Methods
The data concern African equatorial ionosonde stations of Ouagadougou (lat: 12.4˚N; long: 358.5˚E, dip: 1.43 for 2013), Dakar (lat: 14.8˚N; long: 342.6˚E, dip: 8.44 for 2013) and Djibouti (lat: 11.5˚N; long: 42.8˚E, dip: 9.32 for 2013). These stations operated from 1966 to 1998, from 1964 to 1980 and from 1957 to 1981, respectively. Ouagadougou station data are provided by France Télécom, Dakar and Djibouti data are obtained from http://www.ips.gov.au/IPSHosted/INAG/web-73/index.html.
The data of Ouagadougou covered three solar cycles (20, 21 and 22), the data of Dakar three solar cycles (19, 20 and 21) and these of Djibouti two solar cycles (20 and 21).
The solar cycle phases are determined by using sunspot number (Rz) provided by SPIDR data base. The dip angle of the stations is given by IGRF (http://www.gdc. noaa.gov/seg/geomag).
For analyzing foF2 variability of these equatorial stations, we considered the two solar cycles which are the intersection of their operated periods. Therefore, the data of solar cycles 20 and 21 will be analyzed. Solar cycle phases are determined by using the following criteria given by [37] Ouattara et al., improved by [25] Ouattara and applied after by [9] Zerbo et al., [25] Ouattara et al., [27] Gnabahou and Ouattara, [12] Ouattara and [38] Nanéma et al. 1) minimum phase: Rz < 20, where Rz is the yearly average Zürich Sunspot number; 2) ascending phase: 20 ≤ Rz ≤ 100 and Rz greater than the previous year’s value; 3) maximum phase: Rz >100 [for small solar cycles (solar cycles with sunspot number maximum (Rz max) less than 100) the maximum phase is obtained by considering Rz > 0.8*Rz max]; and 4) descending phase: 100 ≥ Rz ≥ 20 and Rz less than the previous year’s value.
3. Results and Discussion
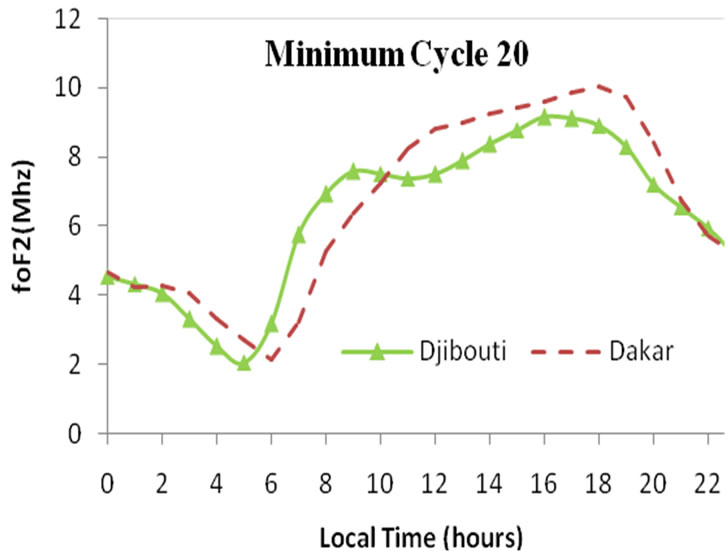
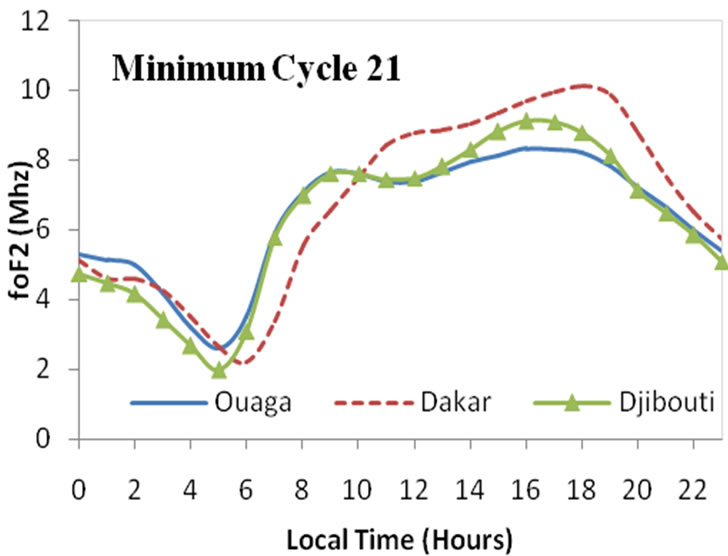
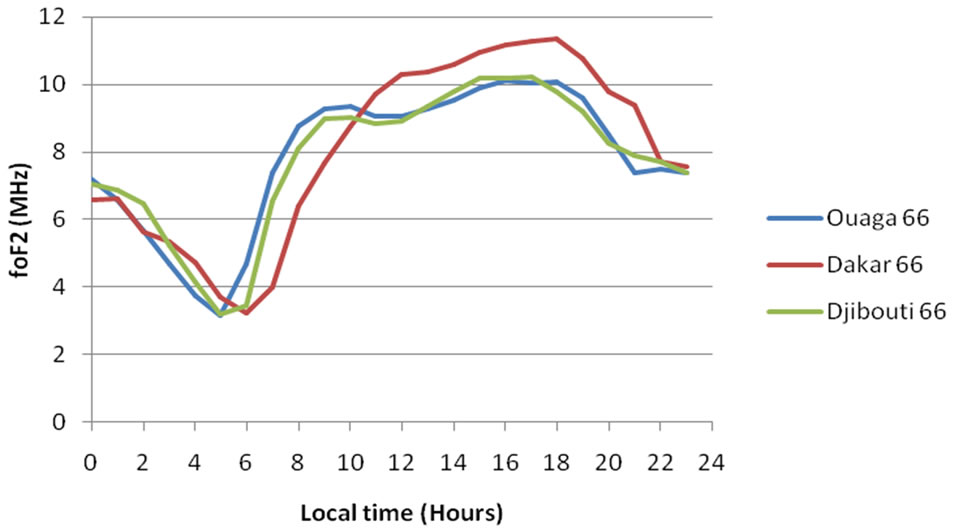
In figures 1 and 2 broken red curves concern Dakar station, triangle green graphs are devoted to Djibouti station and these of blue line to Ouagadougou station. Panel (a) is for minimum phase, panel (b) for increasing phase, panel (c) for maximum phase and panel (d) for decreasing phase. Because of lack of data, the graph of Ouagadougou and that of Djibouti during the minimum phase of cycle 20 and during the decreasing phase of cycle 21 are absent, respectively.
In all graphs of figures 1 and 2, during solar minimum, increasing and decreasing phases at Ouagadougou and Djibouti stations, the afternoon peak is always greater than that of the morning. The asymmetry is more perceptible in the graphs of Djibouti than in those of Ouagadougou. In these graphs, afternoon peak appears around 1600 LT while the morning one is seen at 1000 LT and 0900 LT at Ouagadougou and Djibouti, respectively.
For all solar cycles (figure 2) foF2 curves of Ouagadougou and Djibouti stations highlight the same variability. This variability is different from that of Dakar station. For all solar cycle phases, we observe the noon bite out profile characterized by the presence of the strength electrojet (see [39] Fayot and Vila). At solar maximum and for cycle 20 (panel (c) of figure 1), we observe at Ouagadougou station, the same amplitude for the morning and afternoon peaks (11.7 MHz). For the cycle 21 at the solar maximum, the amplitudes of the morning and afternoon peaks are respectively 12.8 MHz and 12.1 MHz (panel (c) of figure 2). The trough is observed around 1200 LT. At Djibouti station and for solar maximum, the afternoon peak amplitude (11.4 MHz for cycle 20: panel (c) of figure 1; 12.6 MHz for cycle 21: panel (c) of figure 2) is greater than that of morning peak (11.1 MHz for cycle 20: panel (c) of figure 1; 12 MHz for cycle 21: panel (c) of figure 2). Trough is seen around 1100 LT.
In the panel (c) of figure 2, Ouagadougou and Dakar curves exhibit night peak which is the signature of the pre-reversal Electric field ([40] Rishbeth; [41] Fejer; [42] Fejer et al.; [43] Farley et al.).
It is important to note that the profiles observed at Dakar station are different from these observed at Ouagadougou and Djibouti stations. Dakar profiles are: 1) afternoon peak profile for solar minimum, increasing and decreasing phases for both solar cycles (panel (a), (b) and (d) of figures 1 and 2). This type of profile is due to the strength counter electrojet (see [39] Fayot and Vila); 2) dome profile during the maximum of the solar cycle 20 (panel (c) of figure 1) and 3) plateau profile during the maximum of the solar cycle 21 (panel (c) of the figure 2). These last two profiles characterized the absence of electrojet (after [39] Fayot and Vila).
The explanation of the difference observed between Dakar and the two other stations is maybe due to their relative position with respect to magnetic equator. In fact, this assertion emerges from the analysis of figure 3.
The Figure 3 shows the trend of the variation of the dip angle from 1950 to 2010 where the interval 1960- 1984 coincides with our study period covered by solar cycles 20 and 21. In this figure, green graph is devoted to Dakar, the blue curve to Ouagadougou and the red one to Djibouti.
It can be seen in figure 3 that Ouagadougou and Djibouti are closed to the magnetic equator than Dakar even though the magnetic equator approaches Ouagadougou and Dakar stations and rolls away from Djibouti station. This relative position should explain the particular variability of foF2 at Dakar.
In figure 4; we have three panels corresponding to 1) the year which the dip angle of Ouagadougou and Dji-
 (a)
(a)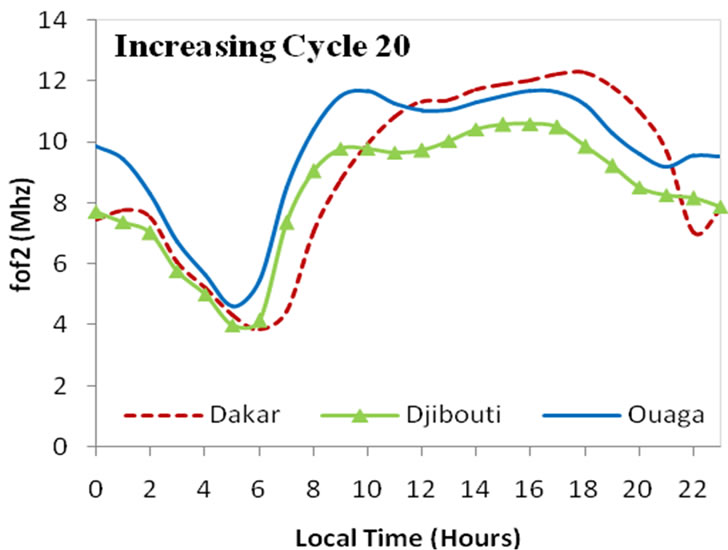 (b)
(b)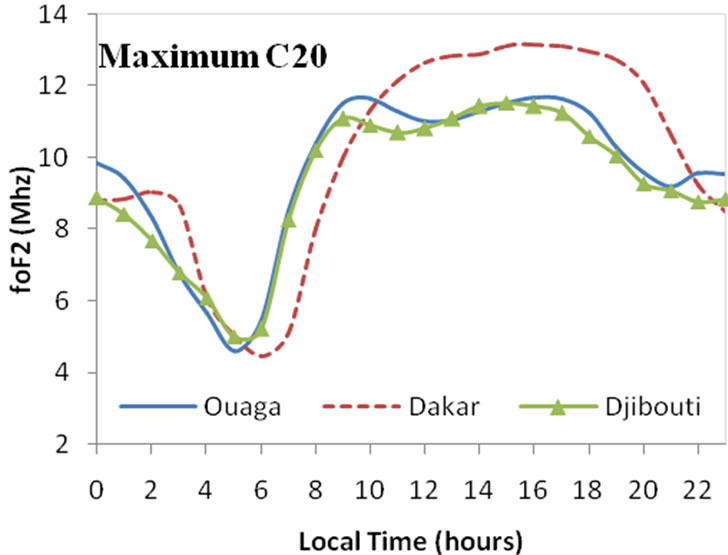 (c)
(c)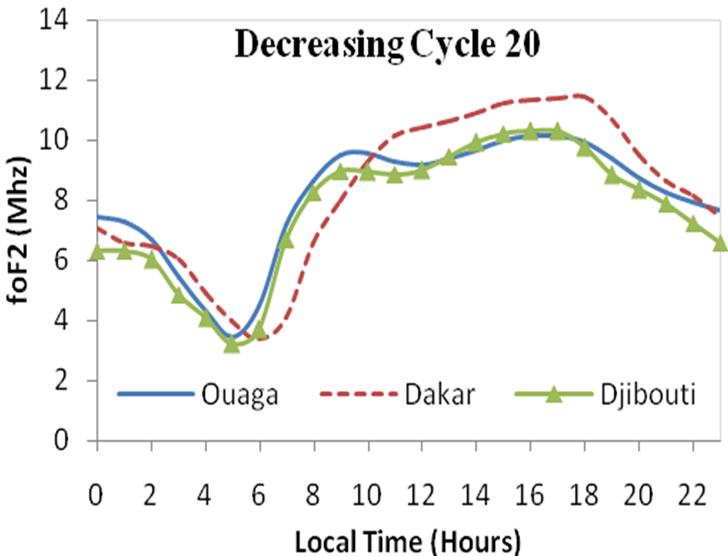 (d)
(d)
Figure 1. foF2 diurnal variation for solar cycle 20. (a) for minimum phase; (b) for increasing phase; (c) for maximum phase and (d) for decreasing phase.
 (a)
(a)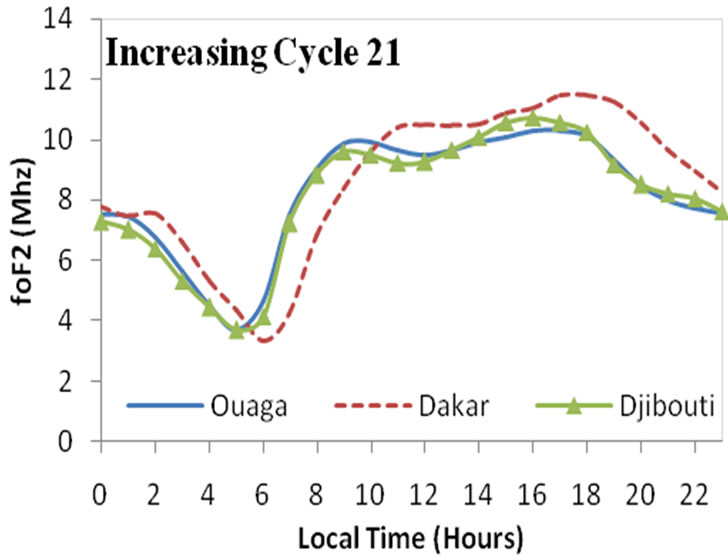 (b)
(b)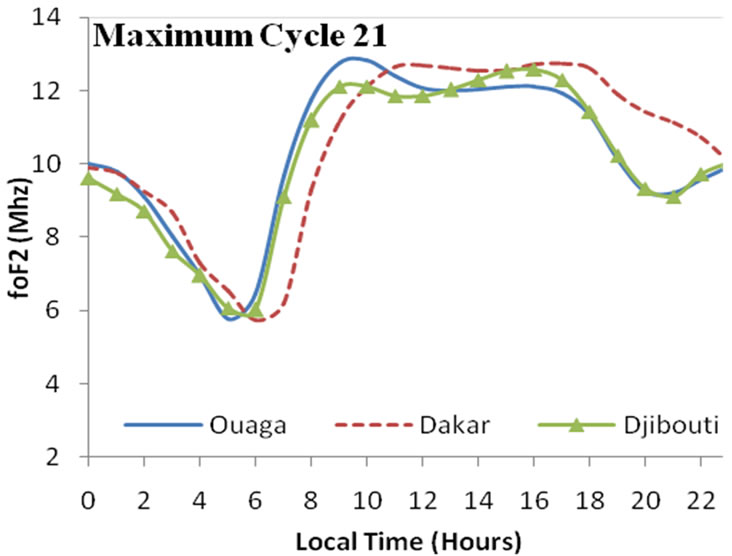 (c)
(c)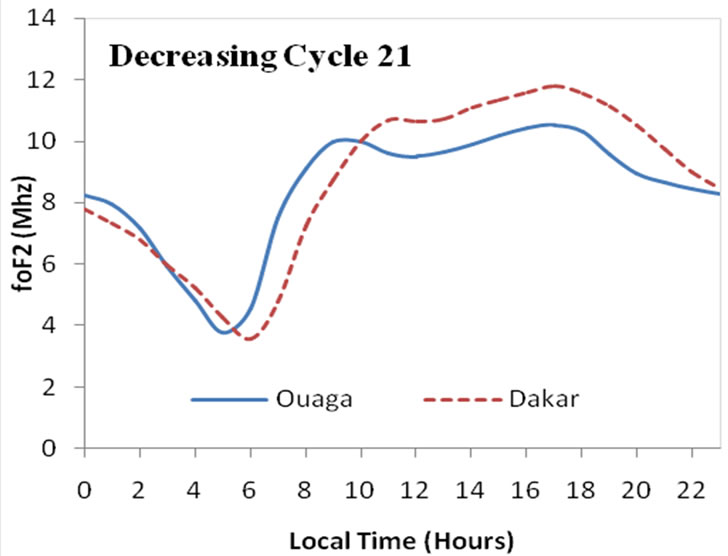 (d)
(d)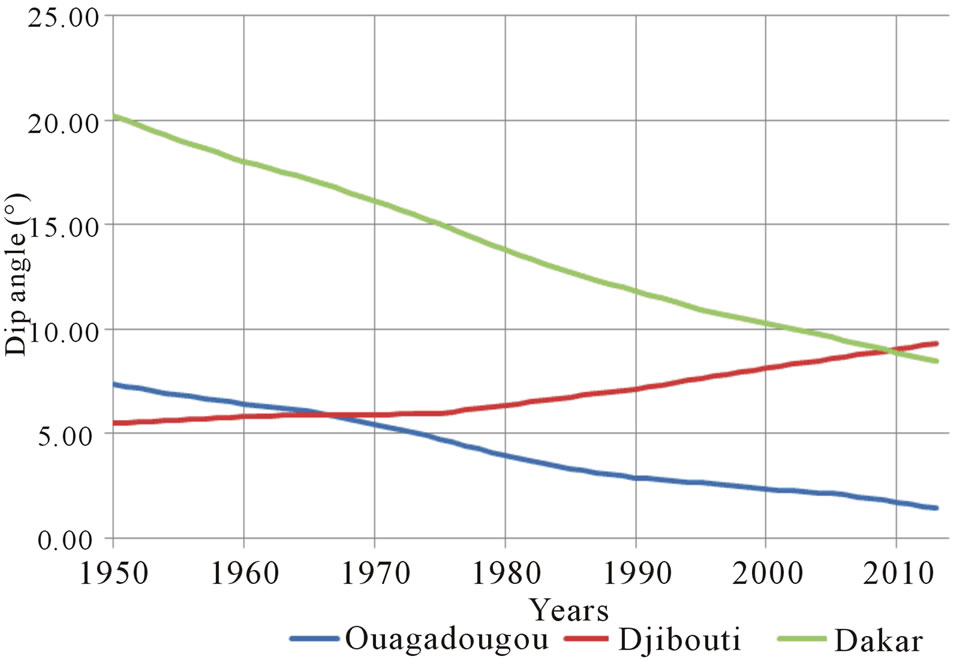
Figure 3. The trend of dip angle from 1950 to 2010.
 (a)
(a)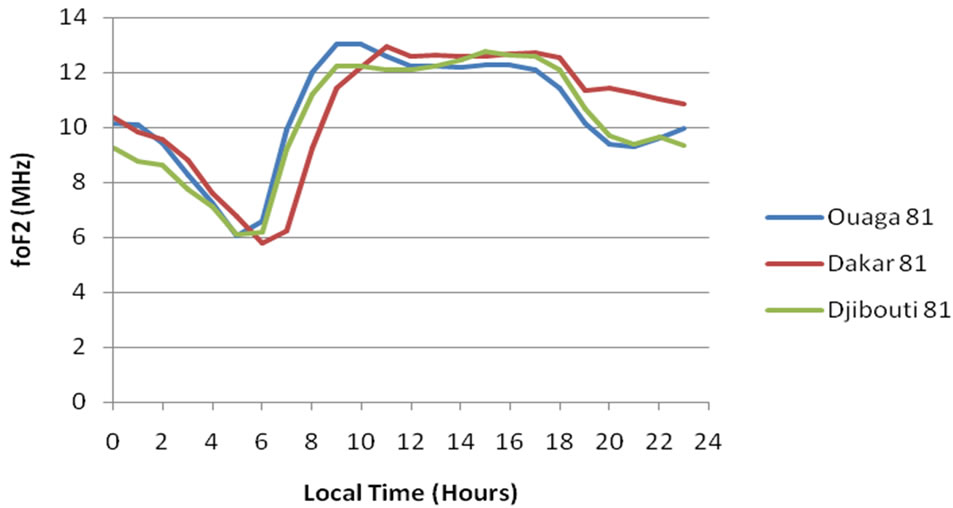 (b)
(b)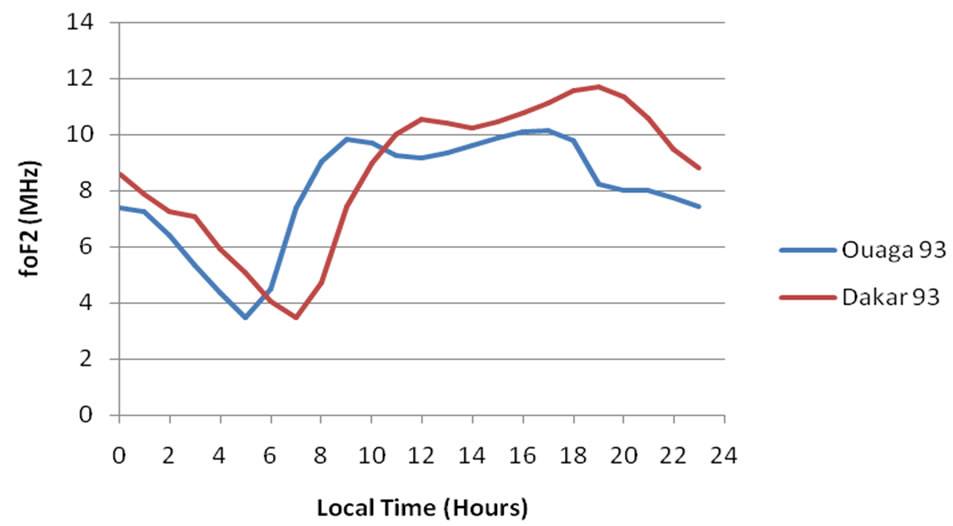 (c)
(c)
Figure 4. foF2 diurnal variation for year 1966, year 1981 and year 1993, located on panel (a), panel (b) and panel (c), respectively.
bouti are the same (1966), 2) the year corresponding to the end of the available data year interval of Djibouti (1981) and one year between this year and the year of the end of the available data year interval of Ouagadougou (1998). We chose here, 1993 as this year.
The panel (a) of figure 4 concerns the year 1966 where Djibouti and Dakar have the same dip angle, the panel (b) expresses foF2 variability for the year 1981 and the panel (c) foF2 variability for the year 1993.
The graphs of the panel (a) not only show the same variability of foF2 at Ouagadougou and Djibouti but also the almost confused graphs. We have here the noon bite out with predominance afternoon peak due to the presence of the strength electrojet while at Dakar we have the afternoon peak profile characterized by the presence of the strength counter electrojet. The gap between this profile and the other two profiles is non-negligible.
Panel (b) shows morning peak for Ouagadougou station and fairly morning peak for Dakar station and fairly afternoon peak for Djibouti. It can be retained that as Djibouti rolls away from the equator, the gap between its foF2 profile and that of Ouagadougou profile increases and the profile type looks like that of Dakar during the year 1966 where at this period this station is not close to the equator as the other stations are. The profile of Dakar station comes closed to that of Ouagadougou as these two stations approach the equator.
Panel (c) shows the similar foF2 profiles at Ouagadougou and Dakar stations for these stations are close to the equator. The graphs are not confused because there dip angles are different.
4. Conclusion
The present work shows foF2 variability for African equatorial stations. At Ouagadougou and Djibouti stations foF2 profiles are a noon bite out profile with more and less asymmetry in the peak amplitudes during solar maximum phase. At Dakar station foF2 profiles are afternoon peak during minimum, increasing and decreasing phases. During solar maximum the profile is dome or plateau. The difference between Dakar foF2 profile and the two other station profiles depends on the relative position of the station with respect to magnetic equator. Dakar and Ouagadougou approach the equator while Djibouti rolls away of it. The gap between Dakar and Ouagadougou stations is greater than that between Djibouti and Ouagadougou stations.
REFERENCES
- H. Rishbeth and M. Mendillo, “Pattern of F2-Layer Variability,” Journal of Atmospheric and Solar-Terrestrial Physics, Vol. 63, No. 15, 2001, pp. 1661-1680. http://dx.doi.org/10.1016/S1364-6826(01)00036-0
- D. Pancheva, N. Mitchell, R. R. Clark, J. Drobjeva and J. Lastovicka, “Variability in the Maximum Height of the Ionospheric F2-Layer over Millstone (September 1998- March 2000); Influence from Below and Above,” Annals of Geophysics, Vol. 20, No. 11, 2002, pp. 1807-1819. http://dx.doi.org/10.5194/angeo-20-1807-2002
- J. Lei, J. P. Thayer, J. M. Forbes, et al., “Ionosphere Response to Solar Wind High-Speed Streams,” Geophysical Research Letters, Vol. 35, No. 19, 2008, Article ID: L19105. http://dx.doi.org/10.1029/2008GL035208
- T. Ataç, A. Özgüç and R. Pektas, “The Variability of foF2 in Different Phases of Solar Cycle 23,” Journal of Atmospheric and Solar-Terrestrial Physics, Vol. 71, No. 5, 2009, pp. 583-589. http://dx.doi.org/10.1016/j.jastp.2009.01.004
- F. Ouattara, C. Amory-Mazaudier, R. Fleury, P. Lassudrie-Duchesne, P. Vila and M. Petitdidier, “West African Equatorial Ionospheric Parameters Climatology Based on Ouagadougou Ionosonde Station Data from June 1966 to February 1998,” Annals of Geophysics, Vol. 27, 2009, pp. 2503-2514. http://dx.doi.org/10.5194/angeo-27-2503-2009
- O. K. Obrou, M. N. Mene, A. T. Kobea and K. Z. Zaka, “Equatorial Total Electron Content (TEC) at Low and High Solar Activity,” Advances in Space Research, Vol. 43, No. 11, 2009, pp. 1757-1761. http://dx.doi.org/10.1016/j.asr.2008.04.019
- A. Özgüç, T. Ataç and R. Pektas, “Examination of the Solar Cycle Variation of foF2 for Cycles 22 and 23,” Journal of Atmospheric and Terrestrial Physics, Vol. 70, No. 2-4, 2008, pp. 268-276. http://dx.doi.org/10.1016/j.jastp.2007.08.016
- T. T. Pham, C. Amory-Mazaudier and M. Le Huy, “Time Variations of the Ionosphere at the Northern Tropical Crest of Ionization at Phu Thuy, Vietnam,” Annals of Geophysics, Vol. 29, No. 1, 2011, pp. 197-207. http://dx.doi.org/10.5194/angeo-29-197-2011
- F. Ouattara and J. L. Zerbo, “Ouagadougou Station F2 Layer Parameters Yearly and Seasonal Variations during Severe Geomagnetic Storms Generated by CMEs and Fluctuating Wind Streams,” International Journal of Physical Sciences, Vol. 6, No. 20, 2011, pp. 4854-4860.
- F. Ouattara and C. A. Mazaudier, “Statistical Study of the Diurnal Variation of the Equatorial F Layer at Ouagadougou from 1966 to 1998,” Journal of Space Weather Space Climate, Vol. 2, No. A19, 2012, pp. 1-10.
- D. A. Gnabahou, A. G. Elias and F. Ouattara, “LongTerm Trend of foF2 at a West-African Equatorial Station Linked to Greenhouse Gases Increase and Dip Equator Secular Displacement,” Journal of Geophysical Research, Vol. 118, No. 6, 2013, pp. 3909-3913. http://dx.doi.org/10.1002/jgra.50381
- F. Ouattara, “IRI-2007 foF2 Predictions at Ouagadougou Station during Quiet Time Periods from 1985 to 1995,” Archives of Physics Research, Vol. 4, No. 3, 2013, pp. 12-18.
- K. L. Jones, “Storm Time Variation of the F2 Layers Electron Concentration,” Journal of Atmospheric and Terrestrial Physics, Vol. 33, No. 3, 1971, pp. 379-389. http://dx.doi.org/10.1016/0021-9169(71)90143-7
- K. L. Jones and H. Risbeth, “The Origin of Storm Increases of Midlatitude F-Layer Electron Concentration,” Journal of Atmospheric and Terrestrial Physics, Vol. 33, No. 9, 1971, pp. 391-401. http://dx.doi.org/10.1016/0021-9169(71)90144-9
- C. Lal, “Global F2 Layer Ionization and Geomagnetic Activity,” Journal of Geophysical Research, Vol. 97, No. A8, 1992, pp. 12153-12159. http://dx.doi.org/10.1029/92JA00325
- E. A. Araujo-Pradere, “foF2 Frequency Bands in el Cerrillo, Mexico during Magnetically Quiet Conditions,” Revista Brasileira de Geofísica, Vol. 15, No. 2, 1997. http://dx.doi.org/10.1590/S0102-261X1997000200006
- C. Lal, “Contribution of Solar Wind and Equinoctial Maxima in Geophysical Phenomena,” Journal of Atmospheric and Terrestrial Physics, Vol. 60, No. 10, 1998, pp. 1017-1024. http://dx.doi.org/10.1016/S1364-6826(98)00046-7
- O. K. Obrou, J. O. Adeniyi, A. T. Kobea and B. Moukassa, “Electron Density Profile Parameters B0 and B1 Response during a Magnetic Disturbance at Equatorial Latitude,” Journal of Atmospheric and Solar-Terrestrial Physics, Vol. 67, No. 5, 2005, pp. 515-519. http://dx.doi.org/10.1016/j.jastp.2004.11.001
- M. Le Huy, C. T. Nguyen, T. L. Tran, R. Fleury, P. L. Duchesne, A. Bourdillon, C. Amory-Mazaudier, N. N. Tran and T. L. Hoang, “The Effect of the Geomagnetic Storm on the Ionospheric Total Electron Content in the Southeast Asian Equatorial Ionization Anomaly Region Observed by the GPS Data,” Journal of Sciences of the Earth, Vol. 29, No. 2, 2007, pp. 104-112.
- D. H. Zhang, X. H. Mo, L. Cai, et al., “Impact Factor for the Ionospheric Total Electron Content Response to Solar Flare Irradiation,” Journal of Geophysical Research A, Vol. 116, No. 4, 2011, Article ID: A04311.
- F. Ouattara and R. Fleury, “Variability of CODG TEC and IRI 2001 Total Electron Content (TEC) during IHY Campaign Period (21 March to 16 April 2008) at Niamey under Different Geomagnetic Activity Conditions,” Scientific Research and Essays, Vol. 6, No. 17, 2011, pp. 3609-3622.
- H. Huang and K. Cheng, “Solar Cycle Variations of the Equatorial Ionospheric Anomaly in Total Electron Content in the Asians Region,” Journal of Geophysical Research, Vol. 101, No. A11, 1996, pp. 24513-24520. http://dx.doi.org/10.1029/96JA01297
- D. Bilitza, O. K. Obrou, J. O. Adeniyi and O. Olapido, “Variability of foF2 in the Equatorial Ionosphere,” Advances in Space Research, Vol. 34, 2004, pp. 1901-1906. http://dx.doi.org/10.1016/j.asr.2004.08.004
- A. Özgüç, T. Ataç and R. Pektas, “Examination of the Solar Cycle Variation of foF2 for Cycles 22 and 23,” Journal of Atmospheric and Terrestrial Physics, Vol. 70, No. 2-4, 2008, pp. 268-276. http://dx.doi.org/10.1016/j.jastp.2007.08.016
- F. Ouattara, A. Gnabahou and C. A. Mazaudier, “Seasonal, Diurnal and Solar-Cycle Variations of Electron Density at Two West Africa Equatorial Ionization Anomaly Stations,” International Journal of Geophysics, 2012, Article ID: 640463. http://dx.doi.org/10.1155/2012/640463
- N. Thiam, F. Ouattara, A. Gnabahou, C. A. Mazaudier, R. Fleury and P. L. Duchesne, “Variation de la Fréquence Critique de la Couche F2 (foF2) de la Station de Dakar avec le Cycle Solaire,”Journal of Science, Vol. 11, No. 2, 2012, pp. 16-20.
- A. Gnabahou and F. Ouattara, “Ionosphere Variability from 1957 to 1981 at Djibouti Station,” European Journal of Scientific Research, Vol. 73, No. 3, 2012, pp. 382- 390.
- S. S. Kouris, P. A. Bradley and I. K. Nissopoulos, “The Relationships of foF2 and M(3000)F2 versus R12,” Proceedings of the COST 238/PRIME/Workshop, Eindhoven, 1994, pp. 155-167.
- E. Sambou, P. M. Vila and A. T. Kobea, “Non-Trough foF2 Enhancements at Near-Equatorial Dip Latitudes,” Annales Geophysicae, Vol. 16, No. 6, 1998, pp. 711-720. http://dx.doi.org/10.1007/s00585-998-0711-8
- J. O. Adeniyi and I. A. Adimula, “Comparing the F2 Layer Model of IRI with Observations at Ibadan,” Advances in Space Research, Vol. 15, No. 2, 1995, pp. 1441- 1444. http://dx.doi.org/10.1016/S0273-1177(99)80036-2
- J. R. de Souza, G. J. Batley, M. A. Abdu and I. S. Batista, “Comparison of Low Latitude F Region Peak Densities, Heights and Equatorial ExB Drift from IRI with Obervational Data and the Sheffield University Plasmasphere Ionosphere Model,” Advances in Space Research, Vol. 18, 1996, pp. 41-44.
- L. Zou, H. Rishbeth, I. C. F. Muller-Wodarg, A. D. Aylward, G. H. Millward, T. J. Fuller-Rowell, D. W. Idenden and R. J. Moffett, “Annual and Semiannual Variations in the Ionospheric F2-Layer. I. Modelling,” Annals of Geophysics, Vol. 18, 2000, pp. 927-944. http://dx.doi.org/10.1007/s00585-000-0927-8
- I. S. Batista and M. A. Abdu, “Ionospheric Variability at Brazilian Low and Equatorial Latitudes: Comparison between Observations and IRI Model,” Advances in Space Research, Vol. 34, No. 9, 2004, pp. 1894-1900. http://dx.doi.org/10.1016/j.asr.2004.04.012
- D. Bilitza, O. K. Obrou, J. O. Adeniyi and O. Olapido, “Variability of foF2 in the Equatorial Ionosphere,” Advances in Space Research, Vol. 34, 2004, pp. 1901-1906. http://dx.doi.org/10.1016/j.asr.2004.08.004
- D. N. Fotiadis, G. M. Baziakos and S. S. Kouris, “On the Global Behaviour of the Day-To-Day MUF Variation,” Advances in Space Research, Vol. 33, No. 6, 2004, pp. 893-901. http://dx.doi.org/10.1016/j.asr.2003.05.005
- I. S. Batista and M. A. Abdu, “Ionospheric Variability at Brazilian Low and Equatorial Latitudes: Comparison between Observations and IRI Model,” Advances in Space Research, Vol. 34, No. 9, 2004, pp. 1894-1900. http://dx.doi.org/10.1016/j.asr.2004.04.012
- F. Ouattara, C. Zoundi and R. Fleury, “Comparison between CODG TEC and GPS Based TEC Observations at Koudougou Station in Burkina Faso,” Indian Journal of Radio & Space Physics, Vol. 41, No. 6, 2012, pp. 617- 623.
- E. Nanéma, A. Maute, F. Ouattara and A. Richmond, “NmF2 Seasonal Time Variation during the Maximum and Minimum Phases of the Solar Cycle 22: Comparison between Ouagadougou NmF2 Data and TIEGCM NmF2 Predictions,” Physical Review and Research International, Submitted.
- J. M. Faynot and P. Villa, “F Region at the Magnetic Equator,” Annals of Geophysics, Vol. 35, 1979, pp. 1-9.
- H. Rishbeth, “The F-Layer Dynamo,” Planetary and Space Science, Vol. 19, No. 2, 1971, pp. 263-267. http://dx.doi.org/10.1016/0032-0633(71)90205-4
- B. G. Fejer, “The Equatorial Ionospheric Electric Fields: A Review,” Journal of Atmospheric and Terrestrial Physics, Vol. 43, No. 5-6, 1981, pp. 377-386. http://dx.doi.org/10.1016/0021-9169(81)90101-X
- B. G. Fejer, D. T. Farley, R. F. Woodman and C. Calderon, “Dependence of Equatorial F Region Vertical Drifts on Season and Solar Cycle,” Journal of Geophysical Research, Vol. 84, No. A10, 1979, p. 5792. http://dx.doi.org/10.1029/JA084iA10p05792
- D. T. Farley, E. Bonell, B. G. Fejer and M. F. Larsen, “The Pre-Reversal Enhancement of the Zonal Electric Field in the Equatorial Ionosphere,” Journal of Geophysical Research, Vol. 91, No. A12, 1986, pp. 723-728. http://dx.doi.org/10.1029/JA091iA12p13723
NOTES
*Corresponding author.