International Journal of Geosciences
Vol.4 No.1A(2013), Article ID:27409,10 pages DOI:10.4236/ijg.2013.41A022
Variability of Air-Sea CO2 Fluxes and Dissolved Inorganic Carbon Distribution in the Atlantic Basin: A Coupled Model Analysis
1National Institute for Space Research, Center for Weather Forecasts and Climate Studies, Cachoeira Paulista, Brazil
2National Institute for Space Research, Remote Sensing Division, São José dos Campos, Brazil
Email: gentil@dsr.inpe.br
Received October 31, 2012; revised November 29, 2012; accepted December 27, 2012
Keywords: Carbon Cycle; Atlantic Basin; Coupled Model; Climatological Analysis
ABSTRACT
The biogeochemical dynamics of carbon in the ocean is a subject of fundamental interest to environmental studies. In this context, we have implemented a ten year run of the Brazilian Earth System Coupled Ocean-Atmosphere Model (BESM-OA2.3) integrated with TOPAZ biogeochemical model for the Atlantic basin. The modeled ΔpCO2 for the tropical Atlantic shows very clearly a high dominance of positive fluxes, that is, the CO2 fluxes are sea-to-air throughout the tropical region and for both winter and summer periods. In the mid-latitudes regions negatives fluxes (air-to-sea) were observed for both seasons. An exception to this pattern is an extensive negative tongue on the latitude 10˚N. The occurrence of this negative ΔpCO2 tongue region in the Tropical Atlantic is highly correlated to negative Evaporation-Precipitation values during this season. In the northern hemisphere (NH) summer the negative values of ΔpCO2 in the tropical Atlantic region are concentrated in the adjacent zone of the Amazon river mouth due to the North Equatorial Counter Current intensification. This process favors the formation of a carbon sink in the adjacent region of the Amazon river mouth. Model results show lowest values of dissolved inorganic carbon (DIC) in a surface layer (100 - 150 m). Highest DIC values are observed in deeper layers and concentrated in an equatorial band. The chlorophyll bloom in equatorial zones was well represented by the model. These blooms are the result of equatorial upwelling that brings the high concentration tongues of DIC present in the equatorial band towards the euphotic zone. This is the first published paper about the BESM-OA2.3 integrated with TOPAZ. The presented results suggest that this modeling system is able to reproduce the main regional carbon dynamics features of the mid-latitude/tropical Atlantic.
1. Introduction
The biogeochemical dynamics of carbon in the ocean is a subject of fundamental interest to global environmental changes studies [1]. This interest has been motivated in the last decades mostly for the need to better understand the role of the oceans on the carbon dioxide dynamics, to predict the rate of increase of atmospheric carbon dioxide concentrations and its effects on the global climate [2].
The best estimates indicate that roughly one third of the carbon available in the atmosphere is sequestered by the ocean [1]. However, a great uncertainty still exists in the quantification of carbon concentration and about the seasonal dynamics of the current carbon present in the ocean. In this context, a better quantification of the ocean’s role in the carbon cycle is still one of the major scientific challenges for global change studies [3].
According to [4], the large uncertainty in the estimates of the net oceanic CO2 balance is associated to a relatively high spatial and temporal variability of natural air-sea exchange of carbon dioxide. Although worldwide efforts for in situ measurements of air and water CO2 concentrations and air-sea exchange are being made to better assess the oceanic uptake of this greenhouse gas, there is still a lack of a good representation of the spatial and temporal distribution of the carbon dioxide in oceanic waters.
In seawater, CO2 is soluble and reacts to form bicarbonate and carbonate ions [5]. The sum of bicarbonate, carbonate ions and dissolved carbon dioxide corresponds to the dissolved inorganic carbon—DIC [6]. Due to the peculiar chemistry of seawater and its influence on dissolved salts, more than 99% of the dissolved inorganic carbon is in the form bicarbonate and carbonate ions [7]. The consequence of this conversion of atmospheric carbon dioxide into oceanic bicarbonate and carbonate ions is that the ocean holds fifty times as much carbon as the overlying atmosphere. This inorganic carbon in the ocean is about forty times larger than the amount held as organic carbon [7].
It is important to note that the DIC concentration controls the distribution and abundance of pelagic phytoplankton, net primary production, and the food web dynamics [8]. In this context, the use of this parameter is not restricted to climate studies, but it is also used to estimate rates of net community production, which can be used as an indicator of ecosystem functionality [9,10]. Marine phytoplankton is important for its central role at the base of the food chain that supports the majority of life in the ocean [11].
The Atlantic basin has a relevant ecological contribution for the global biogeochemical cycle, mostly due the high climate oscillations observed in the region, and which occur irregularly on subseasonal to decadal time scales [12,13]. Moreover, this region shows severe storms, atmospheric dust deposition, mesoscale ocean features and extended periods of elevated precipitation or evaporation and warmings [14]. All these characteristics can affect directly or indirectly the CO2 balance and the concentration of DIC in the water column, with conesquences to the ecological and physical forcings at work in the coupled ocean-atmosphere system [15].
In recent years, better forecasts of oceanic physical variables have been accomplished and operational systems have been established by different groups. These systems typically consist of coupled general circulation models (CGCM), whose results are used as input to force biogeochemical models at basin scale [16]. The establishment of such operational models have largely been made possible thanks to the recent large increase in supercomputing resources [11].
The biogeochemical models face an additional challenge compared to the pure oceanic models. Not only their numerous biological tracers make them computationally more costly, but also the large number of empirical parameters and the scarcity of data available for validation and tuning is a great difficulty [15]. Additionally, it is essential for the biogeochemical models to consider the atmospheric influence on the gases concentration in the ocean, reinforcing the need for coupled oceanic and atmospheric modeling [17].
For the present study we performed a ten-year simulation using the Brazilian Earth System Coupled OceanAtmosphere Model (BESM-OA2.3) [18,19] which runs associated with the TOPAZ ocean biogeochemistry model [21], hereafter referred to as BESM-OA2.3-TOPAZ. The main purpose of this work was to analyse the space/ time variability of DIC and CO2 balance in the Atlantic basin for the analysed period. The relation between physical and biogeochemical (DIC and carbon fluxes) variables is herein discussed.
2. BESM-OA2.3 and TOPAZ Models
The focus of the work was the implementation of one global experiment using the CGCM Brazilian Earth System Coupled Ocean-Atmosphere Model (BESM-OA2.3) [18,19] integrated with TOPAZ biogeochemical model [21] for a ten-year run (2007-2016). The results presented herein were extracted for the Atlantic basin in a regular grid of the 1˚ × 1˚ for the longitudes 70˚W - 10˚E and latitudes 40˚S - 40˚N. The restart files of the experiment were updated every month. A more in depth description of BESM-OA2.3 can be found in [18].
In general terms, BESM-OA2.3 is a system including an Atmospheric General Circulation Model (AGCM) developed at the Brazilian Center for Weather Forecast and Climate Studies (CPTEC) [19] and the NOAA/ GFDL’s MOM4p1 OGCM. The coupling between these two models is done using the GFDL’s Flexible Modular System—FMS coupler [20]. CPTEC’s AGCM is a spectral model, with triangular truncation at wave number 62, equivalent to approximately 1.875˚ × 1.875˚ lat-lon horizontal resolution, and 28 sigma levels unevenly distributed in the troposphere between the surface and the lower stratosphere.
NOAA/GFDL’s MOM4p1 is a primitive equation model configured over the globe, with 1/4˚ × 1˚ lat-lon in the deep tropics (i.e., between 10˚S - 10˚N), spacing to 1˚ × 1˚ at higher latitudes of both hemispheres, and 50 levels in the vertical. The model uses an explicit free surface formulation and is fully coupled without flux correction each 2 hourly coupled time steps [20]. The AGCM component sends to coupler fresh water (liquid and solid precipitation), specific humidity, heat, and momentum (10 meters zonal and meridional wind) fluxes, surface pressure, and cosine of the zenith angle; the AGCM receives SST and ocean albedo from the CGCM flux coupler.
In our experiment the CGCM was integrated to the ocean biogeochemical and ecological component, namely Tracers of Ocean Phytoplankton with Allometric Zooplankton version 2.0 (TOPAZ2). Modifications described in the following were made in the TOPAZ2 code to calculate the CO2 balance at the air-sea interface. TOPAZ2 includes 30 tracers to describe the main biogeochemical cycles. A technical description of TOPAZ is available in [21].
3. Carbon Dynamics in Seawater
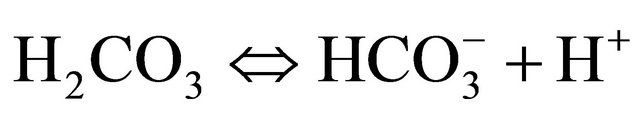
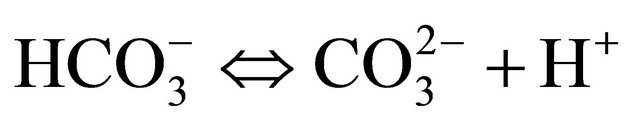
In aqueous systems, carbon dioxide dissolves forming aqueous carbon dioxide and carbonic acid which dissociates into negatively charged bicarbonate and carbonate ions. The three following simplified equations show these chemical processes:
 (1)
(1)
 (2)
(2)
 (3)
(3)
Since aqueous CO2 and H2CO3 are difficult to distinguish it is customary to refer to their combined dissolved concentration, which we represent here by CO2 dissolved.
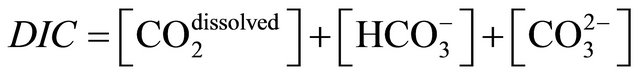
Dissolved carbon dioxide is the result of the chemical reaction that appears in consequence of the carbon dioxide dissolution in seawater, forming bicarbonate and carbonate ions, which collectively are referred to as dissolved inorganic carbon, DIC:
 (4)
(4)
The square brackets in Equation (4) represent the solute concentrations in seawater normally defined per unit mass in μmol·kg−1.
The air-sea exchange of carbon dioxide depends on the partial pressure, pCO2, or concentration of CO2 dissolved in the surface waters, while the global ocean storage of carbon is measured by DIC.
Changes in DIC are buffered with respect to changes in pCO2. In other words, there are negative feedbacks in the carbonate system which dampens the impact of perturbations on the total dissolved inorganic carbon pool. On the other hand, this ocean feedback amplifies changes in atmospheric pCO2 in response to changes in ocean DIC [22-24].
The general ratio between dissolved carbon dioxide and the effective partial pressure, pCO2, is described by the solubility Ko [25], defined as:
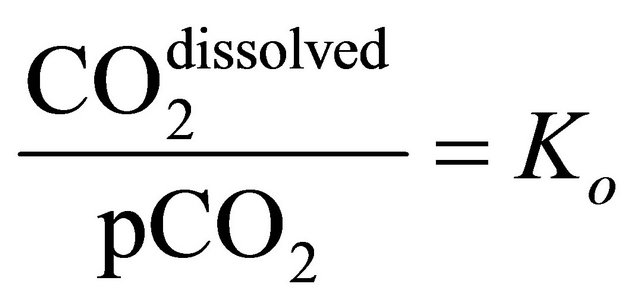 (5)
(5)
The air-sea exchange of carbon dioxide depends on the partial pressure, pCO2, or concentration of dissolved carbon dioxide in the surface waters, while the global ocean storage of carbon is measured by DIC. More details about air-sea partial pressure difference are explained in the next sub-topic.
To determine CO2 balance at the air-sea interface, it is necessary to calculate the difference of the partial pressure of CO2 (pCO2) between the sea and atmosphere. To obtain the partial pressure of CO2 in seawater (pCO2(sw)) several biogeochemical variables derived by the coupled model were used, namely: dissolved inorganic carbon (DIC), total alkalinity (ALK), salinity (SSS) and sea surface temperature (SST). According to [1], pCO2(sw) can be calculated by:
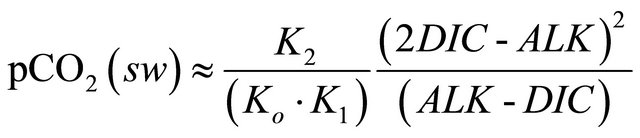 (6)
(6)
where, according to [25], Ko which represents the solubility of CO2 in seawater, can be obtained by,
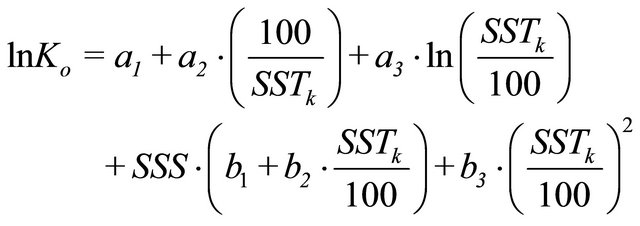 (7)
(7)
SSTk represents the absolute sea surface temperature (K). The constants are: a1 = −58.0931, a2 = 90.5069, a3 = 22.2940, b1 = 0.027766, b2 = −0.025888 and b3 = 0.00050578.
K1 and K2 terms in Equation (6) represent the dissociation constants of carbonic acid in seawater. These variables were described in [26] and their mathematical formulations are:
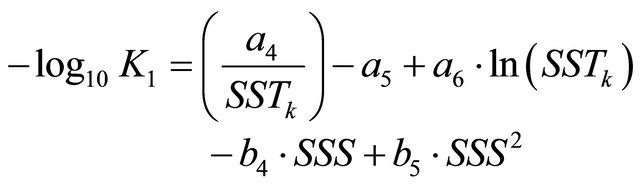 (8)
(8)
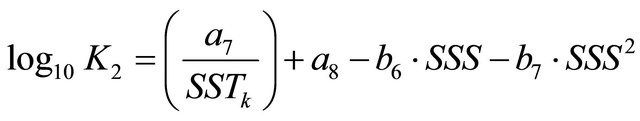 (9)
(9)
where the constants are: a4 = 3670.7, a5 = −62.008, a6 = 9.7944, a7 = 1394.7, a8 = 4.777, b4 = −0.0118, b5 = 0.000116, b6 = −0.0184 and b7 = 0.000118.
Monthly atmospheric pCO2 (pCO2(atm)) was obtained by [28]:
 (10)
(10)
where XCO2 represents the molar fraction of CO2, obtained from the Mauna Loa (155.6˚W - 19.5˚N) in situ station and available at the World Data Centre for Greenhouse Gases (WDCGG). A monthly mean time series of this variable from 1975 to 2012 is displayed in Figure 1.
The term p in Equation (10) is the sea-level pressure (in atm) [26] and VPwater is the water vapor pressure calculated according to Equation (11) [28].
Using the difference of the partial pressure of CO2 (pCO2) between the ocean and atmosphere it was possible to estimate the carbon balance in our study region. Positive values denote sea-to-air CO2 flux, whereas negative values denote air-to-sea CO2 flux.
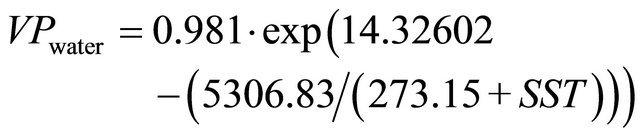 (11)
(11)
4. Results and Discussions
The ten-year (2007-1016) mean values of ΔpCO2 for the
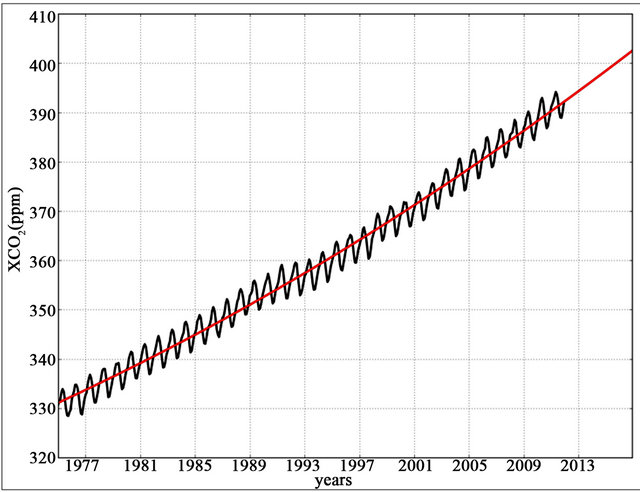
Figure 1. Mauna Loa atmospheric monthly means of CO2 molar fraction (in black). Red line represents the regression + extrapolation curve.
NH winter and summer seasons are presented in Figure 2. In general terms, it is possible to observe the strong tendency in the tropical Atlantic to sea-to-air CO2 fluxes in both seasons with regional maximum values up to 90 μatm near latitudes ±20˚. However, in mid-latitudes (poleward of ±30˚) this tendency is reversed, that is, the CO2 fluxes are air-to-sea. Although in the detail, some seasonality is evident, similarly to [29] our results also support the view that throughout the year the tropical Atlantic is a CO2 source to the atmosphere, while midlatitude regions are a carbon sink. Figure 2 shows that positive fluxes are concentrated in the Tropical South Atlantic in the winter and in the Tropical North Atlantic in the summer. Distributions of ΔpCO2 calculated by [29] indicate that the mid-latitudes regions are very important for removing the atmospheric CO2 by the world’s oceans. In our results, the strongest sinks were found in the latitudes above 30 degrees (N-S).
4.1. Evaporation-Precipitation Balance Influences on ΔpCO2
During the NH winter, the region between the latitudes 30˚S to 34˚N (red colors in left map—Figure 2) supply CO2 to the atmosphere. An exception to this pattern is the extensive negative tongue (air-to-sea CO2 fluxes) on the latitude 10˚N. The occurrence of this negative ΔpCO2 tongue region in the Tropical Atlantic is highly correlated to negative Evaporation-Precipitation (E-P) values during this season in the region [30]. According to [31], the concentration of all chemical species present in seawater occurs in direct proportion to the salinity dilution. The opposite effect occurs if an excess of evaporation over precipitation leads to a net removal of freshwater from the surface layers. For example, if we take a water parcel with an initial pCO2 of 300 μatm and a salinity of 35, a one unit increase of salinity, the final pCO2 will be increased in 9 μatm [1]. The pCO2 change associated with changes in salinity are determined by the influence of salinity on the dissociation constants (see Equations (8) and (9)). Variations in salinity in the surface ocean are mostly driven by changes in the balance between evaporation and precipitation [31,32]. The relation between ΔpCO2 and E-P can be indirectly confirmed by an analysis of Figure 3, where the minimum values of salinity during NH winter correspond to the ΔpCO2 negative tongue regions in the tropical Atlantic.
4.2. The Amazon River Influence on ΔpCO2
In the summer season (Figure 2, right map) the negative values of ΔpCO2 in the tropical Atlantic region are concentrated in the adjacent zone to the Amazon river mouth. According to [33] this signal is consequence of the meteorological seasonality regimes in the North Brazil Current (NBC), carrying the Amazon plume to different areas of the western tropical North Atlantic (WTNA) as a coherent mass. According to [34], the Amazon plume turns northward outside the river mouth into the North Atlantic. During NH winter, onshore wind stress is approximately normal to the Brazilian coast. The result is a northwesterly displacement of the Amazon plume in relation to the NBC, trapping the river plume closer to the coastline in a long, thin band [35]. During the NH winter, the North Equatorial Counter Current (NECC) is weakest [34], consequently the Amazon waters primarily flow to the Caribbean rather than veering offshore to the WTNA.
In NH summer, east-southeasterly winds carry the plume along the northern Brazilian coastal shelf with the North Brazil Current. The Coriolis acceleration acting on the wind-driven, faster, along-shelf NBC causes the plume to detach from the coast anticyclonically and retroflect northeastward into the WTNA [34]. The NBC retroflection occurs at 6˚N - 8˚N, feeding the NECC’s annual peak flow [36]. Figure 2 (right) shows the NECC’s signal identified by the negative ΔpCO2. The influence of the Amazon fresh water discharge on the tropical Atlantic is visible in the minimum salinity values on Figure 3 (right).
Tropical Atlantic seawater normally releases CO2 to the atmosphere because solubility-driven degassing exceeds biological production in lower latitudes [32]. In contrast, the Amazon river mouth region in the summer acts as a carbon sink, removing CO2 from the atmosphere [37,38]. Previous investigations showed that the Amazon river discharge creates a 5 - 10 m deep plume of lowsalinity, low-inorganic carbon water atop the WTNA waters, forming a sink for atmospheric carbon, and covering approximately two million square kilometers [39, 40].
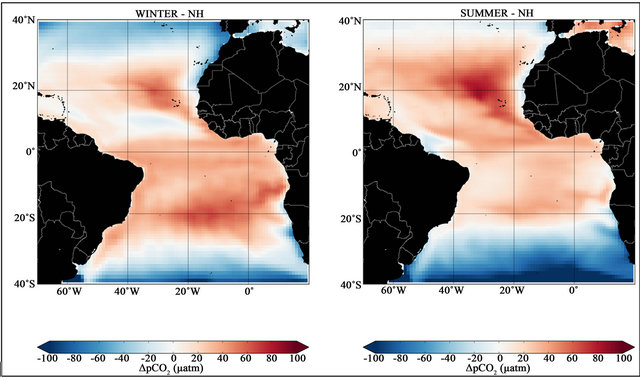
Figure 2. Mean seasonal ΔpCO2 for NH winter (left) and summer (right) seasons for the period from 2007 to 2016.
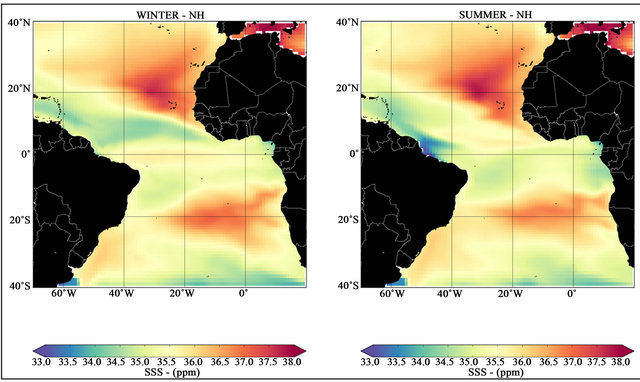
Figure 3. Mean seasonal salinity for NH winter (left) and summer (right) seasons for the period from 2007 to 2016.
4.3. DIC Space-Time Variability
The air-sea exchange of carbon dioxide depends on the CO2 sea-water partial pressure, pCO2 (sw) or generically, the concentration of CO2 dissolved in the surface waters. The global ocean storage of carbon is measured by DIC, which corresponds to the sum of dissolved carbon dioxide, bicarbonate and carbonate ions (see Equation (4)).
Surface water pCO2 (sw) is controlled by SST, SSS, biological uptake of CO2, remineralization of organic carbon back to CO2, air-sea CO2 exchange and mixing with CO2 rich waters from depth [41].
Figure 4 shows the spatial distributions of DIC in surface waters in the study region for summer and winter. According to these results, the concentration of the dissolved inorganic carbon in the region varies between
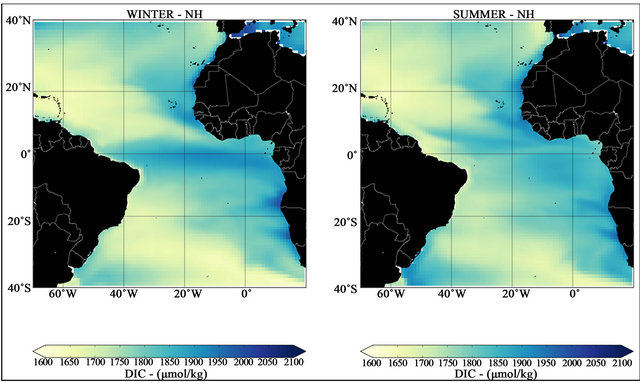
Figure 4. Mean seasonal surface DIC for NH winter (left) and summer (right) seasons for the period from 2007 to 2016.
1600 to 2100 μmol·kg−1; similar variability is reported by [7]. Higher values can be observed in the eastern basin margin in both seasons, in the equatorial Atlantic in the NH winter, and in the Confluence Region in the southwestern Atlantic in the NH summer. Minimum values are arranged diagonally starting from northwest Atlantic zones to southeast basin. Note that during the winter season DIC minimum values in the tropical Atlantic are concentrated in same region of the extensive negative tongue of ΔpCO2 (Figure 2).
According to [42] the surface DIC has higher concentrations in high latitudes and lower concentrations in the tropics, reflecting the increased solubility in colder waters. However, this surface imprint of DIC does not simply convert to the observed or modeled surface DIC distribution. Normally, regions with higher concentrations of DIC in the tropics are located in poorly ventilated parts of the ocean basin [7], showing the close relation between the surface DIC distribution and the physical oceanic processes.
Vertical sections of seasonal means DIC at 30˚W for the first five hundred meters are displayed in Figure 5. Lower values of dissolved inorganic carbon are generally observed in a surface layer of 100 - 150 m. In both seasons, higher DIC concentrations below the surface layer are observed in a equatorial band (latitudes between 15˚S to 15˚N) with maximum values of 2090 μmol·kg−1 and a slight but visible increase in the NH summer.
4.4. Relationship between Water Temperature, DIC and Biological Activity
In normal conditions, cooler waters hold more DIC [31]. This assertion is consistent with Figure 5, where it is possible to identify the increased values of DIC with lower temperatures (see Figure 6). The significant higher concentration of DIC between latitudes 15˚S to 15˚N is consistent with the observed rise of the nutricline in the equatorial zone associated with the equatorial divergence of surface currents and consequent upwelling [7].
In addition to temperature, another factor that contributes for the lower carbon concentrations in surface layers is the carbon dioxide take up by phytoplankton in sunlit surface waters, creating organic matter by photosynthesis [42,43]. A small fraction of this organic carbon sinks to the deep ocean before being respired and returned to inorganic form by bacteria, which then increases DIC at depth [7]. The biological formation of organic matter leads to an ocean drawdown of atmospheric CO2, which is then transferred to the ocean interior through the fallout of organic matter [2]. The respiration of the organic matter then regenerates the inorganic nutrients and carbon, increasing their concentrations in the deep waters [4]. The return of deep water to the surface leads to a renewal of the cycle. Seasonal mean vertical sections of chlorophyll concentration (a proxy of primary productivity) are presented in the Figure 7. The phytoplankton bloom in both seasons is mostly concentrated in the equatorial Atlantic due to the high concentrations of nutrients uplifted to the surface euphotic layer by the equatorial upwelling.
In mid-latitude regions, Figure 7 shows another increase of chlorophyll. In these regions as indicated in Figure 2, the CO2 fluxes are predominantly negative (air-to-sea CO2 fluxes) and the thermocline shallower (see Figure 6). According to [23] the carbon concentrations are more strongly affected by temperature than by
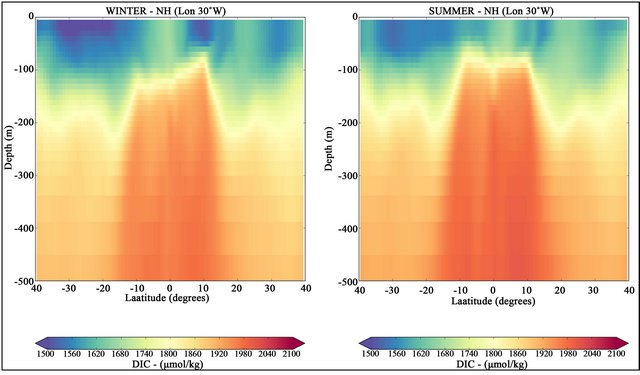
Figure 5. Latitudinal sections of DIC concentrations along the longitude 30˚W. NH winter (in left) and NH summer (in right) for the period from 2007 to 2016.
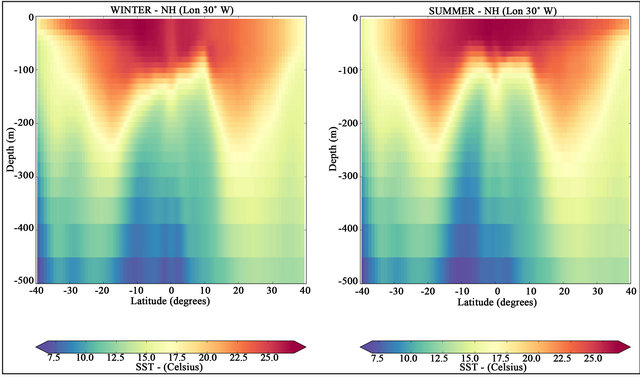
Figure 6. Latitudinal sections of temperature distributions along the longitude 30˚W. NH winter (in left) and NH summer (in right) for the period from 2007 to 2016.
biological factors. For all soluble gases, the solubility increases with decreasing water temperature. The colder the water, the slower the average speed associated with the Brownian motion of dissolved gas molecules and the lower the probability that they escape across the air-water interface [31]. The solubility of CO2 in sea-water increases by more than a factor of two as temperature increases across the range of surface ocean waters [42].
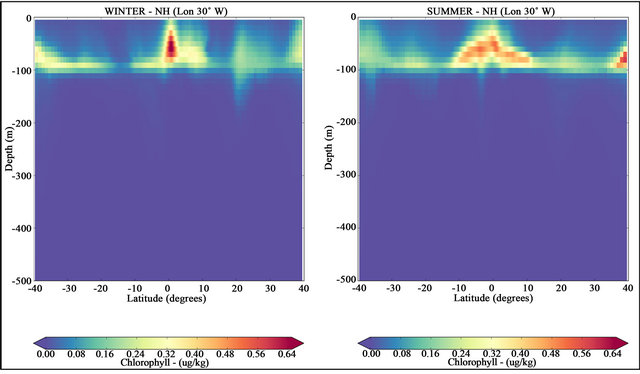
Figure 7. Latitudinal sections of chlorophyll concentrations along the longitude 30˚W. NH winter (in left) and NH summer (in right) for the period from 2007 to 2016.
5. Conclusions
In this paper we have used BESM-OA2.3 coupled model integrated with TOPAZ to analyse space and seasonal variability of CO2 balance in the mid-latitude and tropical Atlantic for the period 2007-2016. The ΔpCO2 in the tropical Atlantic shows very clearly the high dominance of positive fluxes, that is, the CO2 fluxes are sea-to-air throughout the tropical region and for both winter and summer periods. In the mid-latitudes regions negatives fluxes (air-to-sea) were observed being in both seasons.
During the NH winter, a large negative area of ΔpCO2 is observed in the tropical Atlantic. An analysis of salinity shows this area coincident to a low surface salinity area (Figure 3) which is produced by an excess of precipitation over evaporation (negative E-P). This meteorological factor, contributes to a salinity dilution and consequently affects the CO2 dissociation constants (Equations (8) and (9)). The direct effect is a change of sign in the carbon fluxes in the tropical Atlantic where normally the balance E-P is positive. In the NH summer, the tropical region is affected by the North Equatorial Counter Current (NECC) intensification. This occurs due to the typical NBC retroflection in this season that contributes to a detachment of the plume from the coast anticyclonically and retroflecting it to northeast into the WTNA. According to [35], the NBC retroflection occurs at 6˚N - 8˚N, feeding the NECC’s annual peak flow. This process favors the formation of a carbon sink in the adjacent region of the Amazon River mouth (see Figure 2).
Seasonal effects on ΔpCO2 can also be clearly observed in the mid-latitude Atlantic, where an expansion of negative values of this variable is present during the winter period of each hemisphere associated with a cooling of surface waters. The direct effect is an increase of the carbon sink ability for these regions during the winter months.
Model results show lowest values of DIC in a surface layer of about 100 - 150 m. Highest DIC values are observed in deeper layers and concentrated in an equatorial band between ±10˚ - 15˚ of latitude. This pattern computed by the coupled model is consistent with the literature [1,7,22], indicating the ability of BESM coupled model integrated with TOPAZ to reproduce the natural biogeochemical dynamics in the Atlantic basin. The enhancement of the carbon stored in the deep ocean is a direct consequence of the higher solubility of gases at lower temperatures [22,40]. On the other hand, the phytoplankton growth is affected by the vertical DIC distribution. After the carbon dioxide take up in the sunlit surface waters, the phytoplankton creates organic matter. A small fraction of this organic carbon sinks to the deep ocean before being respired and returned to inorganic form by bacteria, which then increases DIC at depth [7]. The model computed surface DIC was consistent with [41]. Regions with higher concentrations of DIC in the tropics are located in poorly ventilated parts of the ocean basin normally located in the eastern margin of the Atlantic, showing the close relation between the surface DIC distribution and the physical oceanic processes.
The chlorophyll bloom in equatorial zones was well represented by the model results. These blooms are the result of equatorial upwelling that brings the high concentration tongues of DIC present in the equatorial band towards the euphotic zone.
Even being the first effort of using BESM-OA2.3 coupled model integrated with TOPAZ for biogeochemical ocean/atmosphere interactions, the presented results were shown to be consistent to the main regional carbon dynamic features of the mid-latitude/tropical Atlantic as described in the literature [4,28,37,40]. At present an effort is being done to incorporate into the model the biogeochemistry of rivers. In the simulations presented in this paper, river outputs were just freshwater outflows.
6. Acknowledgements
This study was partly funded by Rede Brasileira de Pesquisas sobre Mudanças Climáticas Globais (Rede CLIMA) through a National Council for Scientific and Technological Development (CNPq) postdoctoral fellowship for the first author at CPTEC/INPE.
REFERENCES
- J. L. Sarmiento and N. Gruber, “Ocean Biogeochemical Dynamics,” Princeton University Press, Princeton, 2006.
- C. D. Winn, Y. H. Li, F. T. Mackenzie and D. M. Karl, “Rising Surface Ocean Dissolved Inorganic Carbon at the Hawaii Ocean Time-Series Site,” Marine Chemistry, Vol. 60, No. 1-2, 1998, pp. 33-47. doi:10.1016/S0304-4203(97)00085-6
- T. M. Hall, T. W. N. Haine and D. W. Waugh, “Inferring the Concentration of Anthropogenic Carbon in the Ocean from Tracers,” Global Biogeochemical Cycles, Vol. 16, No. 4, 2002, pp. 1-15. doi:10.1029/2001GB001835
- D. C. E. Bakker, H. J. W. Baar and E. Jong, “The Dependence on Temperature and Salinity of Dissolved Inorganic Carbon in East Atlantic Surface Waters,” Marine Chemistry, Vol. 65, No. 3-4, 1999, pp. 263-280. doi:10.1016/S0304-4203(99)00017-1
- S. C. Doney, I. Lima, A. R. Feely, D. M. Glover, K. Lindsay, N. Mahowald, J. K. Moore and R. Wanninkhof, “Mechanisms Governing Interannual Variability in Upper-Ocean Inorganic Carbon System and Air-Sea CO2 Fluxes: Physical Climate and Atmosphere Dust,” DeepSea Research Part II, Vol. 56, No. 8-10, 2009, pp. 640- 655.
- Z. Liu, W. Dreybrodt and H. Wang, “A New Direction in Effective Accounting for the Atmospheric CO2 Budget: Considering the Combined Action of Carbonate Dissolution, the Global Water Cycle and Photosynthetic Uptake of DIC by Aquatic Organisms,” Earth-Science Reviews, Vol. 99, No. 3-4, 2010, pp. 162-172. doi:10.1016/j.earscirev.2010.03.001
- R. G. Williams and M. J. Follows, “Ocean Dynamics and the Carbon Cycle,” Cambridge University Press, Cambridge, 2011.
- G. L. Hunt and P. J. Stabeno, “Climate Change and the Control of Energy Flow in the Southeastern Bering Sea,” Progress in Oceanography, Vol. 55, No. 1-2, 2002, pp. 5-22. doi:10.1016/S0079-6611(02)00067-8
- N. R. Bates, M. H. P. Best and D. A. Hansell, “SpatioTemporal Distribution of Dissolved Inorganic Carbon and Net Community Production in the Chukchi and Beaufort Seas,” Deep-Sea Research Part II, Vol. 52, No. 24-26, 2005, pp. 3324-3343. doi:10.1016/j.dsr2.2005.10.003
- J. T. Mathis, N. R. Bates, D. A. Hansell and T. Babila, “Net Community Production in the Northeastern Chukchi Sea,” Deep-Sea Research Part II, Vol. 56, No. 17, 2009, pp. 1213-1222, 2009. doi:10.1016/j.dsr2.2008.10.017
- A. Samuelsen, L. Bertino and C. Hansen, “Impact of Data Assimilation of Physical Variables on the Spring Bloom from TOPAZ Operational Runs in the North Atlantic,” Ocean Science, Vol. 5, No. 4, 2009, pp. 635-647. doi:10.5194/os-5-635-2009
- N. Wen, Z. Liu, Q. Liu and C. Frankignoul, “Observations of SST, Heat Flux and North Atlantic Ocean-Atmosphere Interaction,” Geophysical Research Letters, Vol. 32, No. 17, 2005, pp. 1-4.
- C. Lé Quére, O. Aumont, P. Monfray and J. Orr, “Propagation of Climate Events on Surface Stratification, Marine Biology and CO2: Case Studies over the 1979-1999 Period,” Journal of Geophysical Research: Oceans, Vol. 108, No. C12, 2003, pp. 1-14.
- J. W. Hurrel and C. Deser, “North Atlantic Climate Variability: The Role of the North Atlantic Oscillation,” Journal of Marine Systems, Vol. 78, No. 1, 2009, pp. 28-41. doi:10.1016/j.jmarsys.2008.11.026
- J. While, I. Totterdell and M. Martin, “Assimilation of pCO2 Data into a Global Coupled Physical-Biogeochemical Ocean Model,” Journal of Geophysical Research, Vol. 117, No. C3, 2012.
- A. Griesel and A. M. Maqueda, “The Relatzion of Meridional Pressure Gradients to North Atlantic Deep Water Volume Transport in an Ocean General Circulation Model,” Climate Dynamics, Vol. 26, No. 7-8, 2006, pp. 781- 799. doi:10.1007/s00382-006-0122-z
- M. Manizza, M. J. Follows, S. Dutkiewicz, D. Menemenlis, J. W. McClelland, C. N. Hill, B. J. Peterson and R. M. Key, “A Model of the Artic Ocean Carbon Cycle,” Journal of Geophysical Research, Vol. 116, No. C12, 2011.
- P. Nobre, R. A. De Almeida, M. Malagutti and E. Giarolla, “Coupled Ocean-Atmosphere Variations over the South Atlantic ocean,” Journal of Climate, Vol. 25, No. 18, 2012, pp. 6349-6358. doi:10.1175/JCLI-D-11-00444.1
- P. Nobre, et al., “Climate Simulation and Change in the Brazilian Climate Model,” Jornal of Climate, 2012, Submitted.
- S. M. Griffies, “Elements of MOM4p1. NOAA/Geophysical Fluid Dynamics Laboratory,” Princeton, 2009, pp. 444.
- J. P. Dunne, A. Gnadesikan, J. L. Sarmiento and R. D. Slater, “Technical Description of the Prototype Version (v0) of Tracers of Phytoplankton with Allometric Zooplankton (TOPAZ) Ocean Biogeochemical Model as Used in the Princeton IFMIP Model,” Biogeosciences Supplement, Vol. 7, 2010, pp. 3593-3624.
- M. Wakita, S. Watanabe, A. Murata, N. Tsurushima and M. Honda, “Decadal Change of Dissolved Inorganic Carbon in the Subartic Western North Pacific Ocean,” Tellus B, Vol. 62, No. 5, 2010, pp. 608-620.
- F. J. Millero, “The Marine Inorganic Carbon Cycle,” Chemical Review, Vol. 107, No. 2, 2007, pp. 308-341. doi:10.1021/cr0503557
- Z. Liu, W. Dreybrodt and H. Wang, “A New Direction in Effective Accounting for the Atmospheric CO2 Budget: Considering the Combined Action of Carbonate Dissolution, the Global Water Cycle and Photosynthetic Uptake of DIC by Aquatic Organisms,” Earth-Science Reviews, Vol. 99, No. 3-4, 2010, pp. 162-172. doi:10.1016/j.earscirev.2010.03.001
- R. F. Weiss, “CO2 in Water and Seawater: The solubility of Non-Ideal Gas,” Marine Chemistry, Vol. 7, No. 3, 1974, pp. 203-215. doi:10.1016/0304-4203(74)90015-2
- C. Mehrbach, C. H. Culberson, J. E. Hawley and P. Pytkowicz, “Measurement of the Apparent Dissociation Constants of Carbonic Acid in Seawater at Atmosphere Pressure,” Limnology and Oceanography, Vol. 18, No. 6, 1973, pp. 898-907. doi:10.4319/lo.1973.18.6.0897
- World Data Centre for Greenhouse Gases (WDCGG), “Mauna Loa CO2 Data,” 2012. http://ds.data.jma.go.jp/gmd/wdcgg/
- D. J. Cooper, A. J. Watson and R. D. Ling, “Variation of pCO2 along a North Atlantic Shipping Route (UK to the Caribbean): A Year of Automated Observations,” Marine Chemistry, Vol. 60, No. 1-2, 1998, pp. 147-164. doi:10.1016/S0304-4203(97)00082-0
- T. Takahashi, S. C. Sutherland, R. Wanninkhof, C. Sweeney, R. A. Feely, D. W. Chipman, B. Hales, G. Friederich, F. Chavez, A. Watson, D. C. E. Bakker, U. Schuster, N. Metzl, H. Yoshikawa-Inoue, M. Ishii, T. Midorikawa, Y. Nojiri, C. Sabine, J. Olafsson, Th. S. Arnarson, B. Tilbrook, T. Johannessen, A. Olsen, Richard Bellerby, A. Körtzinger, T. Steinhoff, M. Hoppema, H. J. W. de Baar, C. S. Wong, B. Delille and N. R. Bates, “Climatological Mean and Decadal Changes in Surface Ocean pCO2, and Net Sea-Air CO2 Flux over the Global Oceans,” DeepSea Research II, Vol. 56, No. 8-10, 2009, pp. 554-577. doi:10.1016/j.dsr2.2008.12.009
- ECMWF, “ERA-40 Atlas,” 2006. http://www.ecmwf.int/research/era/ERA-40_Atlas/docs/section_B/
- S. Emerson and J. Hedges, “Chemical Oceanography and the Marine Carbon Cycle,” Cambridge University Press, Cambridge, 2008. doi:10.1017/CBO9780511793202
- T. Takahashi, J. Olafsson, J. G. Goddard, D. W. Chipman and S. C. Sutherland, “Seasonal Variation of CO2 and Nutrients in the High-Latitude Surface Oceans: A Comparative Study,” Global Biogeochemical Cycles, Vol. 7, No. 4, 1993, pp. 843-878. doi:10.1029/93GB02263
- S. J. Lentz, “Seasonal Variations in the Horizontal Structure of the Amazon Plume Inferred from Historical Hydrographic Data,” Journal of Geophysical ResearchOceans, Vol. 100, No. C2, 1995, pp. 2391-2400. doi:10.1029/94JC01847
- W. R. Geyer, R. C. Beardsley, S. J. Lentz, J. Candela, R. Limeburner, W. E. Johns, B. M. Castro and I. D. Soares, “Physical Oceanography of the Amazon Shelf,” Continental Shelf Research, Vol. 16, No. pp. 1996, 575-616.
- C. A. Nittrouer and D. J. DeMaster, “The Amazon Shelf Setting: Tropical, Energetic, and Influenced by a Large River,” Continental Shelf Research, Vol. 16, No. 5-6, 1996, pp. 553-573. doi:10.1016/0278-4343(95)00069-0
- R. L. Bourles, B. Molinari, E. Johns, W. D. Wilson and K. D. Leaman, “Upper Layer Currents in the Western Tropical North Atlant (1989-1991),” Journal of Geophysical Research-Oceans, Vol. 104, No. C1, 1999, pp. 1361- 1375. doi:10.1029/1998JC900025
- D. M. Fratantoni and D. A. Glickson, “North Brazil Current Ring Generation and Evolution Observed with SeaWiFS,” Journal of Physical Oceanography, Vol. 32, No. 3, 2002, pp. 1058-1074. doi:10.1175/1520-0485(2002)032<1058:NBCRGA>2.0.CO;2
- C. A. Nittrouer and D. J. DeMaster, “The Amazon Shelf Setting: Tropical, Energetic, and Influenced by a Large River,” Continental Shelf Research, Vol. 16, No. 5-6, 2006, pp. 553-573. doi:10.1016/0278-4343(95)00069-0
- J. F. Ternon, C. Oudot, A. Dessier and D. Diverres, “A Seasonal Tropical Sink for Atmospheric CO2 in the Atlantic Ocean: The Role of the Amazon River discharge,” Marine Chemistry, Vol. 68, No. 3, 2000, pp. 183-201. doi:10.1016/S0304-4203(99)00077-8
- A. Körtzinger, “A Significant CO2 Sink in the Tropical Atlantic Ocean Associated with the Amazon River Plume,” Geophysical Research Letters, Vol. 30, No. 24, 2003, pp. 2287-2290. doi:10.1029/2003GL018841
- E. H. Shadwick, H. Thomas, M. Chierici, B. Else, A. Fransson, C. Michel, L. A. Miller, A. Mucci, A. Niemi, T. N. Papakyriakou and J. E. Tremblayh, “Seasonal Variability of the Inorganic Carbon System in the Amundsen Gulf Region of the Southeastern Beaufort Sea,” Limnology and Oceanography, Vol. 56, No. 1, 2011, pp. 303- 322. doi:10.4319/lo.2011.56.1.0303
- R. M. Key, A. Kozyr, C. L. Sabine, K. Lee, R. Wanninkhof, J. L. Bullister, R. A. Feely, F. J. Millero, C. Mordy and T.-H. Peng, “A Global Ocean Carbon Climatology: Results from Global Data Analysis Project (GLODAP),” Global Biogeochemical Cycles, Vol. 18, No. 4, 2004, pp. 1-25. doi:10.1029/2004GB002247
- P. Brandt, V. Hormann, A. Kortzinger, M. Visbeck, G. Krahmann, L. Stramma, R. Lumpkin and C. Schmid, “Changes in the Ventilation of the Oxygen Minimum Zone of the Tropical North Atlantic,” Journal of Physical Oceanography, Vol. 40, No. 8, 2010, pp. 1784-1801. doi:10.1175/2010JPO4301.1