International Journal of Geosciences
Vol. 3 No. 4A (2012) , Article ID: 23226 , 13 pages DOI:10.4236/ijg.2012.324084
Numerical and Geophysical Tools Applied for the Prediction of Mine Induced Seismicity in French Coalmines
Institut National de l’Environnement Industriel et des Risques, ARTEM Campus, Nancy, France
Email: Marwan.alheib@ineris.fr
Received July 19, 2012; revised August 21, 2012; accepted September 1, 2012
Keywords: Induced Seismicity; Numerical Modelling; Rockburst; Mining Design
ABSTRACT
The determination of the influence of mining works and the induced seismicity is essentially obtained, separately from in-situ observations and seismic analysis, field measurements (particularly surface survey) as well as from numerical investigations. The paper presents a methodology applied for the analysis of induced seismicity due to underground coalmines based on combining numerical modelling and seismic analysis. The methodology is based on the comparing between the observations, the seismic activity and the numerical modelling for establishing a close correlation between the location of seismic activity and the induced stresses. The paper presents two case studies using seismic and geotechnical investigations, the first one concerns a fatal accident affected Lorraine coalmine (East France). The second case concerns the application of the methodology on Provence coalmines (South France). The application of the methodology shows such a coupling can be an efficient way for detecting areas subjected to rockburst hazard. This is also a powerful tool for assisting the planning of underground workings in complex geological and mining conditions. The coupling of geotechnical investigations (numerical modelling, in-situ stress measurements) and seismic analysis are strongly recommended.
1. Introduction
The principal coalmine method is long-wall (panel) with goaf. The goaf corresponds on broken layers of the roof of the coal seam. This method allows excavating large surface, and the panel dimension is about 200 m width and more than 1 km length. Several panels can be excavated and formed mine zones.
Mining operations, at great depths (>600 m), induce a redistribution of the field stress based on the rheological and mechanical behaviour of the rock-mass. This can lead to substantial induced seismicity [1-3], and is often accompanied by rockbursts [4,5].
The initial stress state is modified when a long-wall is excavated (Figure 1). The mass reaches a new equilibrium in the new configuration. As the face advances, the dimensions of the panel increase and the stresses increase as a result both of the intensity and volume affected by the underground work. This process continues until the roof strata are bearing on the goaf: in this case, we speak of a stress pattern at the back of the face. The size corresponding to a permanent regime is variable. The final outcome and the behaviour of the strata (as regards fracturing and cracking) specifically depend upon the geology and geotechnical conditions [3,4]. The in situ observations and measurements, allow engineers for describing the volume of influence of mine works.
In France, the geology and the coalmines conditions became more dangerous and mines were closed due to seismic activities. The depth of last excavations was over than 1250 m below the surface. The presence of many faults, many seams as well as the variation of geological conditions induces numerous difficulties in the prediction of strata behaviour during mine advancing and the control of rockburst consequences.
2. The Seismicity in Mines
The induced mine seismicity characterized by a magnitude range from –0.2 to 4 [3,4]. The focal depth is generally less than 1 to 2 km. There are many factors that correlate positively with the potential of large(r) dynamic rock mass instability, e.g.:
• tectonic and initial stresses, depth, mechanical compression strength of the intact rock;
• the existence and the frequency of intermediate and larger geological features, specifically when parallel to the excavation faces and/or when their shear strength is comparable to shear stresses close to excavations;
• long-wall type mine layout (as opposed to scatter mining layouts) without regional support (stabilising pillars, backfill) and with straight face shapes;
• concentrated mining, i.e. the proximity of a number of active faces excavating a large volume of rock;
• volume mined to date;
• mining remnants against seismically active structures• rate of face advance, etc.
The dynamic rock mass instability consists of a brutal expulsion of the worked seam accompanied by a violent shock mainly felt in the vicinity of the coal seam where they can cause significant damage such as roadways collapse, failure of pillars or rockburst. Major dynamic events are generally associated with important seismic activity.
From seismic analysis point view, mining induced seismic events can imply three types of rupture mechanisms: 1) implosive mechanism associated with rock mass failures (i.e. block caving); 2) a shear mechanism identified when geological faults are involved; 3) a combination of mechanisms (1) and (2). The associated rupture is rather complex and difficult to interpret particularly when the seismic network coverage is inadequate.
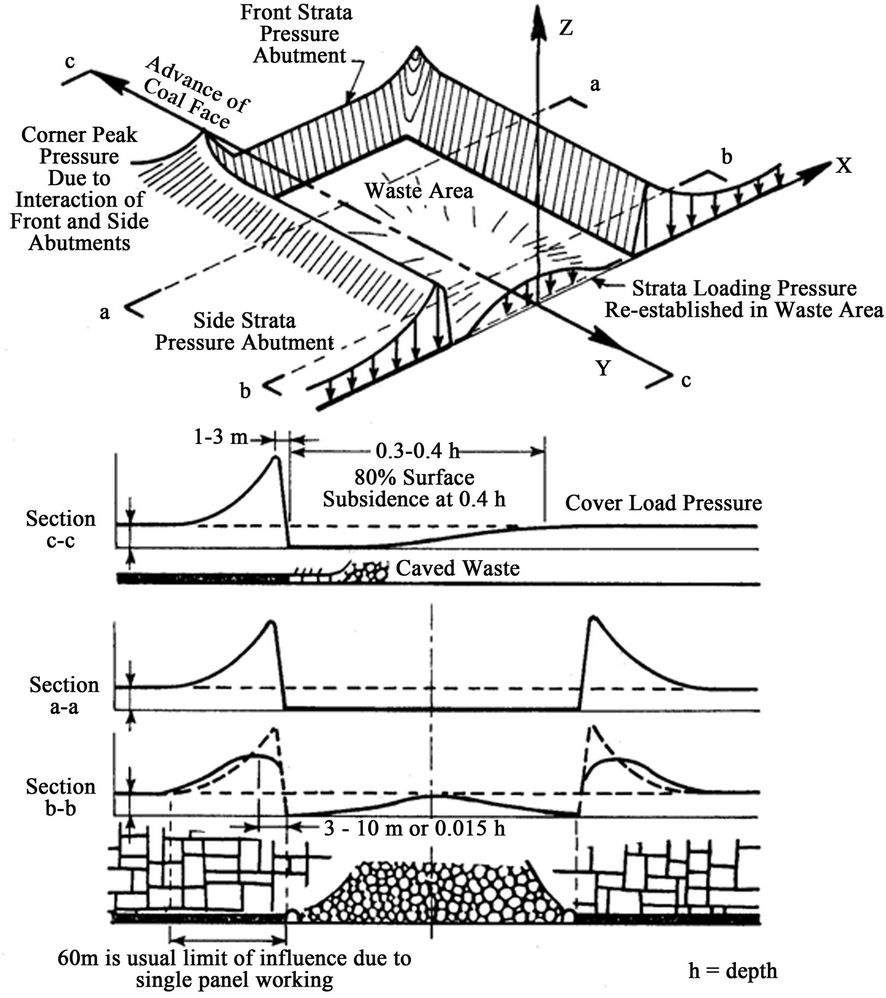
Figure 1. Induced stresses due to an underground long-wall panel.
3. Prediction Methodology of Mining Induced Seismicity
To improve the control of the mining induced seismicity an operational methodology had been developed for managing the seismic activities of the underground coalmines in the last ten years combines numerical modelling, seismic monitoring, stress measurements and back analysis of sever rockburst cases (Figure 2). The interaction between tools allows predicting seismicity and improving the surface installation and mine safety. Two important tools have been applied: seismic monitoring and large-scale numerical modelling. By analysing the mining-induced seismicity, it is possible to identify the particular failure mechanisms that underlie seismic activity [5,6]. The numerical modelling and seismic analysis are used together to help the prediction and the evaluation of rockbursts or collapses occurrence due to fault slip burst [7,8]. The methodology has the principal characteristics:
• a large scale seismic network
• a local scale seismic network
• in-situ stress measurements
• large and local scales numerical modelling.
3.1. Seismic Activity and Monitoring System
The seismic network (local and global) is the main tool for managing rockburst hazard. A seismic network is systematically used to monitor the seismicity associated with coal extraction in French collieries (Lorraine in the north-east and Provence in the south-east). In most minesan integrated seismic network is set up to identify and to manage the rockburst risk [9,10]. The seismic network consists of surface and underground stations installed around mine panels. The sensors are generally geophones with a natural frequency of 1 Hz. The data transmission from the surface network to the central site is done by remote sensing, while underground stations are connected to the site by cables or by a wireless system. The system records a very large number of seismic events during the mining operations. These events are archived daily and an automatic processing is operated to determine the essential parameters: location, magnitude and released energy. Seismograms of events are used to determine the source parameters. The seismicity history of the area in the vicinity of the rockburst and nearby structures (faults) is assessed. The seismic energy of an event is determined according to the following equation:
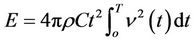 (1)
(1)
r: specific weight of the medium (kN/m3); C: group velocity (propagation velocity of the signal envelope, P and S waves, m/s); t: sensor-source distance (m); n: velocity (m/s); T: pulse duration(s). The seismic energy allows determining the event magnitude. More precisely, seismic energy (E) of the event is fitted to the reference magnitude determined by the French national seismic network using the following equation:
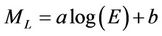 (2)
(2)
a and b are the coefficients fitting the local magnitude (ML).
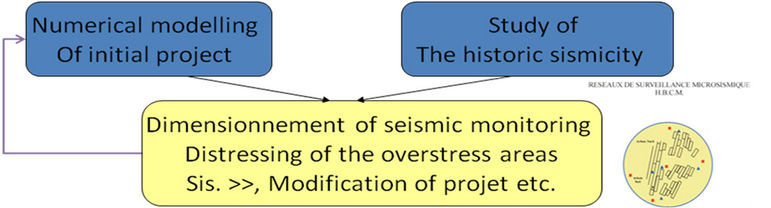
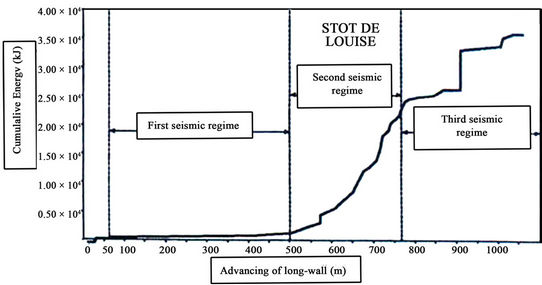
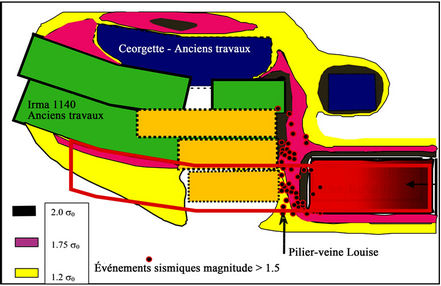
Figure 2. Developed methodology for the control of rockburst hazard in French coalmines.
3.2. Large and Local Scale Numerical Modelling
Wide spectrum of modelling approaches is available for design rock structures [6,11,12]. Numerical modelling applies generally to the back analysis and to the strata control understanding, as well as to the stress redistribution in mining areas. Numerical modelling has also many functions: to choose the orientation of galleries and panels, to determine the influence of mining on other structures and the effect of mining on the surface (subsidence), to determine the dimensions of pillars…For dynamic behaviour (rockburst), numerical modelling becomes the main tool in addition of seismic and geophysical methods. The numerical tools help engineers to have a better view and to control the mining operations.
The numerical modelling has a significant number of advantages: high capacity to simulate mining process, flexibility for studying different configurations, low cost, high precision, etc. [5,11]. In addition, the results of numerical modelling of complex configurations (complex rock mass behaviour, non linear behaviour, coupling, etc.) are widely accepted by scientists and engineers. The Discontinuity Displacement Method is one of these methods, and was improved and developed for mining design. This method is very useful for tabular coalmines as it takes into account large-scale faults and multi-layered media [12-14]. The complex behaviour of rock mass caused by fractures and non-linear matrix behaviour in the near-field of excavation is efficiently handled by FEM or DEM, whereas BEM is of major interest for the representation of far-field region with a linear material behaviour [13,14]. Model input constraints include rock mass parameters (Young modulus, Poisson’s ratio, unit weight, initial or in situ stresses), fault characteristics (tensile strength, cohesion, friction angle, normal and shear stiffness) and mine geometry (panels and faults).
The BEM allows the computation of a large number of openings and/or faults. Consequently, large-scale problems such as long-wall mining can be treated easily [5,11]. It is particularly appropriate for problems involving faults or joints and mining in tabular ore bodies (which extend at most a few meters in one direction and hundreds to thousands meters in the two others directions). Both faults and panels in tabular ore bodies are presented by a plan, whose boundary consists of two sides which are very close to each other (Figure 3).
To illustrate the coupling between numerical modelling and the seismicity analysis, advance face over 100 m were simulated. Figure 4 shows the distribution of the vertical stress contours for five advance steps above 20 m using SUIT3D (DDM, INERIS code). A change in the frontal vertical stress pattern is clearly marked. From these figures (Figure 4), and assuming that the vertical overstress ratio of 1.2 as a limit of significant effect of mining works [5,6], one may notice that the extent of face advance influence goes from 10 m (for an advance of long-wall of 20 m) to 50 m (when 100 m of long-wall is excavated). It should be mentioned that this model does not to explain the failure of the ground (damage, plasticity, fracturing, etc.), but it does show clearly that the influence of mining zones moves forward significantly as the mine workings advance.
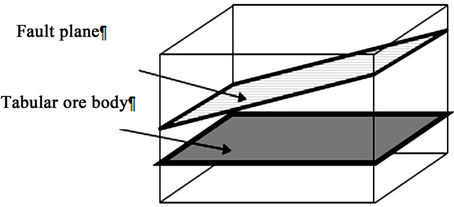
Figure 3. Typical mining problems solved by the DDM and stress distribution.
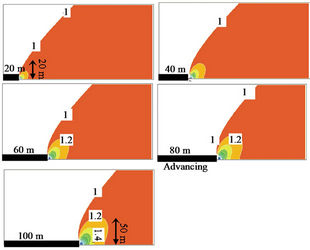
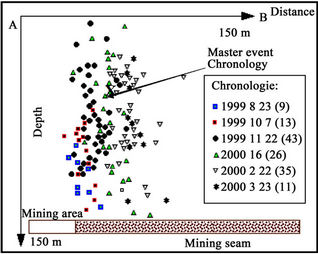
Figure 4. Evolution of vertical stress due to advancing of panel using seismic analysis and numerical modelling (BEM method).
For the same configuration, the micro-seismic events were observed. A seismic analysis was carried out, the method of relative location was applied to the different families of events identified, making it possible to achieve a fairly precise spatial location of the events [15]. The distribution of events shows that the zone affected by intense micro-seismic activity primarily concerns the leading edge of the face and the roof of the mined zone (Figure 5). From seismic analysis, the permanent regime obtained after an advancing distance equal to 100 m. This is obtained from seismic and strain monitoring and corresponding to fracturing cycles. McGarr and Wiebols provided a theory that predicts the total amount of seismicity from the volume of elastic convergence [16]. A linear relationship between the incidence of rockburst and Energy Realise Rate (ERR) was confirmed [17]. The ERR is associated with vertical stress and strain variation.
The most significant result is the demonstration, through the location of micro-seismic activity and the results of numerical modelling, of an extension of the stress pattern developed in the roof of the mined zone. These results are also in accordance with the interpretations stemming from observations on the volume of influence of an undermined long-wall face [15].
3.3. Stress Measurement Methods
To design an underground coalmine subject to seismic and rockburst hazard, it becomes indispensible to know the initial and induced stresses [18,19]. Different in-situ stresses measurement methods exist to determine their values. In France, we started with the technique of flat jack, hydro fracturing and then overcoming techniques [20,21]. In mine, the in-situ stress measurements are executed in three main situations:
• for designing a new panel;
• to control the evolution of the stresses due to mining activities;
• for understanding the occurrence of mining accident conditions.
The overcoring technique uses the CSIRO cell. The method consists of different stages; a main borehole is first drilled from the roadway (roof, floor or wall). A CSIRO cell is then installed in an Ex hole (36 mm, Figure 5), coaxial to the main hole, and drilled at a sufficient distance from the roadway to ensure that the latter had negligible influence on the measured stress. Overcoring is then carried out and the overcore is retrieved for evaluation of its elastic properties. Figure 5 shows an example of the response curves observed on the 12 strain gauges during an overcoring test as a function of the distance overcored. The local stress tensor [s] was estimated from the measured strain variations [e] through the following inversion system:
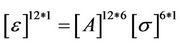 (3)
(3)
where the influence matrix [A] is given by the analytical solution for strain on the walls of an infinite circular hole drilled in homogeneous linear elastic medium and submitted to a far-field stress tensor [s].

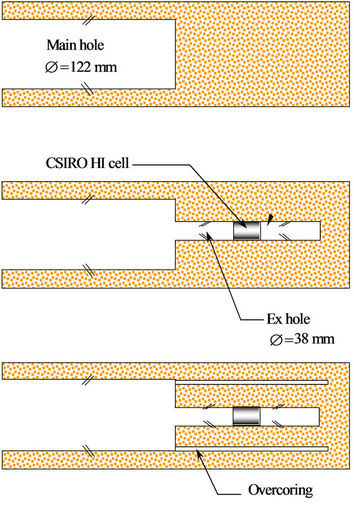
Figure 5. Overcoring stress measurement technique applied to French coalmine [21].
4. Back Analysis of Fatal Accident in Lorraine Coalmine
The first back analysis case study is the fatal accident in Lorraine coalmine. On the 21st of June 2001, a fatal rockburst of local magnitude 3.6 affected the main gate of the coal seam Frieda5 in the Lorraine coalmine. This seismic event occurred at a depth of 1250 m in a complex geological and mining environment [22], involving a large number of panels mined in a multi-layer configuration (Figure 6).
The seismic event initiated at about 50 m under the main gate of the panel while this panel was being exploited, causing a violent heave of the main gate exceeding 2 m [2]. The zone affected by the accident was 250 m long and located between 100 m and 350 m in front of the face (see Figure 7). Boreholes drilled from the accident zone showed the existence of a stiff sandstone bed situated 25 m below the panel and between 15 m and 20 m thick. It is believed that the origin of the dynamic event is the rupture of this bed. A geotechnical campaign based on the previous methodology was carried out to understand the origin of the event: seismic analysis, insitu stress measurements and large scale numerical modelling. The objectives of the back analysis were twofold: 1) to provide input data for the back analysis of the rockburst and 2) to identify other potential high-risk zones in the next panels to be mined.
4.1. Introduction to Lorrain Geology
Sarro-Lorraine coal basin outcropping in Saarland on an area of the order of 500 km2-ENE—WSW (Figure 6). The Lorraine deposit is not outcrops in France. The duration of the deposit of the Lorraine lands stretching from Precambrian to tertiary. Extending to the southwest of the basin of the Saarland. Lorrain deposit has a relatively complex geological structure with the existing of many major faults and folds. The coal seams have a variable thickness (from a few centimeters to four or five meters, unusually fifteen meters, or more for the thickest). The overburden strata are generally considered as globally relevant and stiff because they are thick and resistant (sandstone, shale), with compression strength near 100 MPa. The geological characteristics of the deposit are very diverse and the operating conditions led to three different mine: horizontal, sub-horizontal and in step mines including the dip of the layers varies from 20 to 90˚. The depth of the operation ranged from 500 and 1250 m. Exploitation began in 1835 and intense exploitation was from 1949.
4.2. Seismic Analysis
In Lorraine coalmine two different microseismic networks are integrated: The first one is a seismic network for monitoring the mining operations at a regional scale and consisting of 14 recording stations (11 free-fields and three undergrounds) with vertical component geophones (natural frequency of 1 Hz). The seismic activity is recorded in the frequency band of 1 - 30 Hz. The second one is a seismoacoustic network monitoring the mining operations at a local scale in the vicinity of the coal face. It’s composed of 14 high frequency geophones (natural frequency of 14 Hz) installed along the main and head gates. This network provides a continuous recording in the frequency band of 14 - 400 Hz and allows daily analysis of the released seismoacoustic energy.
The analysis of the seismogram and in particular the P-wave’s first arrival has been used to estimate the spatial position of the 3.6 magnitude seismic event. The focus of the event is located about 200 m below the main gate of Frieda5 panel, approximately 150 m in front of the long-wall face (Figure 8). This corresponds to depth of 1400 m below the surface.
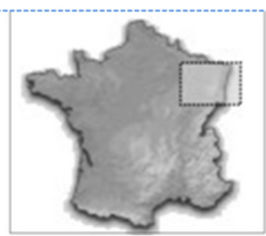
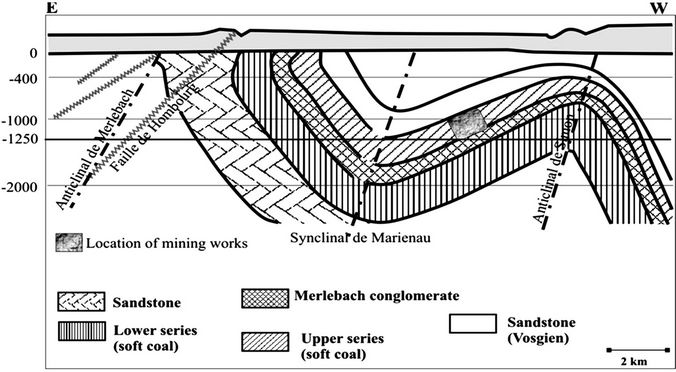
Figure 6. Geological setting of the Lorraine coalmine, France.
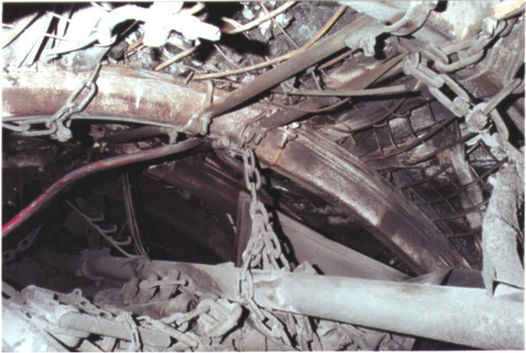
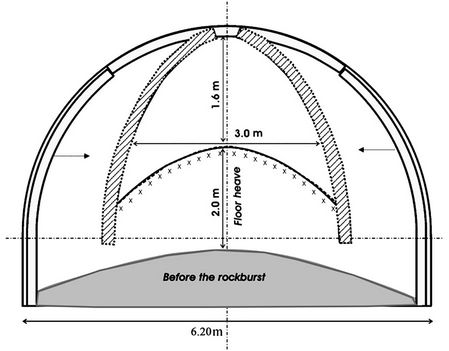
Figure 7. Schematic view of the floor heaving effect (dashed part) in the main gate of the Frieda5 long-wall panel after the rockburst occurrence.

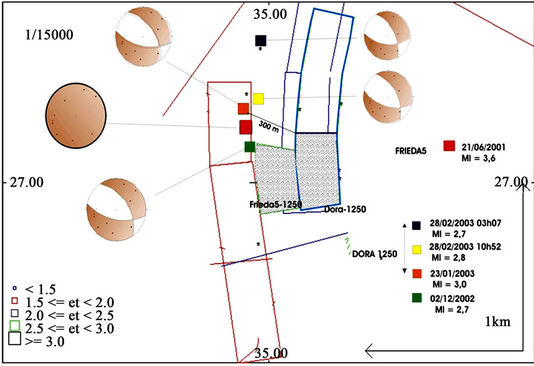
Figure 8. Location of the rockburst-induced event (Ml = 3.6) and sesimoacoustic events recorded during the mining of Frieda5 long-wall panel.
An event with 2.4 preceded the rockburst in March 2001 was localized at the same position in the main gate but at shallower depth (1157 m). Since the start of mining operations and before the rockburst, the strongest recorded seismic events (magnitude greater than 2.5) were attributed to a pillar characterized by high stress concentration effect caused by the so called Louise pillar (unmined blocks in between long-wall panels) located behind the Frieda5 panel. Stress concentration due to old mining panels surrounding this pillar induces systematically seismic activity in adjacent coal faces [23].
The seismoacoustic network has recorded more than 1000 events related to the mining operations of the Frieda5 and the underlying Erna 3 panel. Indeed, the small events are generally filtered through their propagation in the overburden. Figure 8 shows that the events are localized mostly ahead of the Frieda5 face and behind the face of the almost mined out Erna 3 panel. The detailed time analysis of the seismoacoustic activity reveals that the events in the accident zone started a few months before the rockburst, approximately 400 m ahead of the front of Frieda5.
The analysis of the P-wave first motion for the major event of 21st June, 2001 has allowed the identification of an unusual “explosive” rupture mechanism (pure compression) induced by a high horizontal stress. On the other hand, the 2.4 magnitude event that was recorded at 9:38 PM, about 20 minutes before the rockburst related event, revealed a shear mechanism. Prior to the rockburst, seismoacoustic events occurred in the accident zone at about 400 m ahead of the long-wall face. This seismic behaviour can be attributed to a “precursor phenomenon” of the big event.
We have examined the daily evolution of the cumulated energy with respect to the number of recorded events. The results highlight three main phases: during the first two months, the increase of the energy level was associated with the seismic events localized on Louise pillar (high stress concentration). The second phase corresponds to important increase of recoded events but the dissipated energy remains relatively low, the estimated dissipation rate being 5 × 10⁵ J/m. During the last two months of mining and before the accident, we observed a slight decrease in the seismoacoustic activity while the elastic energy increased faster and has reached the rate of 2 × 10⁶ J/m, four times greater than the rate of the second mining phase. On June 21, 2001, the accumulated elastic energy released a violently strong seismic event that resulted in fatalities.
A back analysis has been carried out on the historical seismic activity related to the cutting faces located in the Frieda sector. The results highlighted four events of local magnitude greater than 2.0 located in the affected zone of Frieda5.
4.3. In-Situ Stress Measurements
Unlike the seismic techniques, in-situ stress measurements are not commonly used to systematically monitor the mining operations. In order to get information on the state of stress existing prior to the accident, it was decided to perform a couple of overcoring tests at point 800 in the main gate, which was judged to be sufficiently far from the accident zone for the state of stress measured at that point not to be influenced by the accident while remaining close enough for the stress measured to be representative of the one existing in the accident zone before the event. Two other overcoring tests were carried out at point 900, i.e. in the affected zone (Figure 9).
The in-situ stress measurement shows that the horizontal stress is greater than the vertical stress; the anisotropic of stresses increase significantly the risk of dynamic failure and inducing rockburst. Stress measurements have provided crucial data for analyzing the causes of the 21st June 2001 accident. They have also been used to formulate specific prevention plans for the mining of the next long-wall, which to date have met successful results. In Lorrain colliery, stress measurements carried out following the 21st June 2001 rockburst provided valuable information for understanding the dynamic phenomenon; this encouraged the systematic use of this method in the design of future planned panels. The joint analysis of the seismic, geological and geotechnical investigations suggest that the rockburst is largely due to a specific geological condition, a sandstone channel in the floor of the coal seam characterized by high horizontal stress.
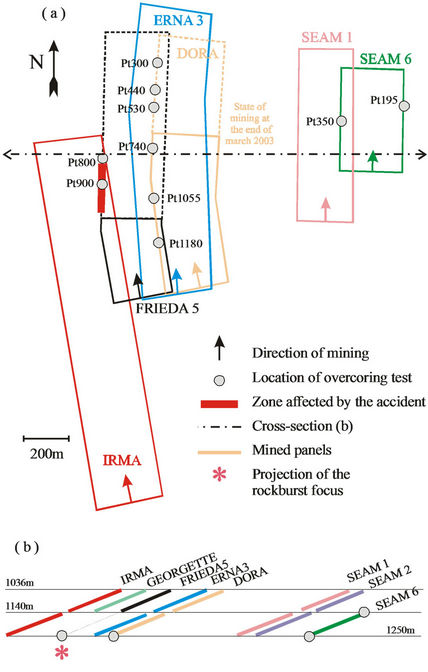
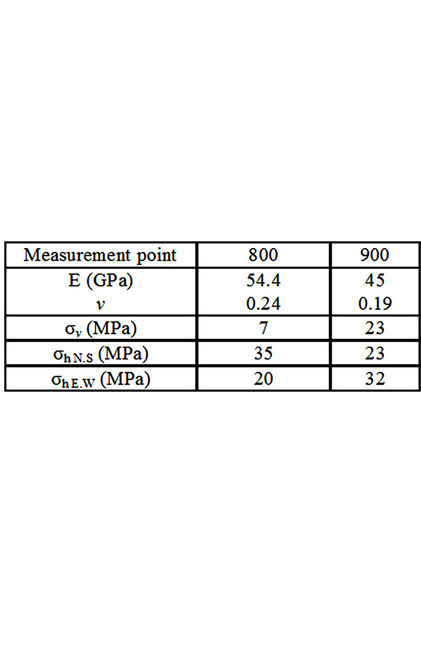
Figure 9. Orthogonal view (a) and schematic cross section (b) of the mined panels in the studied mining district at the end of March 2003.
4.4. Numerical Modelling
The large scale model using the SUIT3D program [5,6] was intended to achieve two objectives, firstly to find the initial tensor before mining started, and variations in the stress tensor close to the area of the accident. The results obtained were as follows:
• mining operations in the Irma-1250 panel considerably modified the distribution of normal, horizontal and axial stresses and overstress areas correspond to the Louise TB zone and the zone ahead of the Irma-1250 face;
• furthermore, the influence of mining operations in the Frieda5-1250 panel is limited to zones close to the part of the panel from which coal has been extracted, and in particular it appears weak in the part of the level affected by the accident.
A vertical 2D large scale model using UDEC corresponds to a north south section and only includes the level face. The considerable extent of the level face implied a prior mechanism consisting of a long beam in bending built at its ends by zones with vertical over stresses. The geometry of the model is built up using boreholes results, at 50 m from the zone affected by the rock burst. Loads applied to the model were determined using large scale results; we have a stress field demonstrating the situation before the accident for the entire Frieda5-1250 panel (Figure 10). Figure 11 illustrates an empirical rupture mechanism model to explain the rockburst phenomenon. In the proposed model, the redistribution of stresses caused by the specific mine layout created unusually high levels of local, static loading which in turn triggered a dynamic fracturing event in the underlying sandstone. The presence of a competent sandstone layer below the mining zone associated with high horizontal stresses (tectonic origin) seems to be a major contributing factor for the rockburst phenomenon [4].
4.5. Conclusions
Seismic analysis has proven its capabilities in monitoring mining activities and identifying risk zones (Figure 11). However, this study has also pointed out the limitations of predicting major mining induced phenomena merely on the basis of seismic analysis.
The results provided by the joint analysis of the numerical modelling, in-situ stress measurements and seismic data suggest that the presence of a local geological anomaly is responsible for the strong seismic event. A sandstone channel in the floor of the coal seam and overall high horizontal stresses are regarded as the main contributing factors for the rockburst event.

Figure 10. Transversal numerical model across the roadway.

Figure 11. Schematic representation of the inferred rupture mechanism associated with the rockburst.
5. Application to a Panel of Provence Colliery in a Faulted Zone
The second case study concerns the Provence colliery; it is situated in south-eastern France, between the cities of Marseille and Aix-en-Provence. The depth of the mine varies between 1000 and 1250 m before closing the mine. The dip of this seam is less than 10˚ [20].
5.1. Introduction to Lorrain Geology
Provence coalmine belongs to the basin of the Arc which is located in Western Provence and form a whole elongated from East to West on 70 km (Figure 12). It extends from North to South, about a dozen kilometers, it expands in its western part at the same time drops to the level of the sea. The mountain ranges surrounding the basin have also likely to lower to the West. In General, the dip of the layers is low: 8˚ to 15˚ from East to West. More recovery consists of banks of limestone very resistant (up to 150 simple compressive strength MPa) alternating with over consolidated marl: it is referred to as appropriate.
The collieries of Provence there operate coal (lignite). There are two types of fields separated by the fault of the Diote (Figure 13): deposit thrust (multi layers) located to the South and that is more operated since 1968. The deposit in place, regular and relatively faulted, which only the so-called layer mine (23.4 m opening to a depth of 600 to 1400 m) is enabled and which sites are currently concentrated.
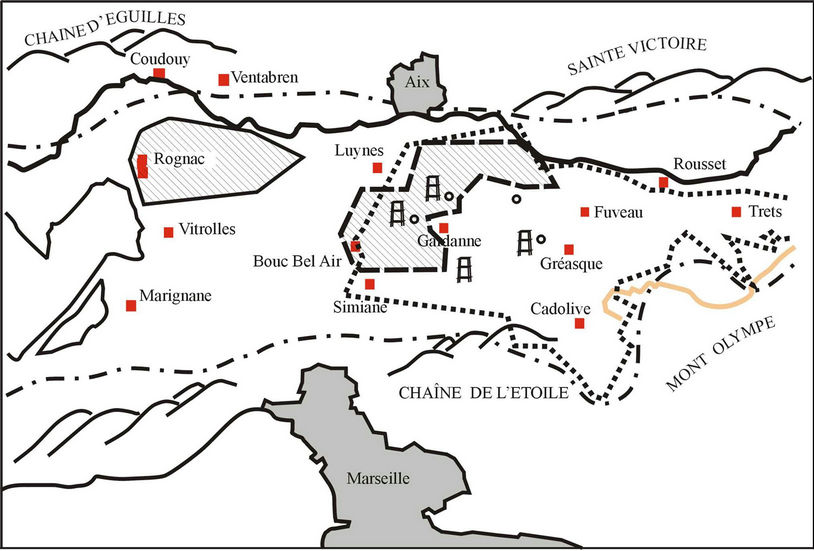
Figure 12. Situation geographic of Provence coalmine.
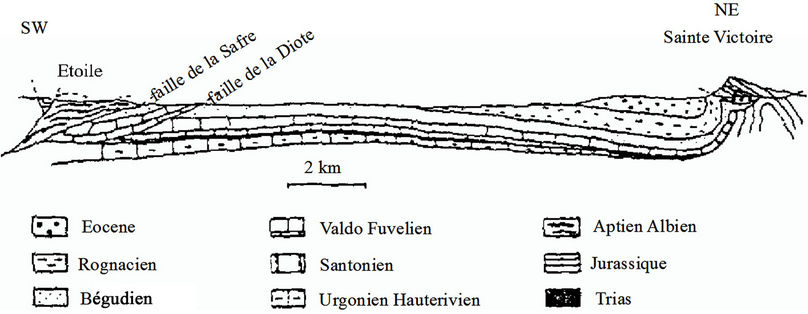
Figure 13. Coupe géologique transversale du bassin houiller de Provence.
5.2. Description of Provence Induced Seismicity
An important feature of the mine is the exceptional stiffness of the overburden and sidewalls. The roof is quite competent, assuring its relative stability. However the stiffness of the roof is the source of rockbursts caused by sudden release of stored energy due to the initial state of stress and the stresses induced by the excavation. The other important characteristic is the presence of many faults around the mined area. This is one of the main factors in the occurrence of rockburst resulting in a sudden and explosive release of elastic energy stored in the strata when the natural and/or mining-induced stresses are relaxed. A global seismic network was installed on the surface to record mine seismicity. For example, between January 1998 and July 2000, the microseismic network recorded 17,661 microseismic events.
5.3. Design of T05 Panel
The case study concerns the extraction of a panel, called T05 (Figure 14). The objective of the numerical modelling was to determine the final length of the panel, which would ensure safety and profitability. The large scale numerical model allows to include the old panels mined out before and can influence the induced seismicity. Three geometry configurations were modelled using FAULT3D code (INERIS code): 450 m, 500 m and 550 m. It takes into account four faults observed during the excavation of the galleries (Figure 14). The induced stresses are calculated based on the stress tensor measured in situ (Figure 14) using the hydraulic fracturing method. They are Young Modulus = 20,000 MPa and Poisson’s ratio = 0.25. The geomecanical parameters estimated for these faults are listed in the Table 1. These parameters are determined from in situ observations and previous analysis.
The results were analysed based on the behaviour of faults (Figure 15). We localised the failure areas. One can observe before the excavation to 450 m, the surface of the failure area still small, it increases when the face of the panel progresses by 100 m. Between 450 m and 550 m, the mine can induce seismicity due to the failure

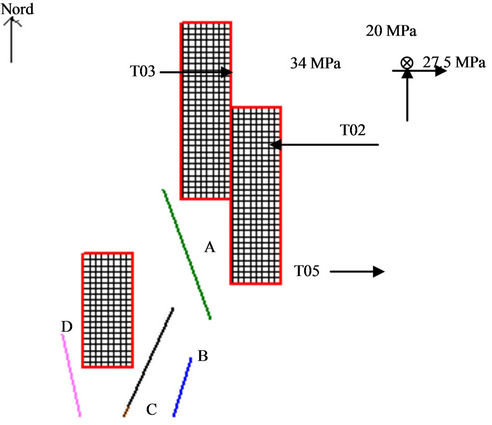
Figure 14. Map of panel T05, global numerical model: panel mesh and faults.

Figure 15. Failure zone localisation due to the mine advance.(a) length 450;(b) length 500 m;(c) length 550 m
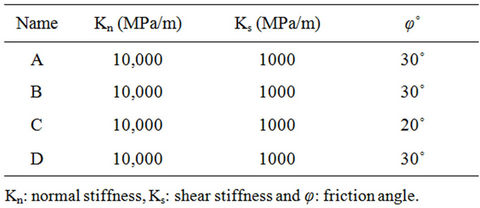
Table 1. Geomecanical parameters of faults.
of fault. The seismicity will be localized on the fault C which is on the roof of the mine. During the mining of this panel, four seismic events were recorded in the sidewall of V31 gallery. They were caused either by fault C or by the failure of the rock mass. However, the stresses induced by the panel progress are not large enough to induce more events.
6. Conclusion
Mine excavations at great depth induce seismicity. In France it was the main raison for closing the coalmines. Seismic and geotechnical tools were developed to improve mine design and increase the safety of dangerous and complex coalmine configurations. The employment of large scale numerical modelling using boundary element method allowed identifying the high stress zones and the failure zones of faults due to the progress of mines. The analysis of historic induced seismicity and the back analysis of the major events improve the understanding of strata behaviour. This methodology applied with success to the biggest rockburst in French coalmine with magnitude equal 3.6 and then to design last panels of Lorraine and Provence coalmines. The main conclusion of the paper is: to improve the safety it is necessary to develop operational methodology based on different scientific domains coupling numerical and geophysical tools.
REFERENCES
- N. G. W. Cook, “Seismicity Induced by Mining,” Engineering Geology, Vol. 10, No. 2-4, 1976, pp. 99-122. doi:10.1016/0013-7952(76)90015-6
- Z. T. Bieniawski, “Strata Control in Mineral Engineering,” Netherland Rotterdam, Balkama, 1987, pp. 111-133.
- W. D. Ortlepp, “RaSiM Comes of Age—A Review of the Contribution to the Understanding and Control of Mine Rockbursts SRK Consulting,” Johannesburg, 1997.
- M. R. Hudyma, “Mining-Induced Seismicity in Underground, Mechanised, Hardrock,” 2004.
- A. M. Linkov, V. Zoubkov, Heib M., et al., “Computer Aided in Analysis of Stressed State and Rockburst Hazard in Veins and Coal Seams Influenced by Faults,” Proceedings of the 1st Southern African Rock Engineering Symposium, Johannesburg, 15-17 September 1997, pp. 44-55.
- M. Al Heib, “Numerical Modelling Applied to Dynamic Phenomena—2nd North American Rock Mechanics Symposium—June 1996—Numerical Modelling of Ground Burst Problems—Workshop Notes,” Mc Gill, Montreal, 1996, pp. 3-1 to 3-12.
- R. J. Durrheim, M. K. C. Roberts, A. T. Haile, T. O. Hagan, A. J. Jager, M. F. Handley, S. M. Spottiswoode and W. D. Ortlepp, “Factors Influencing the Severity of Rockburst Damage in South African Gold Mines,” Journal of the South African Institute of Mining and Metallurgy, Vol. 98, No. 1, 1998, pp. 53-58.
- G. Senfaute, M. Al Heib, J. P. Josien and J. F. Noirel “Detection and Monitoring of High Stress Concentration Zones Induced by Coal Mining Using Numerical and Microseismic Methods. Rockburst and Seismicity in Mines-South African Institute of Mining and Metallurgy,” 2001.
- G. Senfaute, P. Bigarréand and J. P. Josin, “Real-Time Microseismic Monitoring; Automatic Wave Processing and Multilayered Velocity Model for Accurate Event Location,” Rock Mechanics in Petroleum Engineering, Delft, 29-31 August 1994, pp. 631-638. doi:10.2118/28106-MS
- M. D. G. Salamon, “Deformation of Stratified Rock Masses: A Laminated Model,” Journal of the Southern African Institute of Mining and Metallurgy, Vol. 91, No. 1, 1991, pp. 9-25.
- S. L. Crouch, “Computer Simulation of Mining in Faulted Ground,” Journal of the South African Institute on Mining and Metallurgy, Vol. 79, No. 1, 1979, pp. 159-173.
- G. Beer and B. A. Poulsen, “Efficient Numerical Modelling of Faulted Rock Using the Boundary Element Method,” International Journal of Rock Mechanics and Mining Sciences & Geomechanics Abstracts, Vol. 31, No. 5, 1993, pp. 485-506.
- I. G. T. Thin, R. J. Pine and R. Trueman, “Numerical Modelling as an Aid to the Determination of the Stress Distribution in the Goaf Due to Long-Wall Coal Mining,” International Journal of Rock Mechanics and Mining Sciences & Geomechanics Abstracts, Vol. 30, No. 7, 1993, pp. 1403-1409.
- L. Jing, “A Review of Techniques, Advances And Outstanding Issues in Numerical Modelling for Rock Mechanics and Rock Engineering,” International Journal of Rock Mechanics and Mining Sciences, Vol. 40, No. 3, 2003, pp. 283-353. doi:10.1016/S1365-1609(03)00013-3
- A. McGarr and G. A. Wiebols, “Influence of Mine Geometry and Closure Volume on Seismicity in a DeepLevel Mine,” International Journal of Rock Mechanics and Mining Sciences & Geomechanics Abstracts, Vol. 14, 1997, pp. 139-145. doi:10.1016/0148-9062(77)90005-5
- K. Kanelo, K. Sugawara and Y. Obara, “Rock Stress and Microseismicity in a Coal Burst District. Rockburst and Seismicity in Mines,” In: F. B. Rotterdam, B. Amadei and O. Stephansson, Eds., Rock Stress and Its Measurements, Chapman and Hall, London, 1990. doi:10.1007/978-94-011-5346-1
- D. N, Bigby, J. W. Cassie and A. R. Ledger, “Absolute Stress and Stress Change Measurements in British Coal Measures, Eurock’ 92,” London, 1992.
- P. Gaviglio, P. Bigarré, H. P. Baroudi and R. Monteau, “Measurements of Natural Stresses in a Provence Mine (Southern France),” Engineering Geology, Vol. 44, No. 1-4, 1996, pp. 77-92.
- F. Lahie, P. Bigarré, M. Al Heib, J. P. Josien and J. F. Noirel, “Large-scale 3D Characterisation of in-Situ Stress Field in a Complex Mining District Prone to Rockbursting,” Proceedings of the 10th International Congress on Rock Mechanics (ISRM), Vol. 2, Sandton, 8-12 September 2003, pp. 689-694,
- G. Senfaute, C. Chambon, P. Bigarre, Y. Guise and J. P. Josien, “Spatial Distribution of Mining Tremors and the Relations to Rockburst Hazard,” Journal of Pure and Applied Geophysics, Vol. 150, No. 3-4, 1997, pp. 451-459.
- V. Renaud, L. Driad and M. Al Heib, “Back-Analysis of the Rockburst in Frieda5 and Design Program Fro Panel in Seam 6 (HBL—Fsrance), Rockbursts 2002—International Synposium: Research and Pevention Systems— Silesia-Poland,” 2002.
- M. Sylla, G. Senfaute, M. Al Heib, Y. Derrien and J. P. Josien, “Prévision du Comportement des Terrains Sous L’Influence des Failles par des Méthodes Numériques et Microsismiques,” The 28th International Conference of Safety in Mines Research Institutes, Bucharest, 1999.
- M. K Abdul-Wahed, M. Al Heib and G. Senfaute, “Mining-Induced Seismicity: Seismic Measurement Using Multiplet Approach and Numerical Modelling,” International Journal of Coal Geology, Vol. 66, No. 12, 2006, pp. 137-147.